
Payroll Jan 2025: Into the Occupational Weeds
We pull back the curtain on the headline payroll number and evaluate the moving parts across occupation categories.


The headline +143K nonfarm payrolls number represents some relative cooling from the prior two months but no alarms yet for what is a resilient job market the past year. The next few months will reveal where policy impacts begin to be felt on the ground.
Job gains were again concentrated in Services and Public sector payrolls with Healthcare, Retail Trade, and Government payrolls the largest share of the gains.
Manufacturing numbers overall came at +3K but gains came primarily from already declining industries with a major hit to Auto payrolls. With North American auto production potentially facing supplier chain upheavals and severe tariff headwinds, layoff risk in autos will be one to watch closely based on final tariff decisions and any potential disruptions.
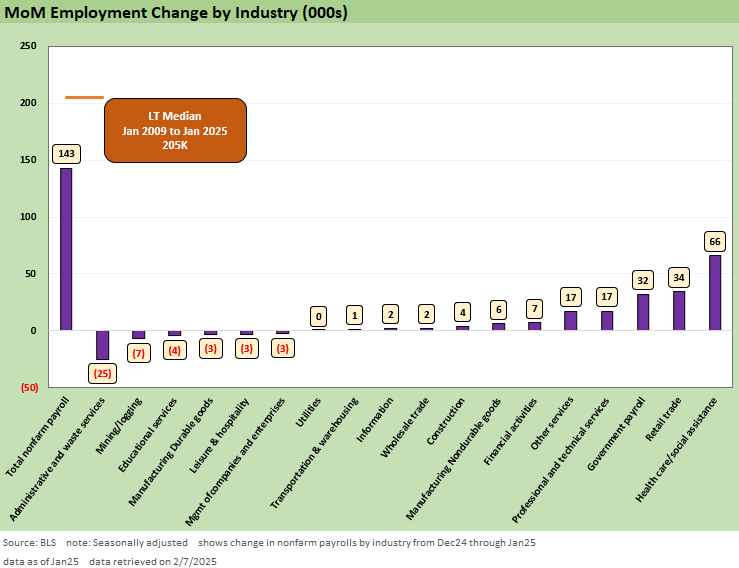
The above chart gives a top-level overview of the monthly changes for this morning’s +143K number. There are few surprises across the top 3 gainers, and demographically driven demand for Healthcare continues to lead the pack for consecutive months. Government payroll at #3 this month continues to be a counterbalance to the relatively slower private growth similar to 2024. That jobs support is in the crosshairs even if the Federal payrolls are relatively small compared to State and Local.
The laggards this month are led by Administrative and waste services contributing a -25K payroll drag. This particular sector includes temporary help where a steady decline continues after a post-COVID spike and is more about reallocation within the payrolls mix.
Mining and Logging and Durables are areas of continued focus for the next leg of policy ambitions, and both declined in January. As we’ve covered before, this is not a cyclical story but rather a long term sectoral decline whose path will be tested by rising trade tensions and more supply chain shifts.
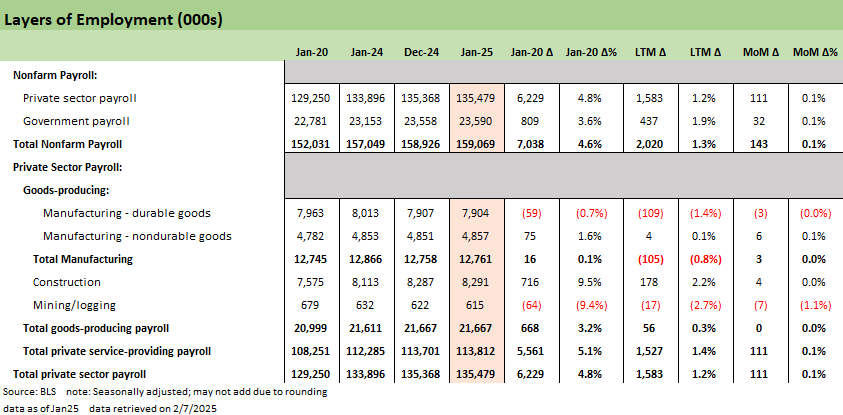
The table shows a top-level summary of the moving parts in today’s release. It also covers the trend for pre-COVID and LTM periods as well as the latest monthly moves. The overall adds this month are on par with the LTM trend with +111K private and +32K public payroll. Digging down into the private payrolls, we see stagnation in goods-producing industries with private sector gains entirely focused on the services side. Continued weakness in Mining and Logging is evident in an almost 10% decline since COVID and another -7K this month.
The resilience of the services sector growth will always underpin headline growth given that it comprises over 70% of the overall payroll total. However, given the concentration of the payrolls growth to typically low-margin industries with low multiplier effects, the translation to renewed economic growth is hard to see.
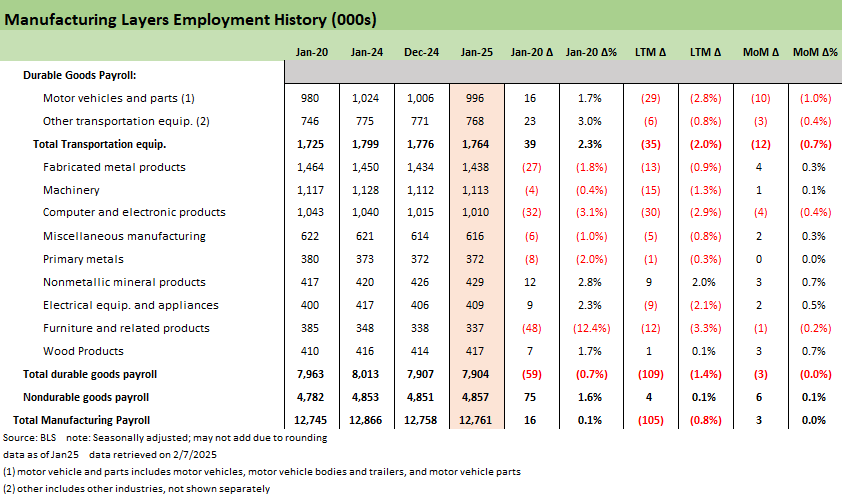
The next chart covers Manufacturing growth with a focus on Durables. Looking across the LTM trend, we see very few bright spots with only Nonmetallic mineral products and Wood products seeing growth over the last year.
Today’s numbers have a few more positive variances with most industries seeing growth but not enough to outweigh the -12K decline from Transport Equipment. Most of that decline is tied to the Motor Vehicles and Parts line that has remained relatively flat across the post-COVID period. Whether policy actions and tariffs will change the landscape for these operators remains to be seen. The last round of tariff actions and trade spats did not serve as a catalyst for a manufacturing renaissance, and the current actions do not inspire confidence that this one will either.
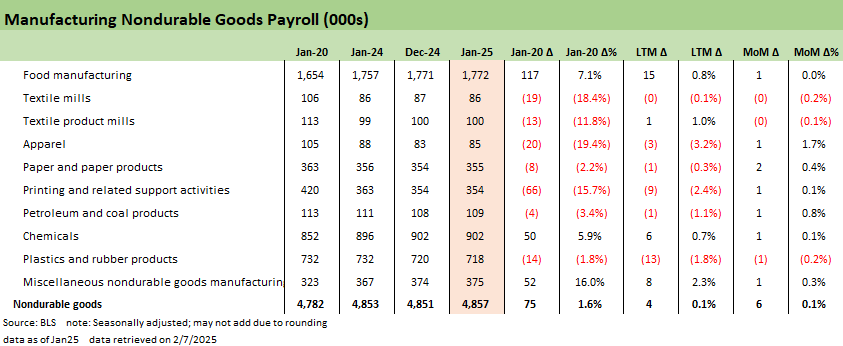
The Nondurables side of manufacturing has long been a laundry list of industries in secular decline amid a globalization of trade and offshoring trends that favor the lowest cost labor sources. Very minor adds this month do not change the nature of several double-digit declines with only Food manufacturing, Chemicals, and Miscellaneous goods on a positive trajectory since COVID.
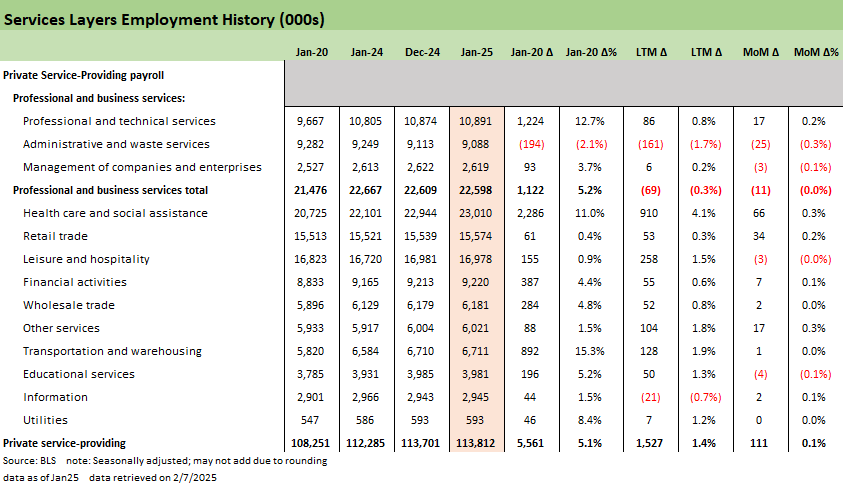
As already covered above, the major swings for the headline numbers are within the Services sector with the biggest gainers and losers. The resilience in Services the past few years at least provides the jobs to push back on economic slowdown scenarios. We expect that the growth will remain relatively robust here but what impact the immigration crackdown may have on these areas could be seen in coming months. The word “undocumented” implies data quality questions. The multiplier effects may not be there, but the wages paid still become tomorrow’s PCE, and there are a lot of wages paid out to a large swath of the labor force.
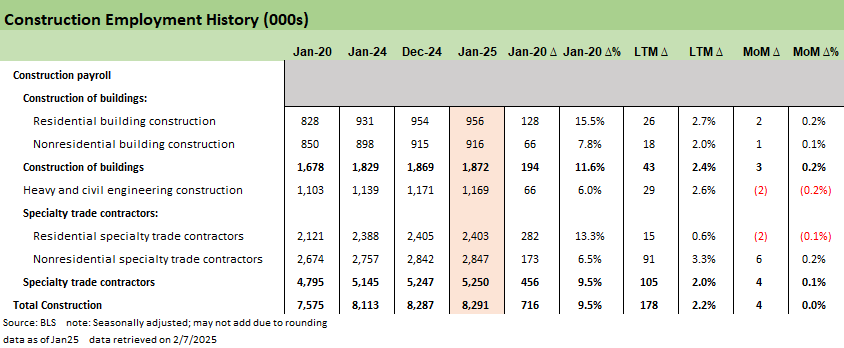
This chart covers Construction employment that saw another positive month at +4K as last year’s momentum continued. The gains this month stem from the Nonresidential lines whose growth lagged Residential in the previous period.
Demand for residential construction is old news and a small shift towards Nonresidential this month does not provide a meaningful signal. The Construction industry sits at the center of the crosscurrents of tariff actions, stubborn interest rates, and immigration policy all being key pieces of the puzzle to watch in coming months.
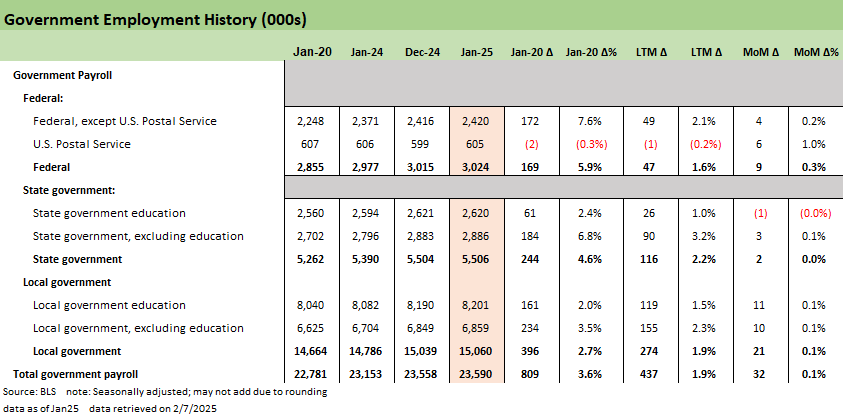
The last chart of the collection covers the Public sector payrolls. As we covered earlier, expanding State and Local payrolls offered meaningful support for the moderate growth in 2024 and that continued again – at least for now. Signals are mixed as to where Federal hiring goes can be debated, but the likely direction of Federal payrolls will be contracting with ripple effects that will get tested in the upcoming months.
See also:
Payroll Jan 2025: Staying the Course 2-7-2
Trade Exposure: US-Canada Import/Export Mix 2024 2-7-25
US Trade with the World: Import and Export Mix 2-6-25
The Trade Picture: Facts to Respect, Topics to Ponder 2-5-25
JOLTS Dec 2024: Before the Tariff JOLT Strikes 2-4-25
Footnotes & Flashbacks: Credit Markets 2-3-25
Footnotes & Flashbacks: State of Yields 2-2-25
Footnotes & Flashbacks: Asset Returns 2-2-25
Tariffs: Questions to Ponder, Part 1 2-2-25
Mini Market Lookback: Surreal Week, AI Worries about “A” 2-1-25
PCE: Inflation, Personal Income & Outlays 1-31-25
Employment Cost Index 4Q24: Labor Crossroad Dead Ahead 1-31-25
4Q24 GDP: Into the Investment Weeds 1-30-25
4Q24 GDP: Inventory Liquidation Rules 1-30-25
Credit Crib Note: Lennar Corp 1-30-25
D.R. Horton: #1 Homebuilder as a Sector Proxy 1-28-25
Durable Goods Dec 2024: Respectable ex-Transport Numbers 1-28-25
New Home Sales Dec 2024: Decent Finish, Strange Year 1-28-25