
Construction: Project Economics Drive Nonresidential
We update the state of the construction markets that have proven to be a resilient tailwind.


We revisit the construction picture across the wave of activity in nonresidential with a resilient but lower level in pockets of residential.
As one of the biggest downstream buyers of chemicals and metals and a major source of equipment demand, construction markets are a critical part of the macro story.
Market participants are starting to distinguish between CRE asset quality and valuation questions around legacy leveraged commercial real estate assets from the “new stuff” that is based on the economics of the project and supported by investors and lenders.
Despite the potential for sustained pressure on valuations, the construction numbers are not flagging recession risk in this corner of the US economy with YTD numbers through August at +4.2% for total construction and +17.9% for nonresidential.
We see some subcategories running at materially higher levels led by Manufacturing as the largest line item.
The latest construction numbers keep the beat going on the solid trend line as evident in the chart below. The category details broken out in the charts are reassuring even if the reality of higher interest rates will weigh on the sustainability of growth. The demand side does keep alive the potential for a continued high rate of spending in areas such as manufacturing and healthcare.

The chart above shows the favorable growth trajectory over the last few years. Those who do not look at this data often may be surprised that the public sector piece is much smaller than private and growing much more slowly.
As we look back across the cycles, we see upward moves with the buildout after the TMT cycle. The 2001-2004 period saw Greenspan frantically go into easing mode (notably in 2001) on the way into a tightening cycle and ensuing bear flattener from the end of 2003 through 2006. (see Greenspan’s Last Hurrah: His Wild Finish Before the Crisis 10-30-22, Fed Funds, CPI, and the Stairway to Where? 10-20-22). Rates were low in absolute terms and that led to all kinds of residential and nonresidential excess as we discuss in other commentaries.
The challenge coming off the bottom of the construction cycle around late 2010/2011 was getting the economy and risk appetites going again (ZIRP through the end of 2015, QE, etc.). We see that in the protracted climb in construction across Obama II, Trump, and Biden. COVID was a brief issue, but most construction activities were deemed essential (i.e., not shut down) and the economic trajectory was at least positive.
Construction as macro tailwind…

As we rolled out the other side of COVID, the changeover into a new administration came with massive supplier chain disruptions and inflationary pressures that were compounded by labor, material, component, and appliance shortages and then an oil spike. Despite that, the construction markets have proven resilient, aided by aggressive government policy actions that bolstered a wide range of construction activity. That drove construction jobs materially higher also.

The construction employment trend line since just before COVID is broken out in the above table. We see 413K jobs added in construction since Jan 2020 and 212K over the last 12 months. Those are jobs that pay well and have some staying power and bring a lot of demand with the activity (e.g., pickup trucks, power gen, materials, electronics, waste management, utility services, etc.).
With a fresh dose of growth in the supplier-chain-intensive construction markets (labor, land, material, goods, services, etc.) came more demand side inflationary pressures that brought the requisite (but belated) Fed tightening cycle.
That upward migration of the UST curve brought higher costs and weaker economics to many projects. The long-embraced rule that higher rates shorten real estate cycles has not spilled over to numerous pockets of the nonresidential markets even if there has been a major toll on residential affordability.
The nonresidential lift is tied to a range of factors including secular demand in manufacturing and energy, demographic demand in health care and residential housing (heavy on the multifamily mix shift), and regulatory and government policy priorities. That has made for some good mega-project growth across EVs, Semis, LNG, and more as discussed in other pieces.
We last wrote up the construction macro picture back in May (see Construction Spending: Demystifying Nonresidential Mix 5-9-23) where we highlighted the exceptionally strong growth in construction outlays unfolding in nonresidential with a heavy dose of mega-projects across areas such as infrastructure, batteries, semiconductors, LNG, etc. The main goal of that piece was to demystify the nonresidential mix when seemingly everyone was panicking over offices as a property class disappearing from the planet.
The point is that leveraged properties fading in value (due to rents, occupancy, etc.) and creating asset risk for lenders (bank, CMBS, etc.) are separate issues from the construction projects that are driving economic activity from manpower/employment to upstream suppliers to such projects (equipment of all types, chemicals, metals, freight and logistics services, etc.).
Construction is also a major employer as noted earlier. Jobs and dollars are a fact and very much in the economic numbers from manpower to the supplier chains and related services. The policies encouraging these projects have been positive influences on economic growth.
There is an easy case to be made that Biden’s economic plans were driving construction markets while Trump tariffs ended up serving as a catalyst for lower fixed asset investment capex that fed into a Fed easing in 2019. Of course, Biden has lacked the political will to dial back most of the Trump tariffs.
The multiplier effects of construction are also not hard to trace. There is a reason we saw solid performance and guidance from a range of names from Caterpillar to United Rentals (see Rental Equipment: A Cyclical Confidence Booster 9-15-23). There is a lot of demand and a frenetic level of activity in some major, multiyear projects with some tailwinds from the legislation supporting infrastructure, semiconductors, and EV related supplier chain needs (batteries, lithium, assembly plants, etc.)

The chart above plots the running YoY trends by month from mid-2019 through Aug 2023, and we again see the very strong rebound of 2021 coming off a very challenging 2020 for construction markets even with ZIRP, stimulus and exceptionally low absolute rates.
After seeing a fade in 2018, the market rebounded in construction in parts of 2019 with the Fed returning to modest easing and the cycle extending ahead of the COVID crash. The UST migration was going to take its toll on housing in 2022-2023, but the infrastructure bill (passed late 2021) and the CHIPS and IRA legislation (both passed in summer 2022 ahead of election) lit the fuse for a lot more construction spending ahead.
Total construction put in place…
In the next series of charts, we frame private and public construction. We can slice and dice it from a range of angles, but the main questions are straightforward enough as we look across cycles.
Where is the aggregate number trending and what does that mean in broader economic context?
What are the multiplier effects that come with almost $2 trillion in construction spending on a SAAR basis?
What are the main categories driving the growth and which end markets are the key sources of demand?
Is the demand speculative and/or a function of easy credit and low rates (clearly not the latter in the current cycle!)?
How sustainable are the growth rates and is there a healthy mix of multiyear projects?
As we discuss below and in other commentaries, the residential side is doing well in multifamily, but the construction pace is not sustainable. At least the projects are based on economic reality tied to residential demand.
For single family residential, the supply-demand imbalances for homes are a helpful fact, but mortgage rates and affordability have tightened up supply while allowing builders to pursue some projects with lower business risk than seen in past cycles (see August New Homes Sales: Feeling the Burn Yet? 9-26-23, August Existing Homes Sales: Same as It Ever Was 9-21-23).
Private nonresidential mix…
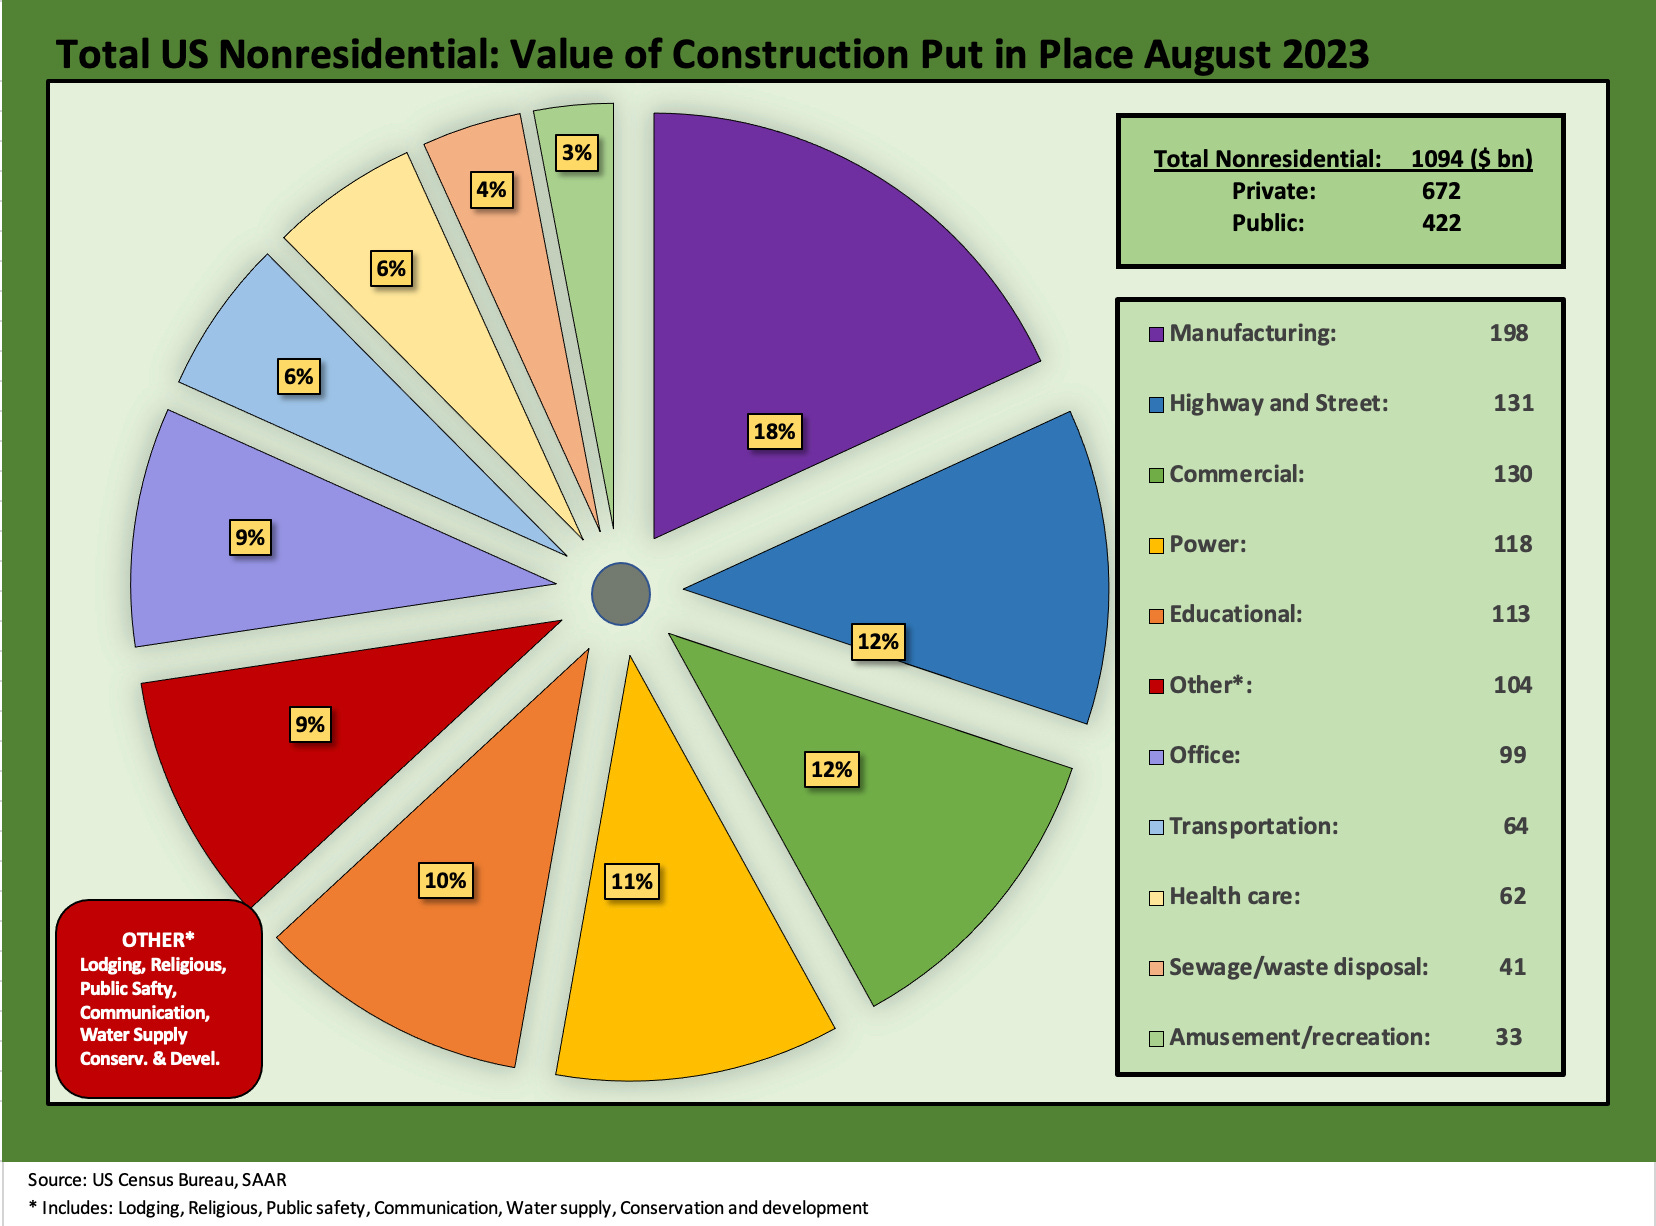
Below we revisit the mix of nonresidential construction from August 2023. The growth in each of these major line items is captured in the tables that follow.
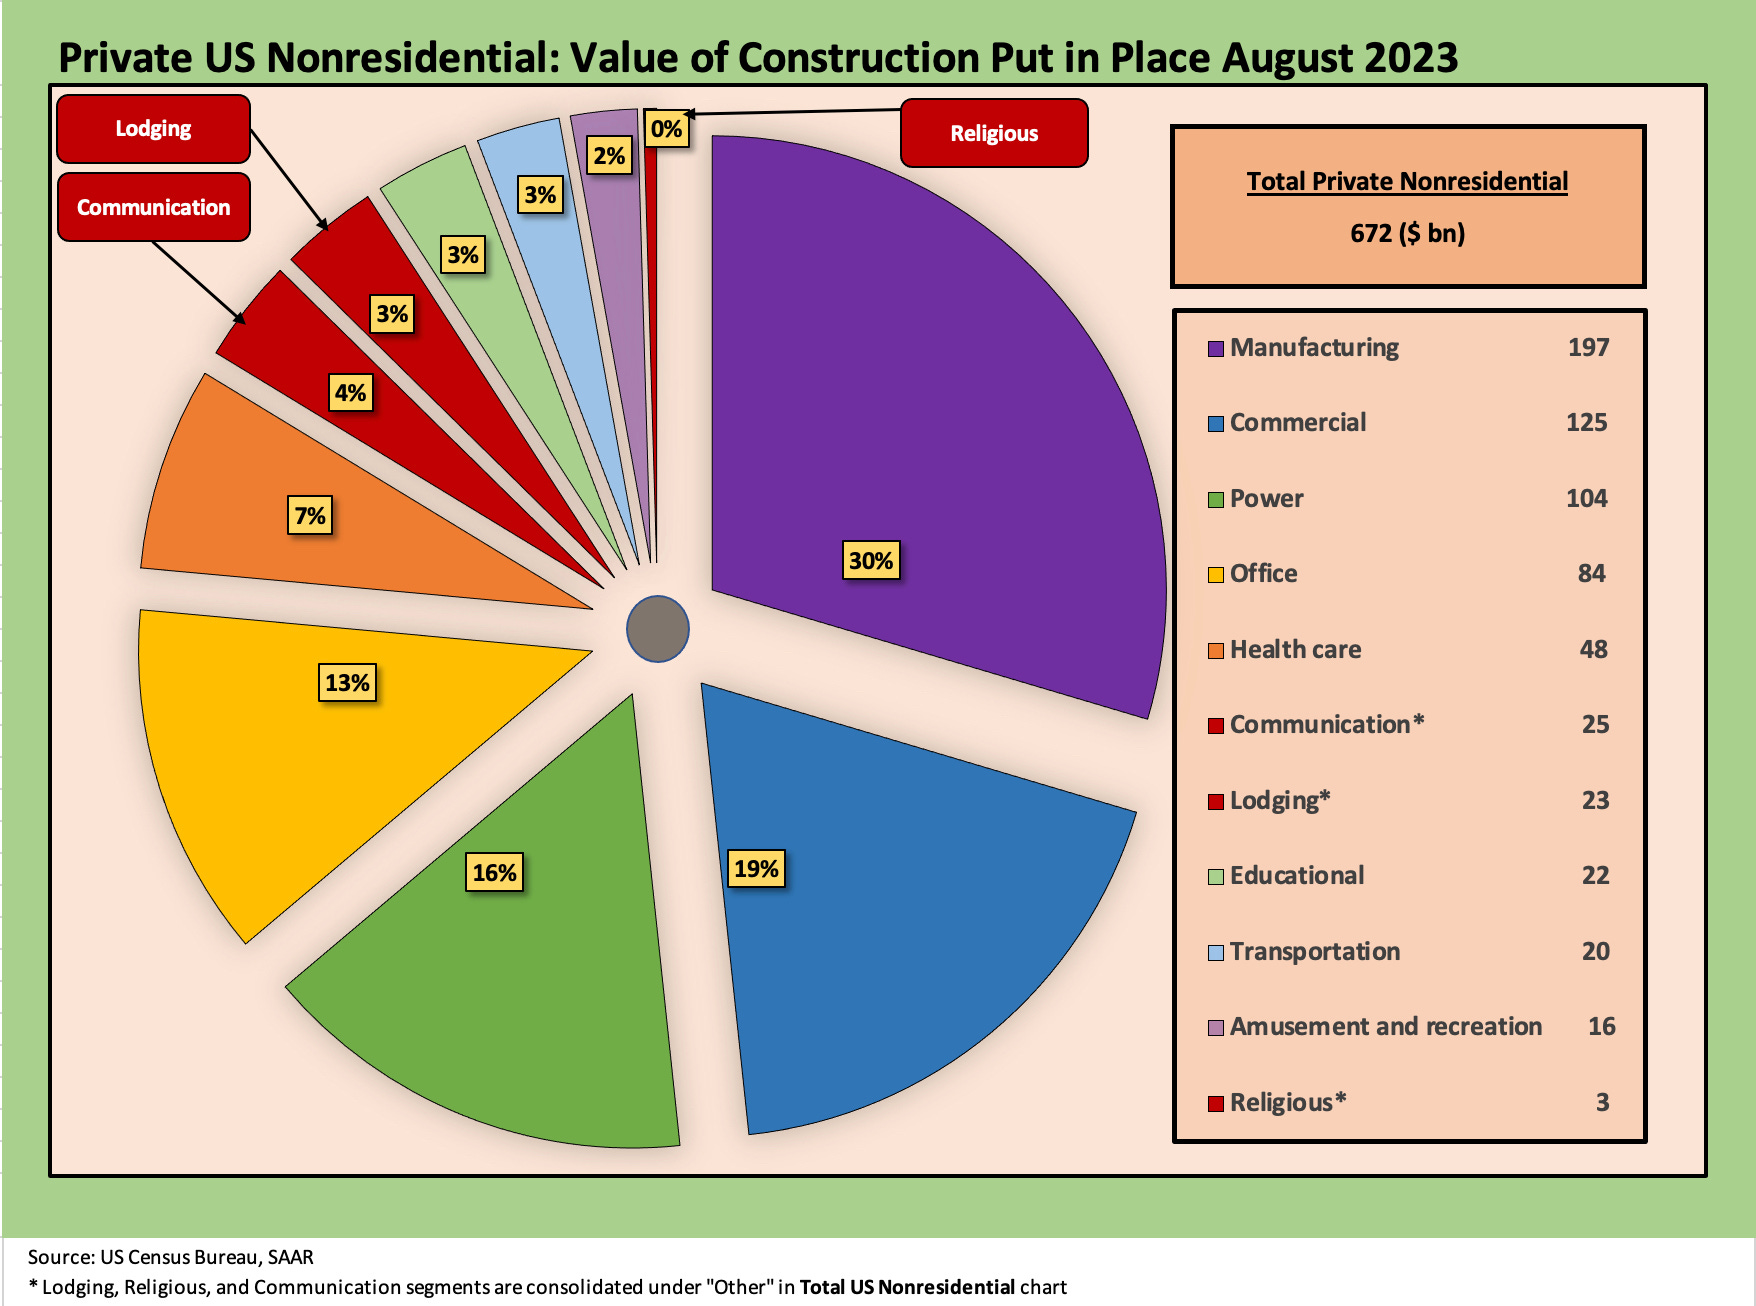
Looking across the private vs. public construction line-up in gross dollar terms, the above breaks out the nonresidential piece while below we see the MoM and YoY and YTD % deltas.

The total breakdown and mix detailed above shows how important manufacturing construction is in a market where that sector had been stagnating in past cycles and needed a lift.
The legislation and policy priorities are paying off despite the double talk on who posted what to drive US economic performances during their administrations (see Employment Across the Presidents 8-15-23, US Downgrade: Pin the Tail on the Sovereign Ratings Criteria 8-2-23, GDP 2Q23: The Magic 2% Handle 7-27-23, 1Q23 GDP: Facts Matter 6-29-23). Growth is good, and the numbers are a fact, not an opinion.
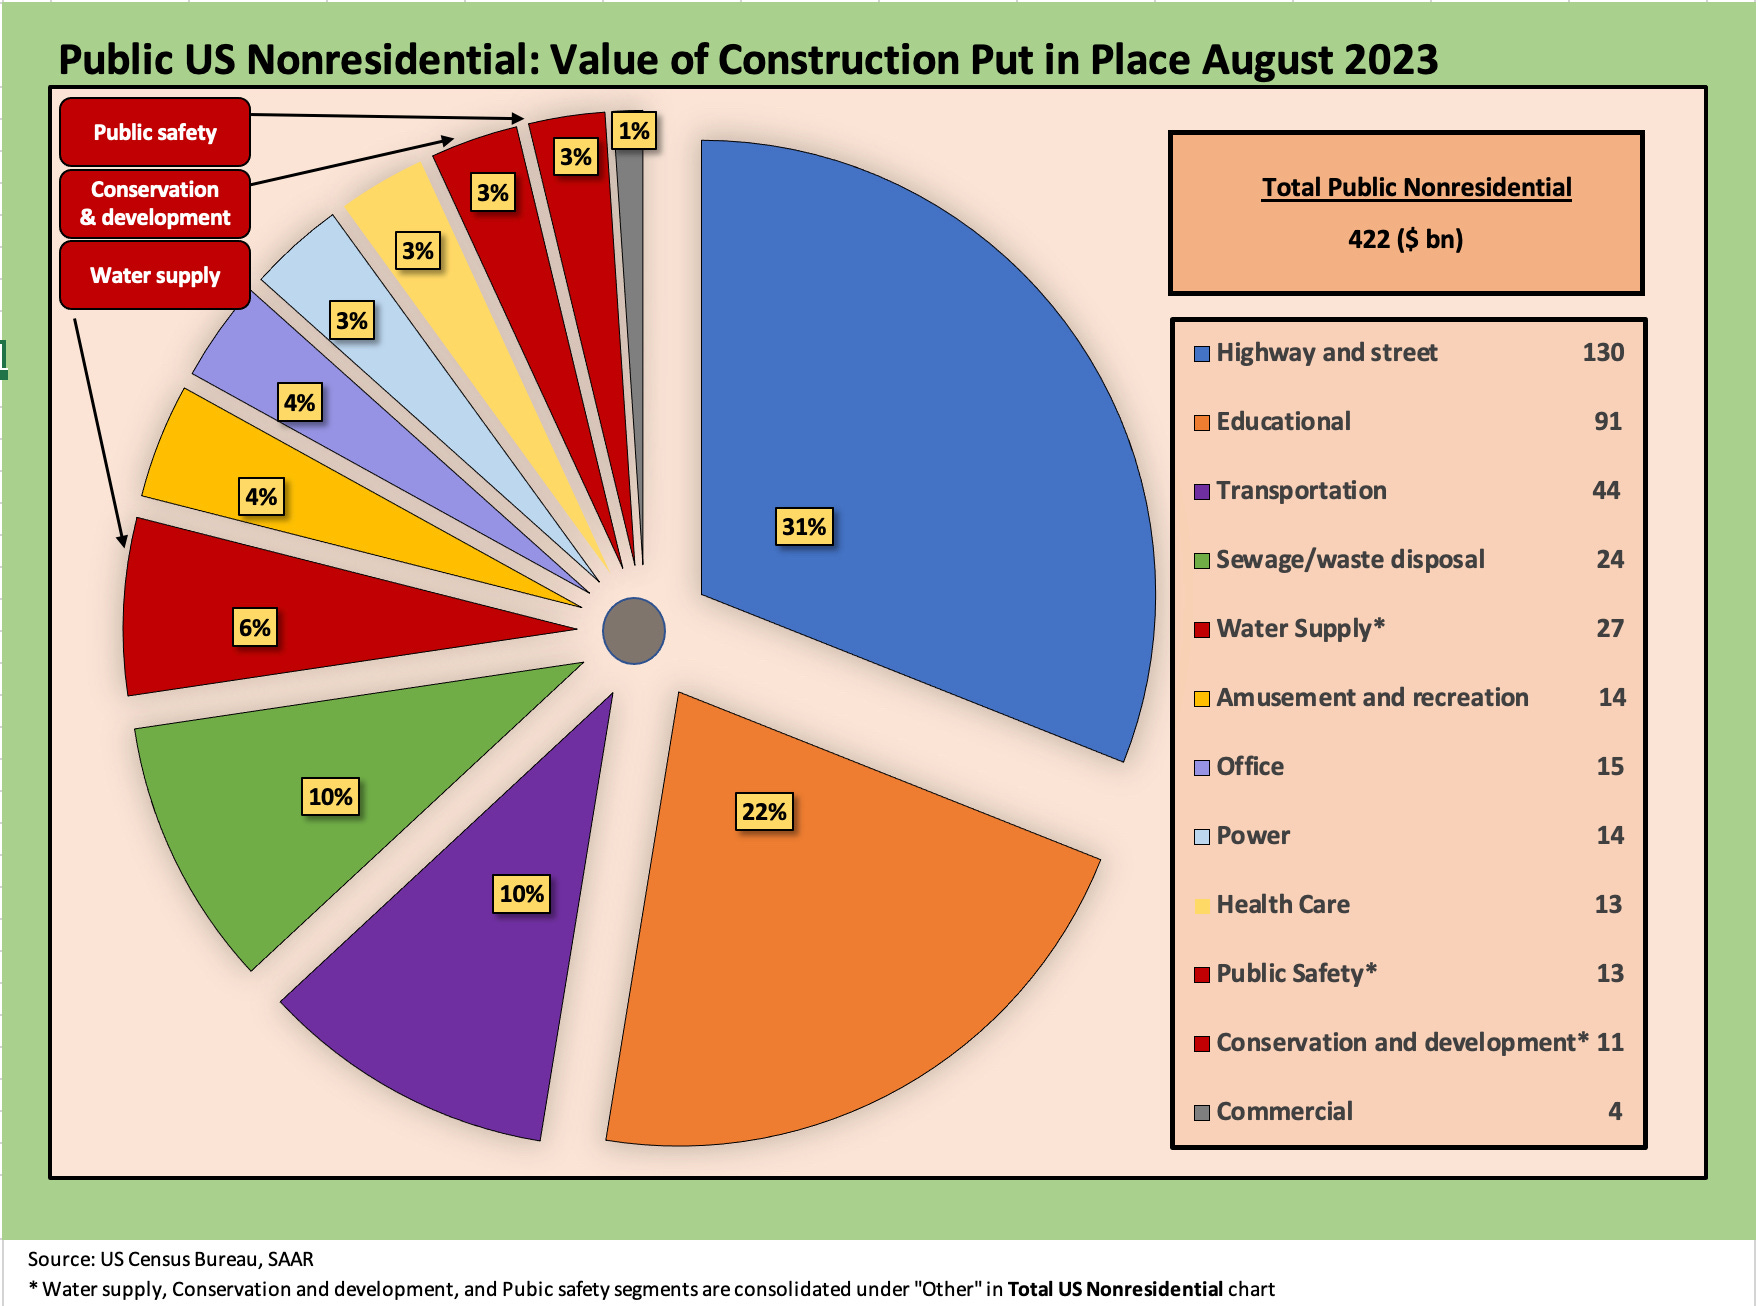
Public sector construction…
Below we detail the public construction mix. The private sector construction is around 4x the public sector if we combine nonresidential and residential in the mix. Despite a lot of political complaints on the topic, residential is a small line item in the mix for the public sector. Nonresidential is the main event for public construction.

The public sector is heavily about the nonresidential categories, so we detail the mix below as well with a different visual angle on mix. The public sector has some major categories such as Highway and Street, Educational, Transportation, and Sewage and Waste.
The increase in construction is heavily about private sector spending, but the policy initiatives are key catalysts nonetheless to provide the incentives (tax, tariffs, regulatory, etc.). The idea of infrastructure bills becoming a reality finally took shape in late 2021 after years of being a punchline.
Trump missed on infrastructure, opting for the second biggest tax cut in history. Relative to GDP, Reagan’s was bigger, but Trump claimed the long division was rigged. So, he threw a Big Mac at a Reagan portrait (…not true of course…as far as we know). The GOP thus did not deliver an infrastructure bill despite controlling the Senate and House.
Biden got it done with bipartisan support since a lot of money (disproportionately more) was heading to red states and swing states. That is old school politics as in “who gets the money.” Life was easier in Washington when you could add pork and bribe leaders for votes. It was at least rational.