Construction Spending: Demystifying Nonresidential Mix
We demystify the nonresidential construction spending mix at a time when lending standards and bank pressure are in the headlines.
"I bet this thing goes residential someday"
With so much talk about Offices narrowly and Commercial Real Estate generally set against all the regional bank turmoil, we take a stab at demystifying the construction mix by category in both private and public sector spending.
While the asset subsector “offices” is taken in vain these days, we thought some focus on the mix of dollars spent by category would offer some perspective on relative scale across the line items.
The manufacturing construction outlays have been blisteringly hot YoY in numerous categories, and many of those projects entail multiperiod timelines even as residential is starting to show stabilization and hints of a slow upturn.
In this commentary, we look at some of the line items that roll up into the monthly Census Bureau Construction spending report. We looked at the GDP line items and trend line for fixed asset investment in our recent 1Q23 GDP update (see GDP 1Q23: Devils and Details 4-27-23). In that GDP note, we had plotted the multicycle time series of fixed investment across residential, nonresidential structures, equipment, and intellectual property spending (primarily software and tech). We will need to dig into some of those subcategories in more than one publication. For this note, we look more narrowly at the monthly construction spending data for March 2023 that was released last week.
We also tie the jobs picture back into the construction topic by detailing the timeline and categories for construction payroll from Jan 2020 through Friday’s April 2023 report (see Employment April 2023: Post-COVID Deep Dive by Occupation 5-5-23). Excess demand for labor in residential and some pockets of nonresidential has been part of the wage inflation story. Some services see over 6% wage increases for construction and some see over 5% (Friday’s employment report shows +5.4% for construction), but the tight labor market in construction is clear enough with a wide range by skill set.
Construction activity and the more expansive categories of “nonresidential” and a murkier definition of “commercial real estate” has been singled out more than a few times in recent headlines and will stay in the red zone of focus across 2023.
To start this week, there is a lot of talk about concerns cited in the quarterly Senior Loan Officer Surveys (SLOOS) released on Monday along with the biannual Financial Stability Report. Both have plenty of commentary on credit contraction risk and lending standards. We also had Berkshire Hathaway on the weekend citing commercial real estate as a major problem for the banks.
Some questions to consider on real estate and construction spending as we move into 2Q23 and beyond tie into construction spending and related investments (and thus a lot of economic activity) and include the following:
Which of the construction categories will be more exposed to credit contraction?
How badly has the Fed tightening and yield curve migration since March 2022 undermined the economics of new projects?
Does an overleveraged real estate asset pool impact the incremental need to spend in many growth areas (e.g., infrastructure such as highways and roads or manufacturing projects such as EV related or semiconductors, etc.)?
Is weak debt service risk and too much leverage in the commercial real estate class more about CMBS and bank loan risk and repricing of legacy financial obligations than about derailing projects in process?
Would any major fallout from the real estate asset quality problem come at a lag as we saw in the early 1990s or be short and sharp as we saw after the credit crisis on mispriced and overleveraged deals?
Does the exercise still come down to one bank at a time, one financial instrument at a time (loan or securitization), and one subsector and geographic location at a time as the system works through this next round of asset quality erosion?
Is the bigger risk that the market tosses out the brush and grabs a roller to paint the asset class?
Will the idea of rising correlation across nonresidential asset classes be more imagined than real since projects that have good fundamentals, committed financing, and sound economics will always go ahead regardless?
We are not commercial real estate specialist by any stretch, but watching the direction of construction spending in the monthly reports from the Census this year will be worthwhile for those who want to gauge the downside economic risk and threat to fixed asset investment in the GDP accounts.
For March 2023 (data at a lag released May 1), the total construction numbers were up +0.3% sequentially on a SAAR basis and were up +3.8% YoY since March 2022, which started the 1-year yield curve pounding and tightening cycle. For 1Q23 only (not seasonally adjusted), construction spending was up +4.3% to $403.3 billion. That includes Private Construction up +2.0% YoY to $324 bn and Public Construction up +14.7% YoY to $79.3 bn. As we discuss below, there was a lot of range in those numbers and some surprising YoY growth to consider in some subsectors.
Construction employment still a mixed picture…
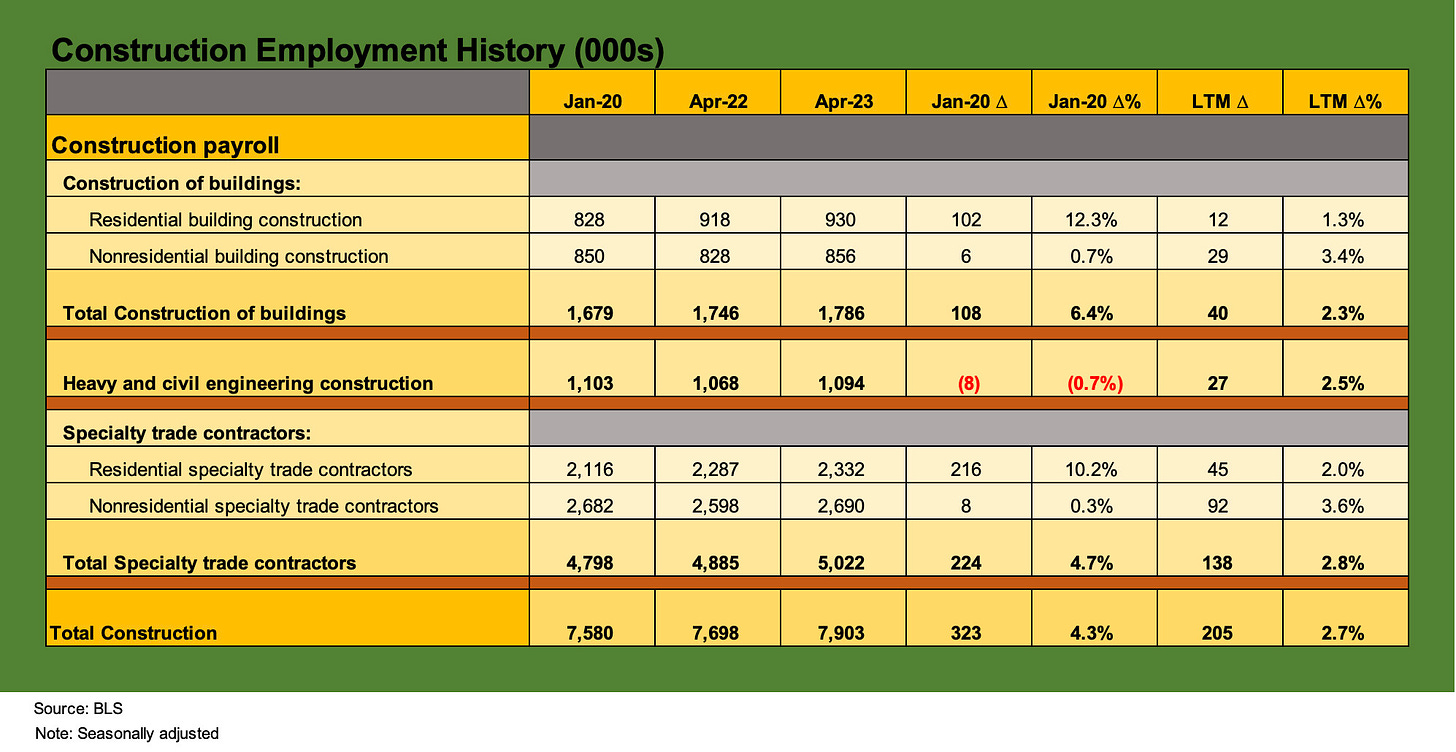
The above chart posts the payroll numbers for the construction line items of the BLS payroll data. We detail Jan 2020, April 2022, and April 2023 and add in the post-Jan-2020 delta and the LTM change in payroll for the construction occupations listed across residential, nonresidential, and heavy and civil engineering. In the payroll count, we see Nonresidential Construction jobs at +3.4% YoY and Nonresidential Specialty trade contractors at +3.6% LTM.
The construction payroll numbers are not signaling that a major setback is pending as the charts below will also highlight. The relatively stable recent sequential spending trends follow generally strong YoY growth vs. March 2022, when ZIRP was just being lifted and the Fed was embarking on an aggressive tightening with a sharp upward migration in the yield curve along with it.
The tightest market has been residential, which has also posted the biggest increase since Jan 2020. The setbacks in residential demand in 2022 and into 2023 on high mortgage rates and impaired affordability sometimes masks the very high rate of construction in progress in both single family and multifamily (see Housing: Starts and Permits and the Working Capital Challenge 4-18-23). While we focus on nonresidential in this piece, the monthly construction spending numbers show total residential down -9.8% YoY (total residential includes home improvement).
Looking across the spending categories…
In the next three charts, we look at the nonresidential construction spending mix by category. We produce a mix chart for total nonresidential construction spending. We emphasize that we are framing “Nonresidential” as a category and exclude “Residential.” We will cover residential trends separately. For information purposes, residential construction totaled $837 bn (SAAR) in March 2023 with 99% of that classified as Private Construction. Those total residential numbers include private residential improvement. The “new single family” line of $366 bn is well ahead of the new multifamily total of $123 bn in March 2023. Total private residential was down -10.0% YoY with “new” single family at -22.0% and “new” multifamily at +23.0%.
Following the first chart, we then generate the mix details for private construction in a second chart and public sector mix in a third chart. We are not trying to frame the credit risks and loan exposure of what the mix means for such critical asset class subsectors as CMBS. Those worries will keep commercial mortgage and commercial real estate lenders very busy ahead.
How those asset quality problems impact new lending to the space is quite relevant, and the worry is that defensive lending standards will necessarily undermine projects on credit availability, on rates, and on structural protections (for example owner personal guarantees). Some projects may simply wait for a friendlier yield curve and less defensive lenders. That heightens economic contraction risk.
As investors ponder what can go wrong in investment and cyclical threats to construction outlays, it is better to have a handle on what the spending mix is right now. We will then track it monthly and look for color from the supplier chain through their guidance on where they see weakness.
After the bullish commentary from United Rentals (see Signals & Soundbites: United Rentals 1Q23 4-29-23) and constructive color from Caterpillar (see Footnotes and Flashbacks: Week Ending April 30, 2023 ), the cyclical threat is easy to concoct, but you are not hearing it from the companies in the trenches on what they expect near term.
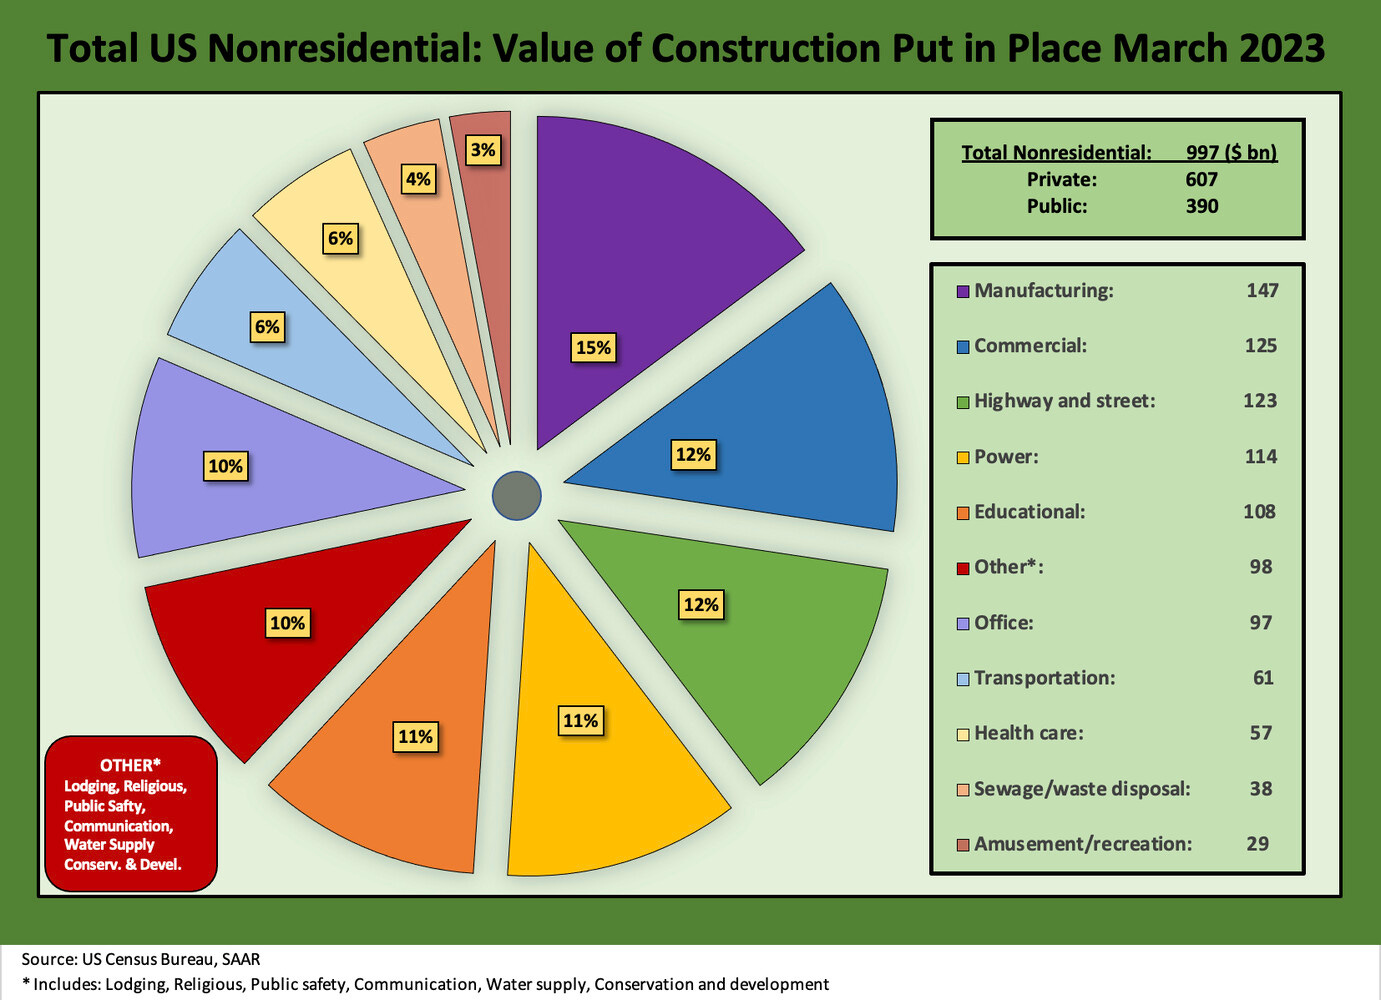
The above chart frames the category mix for March 2023 “value of construction put in place.” The mix by category is clear in the chart above. This first chart details the combination of Private and Public construction spending by category, and we see Manufacturing right at the top by a healthy margin. The next two pie charts break out Private and Public separately. The dollar totals for each category and for Private and Public are detailed in the chart.
We highlight that Manufacturing is up in March by an astounding +62.3% YoY on a SAAR basis. The second largest line item is Commercial at $125 bn and 12% of total, but we need to clarify that Commercial does not include Office, which has its own category at 10% of the total ($97 bn). Office construction was +15.3% YoY, well ahead of the total line of 3.8%, and that offers a reminder that it is very hard to generalize about the fate of entire subsectors even if the median trend line is more easily described. Quality of property, location, tenant risk, and a range of factors come into play. Distressed debt investors will be looking for real estate specialists. This may not be 1990-1993, but there is trouble ahead.
There will be no shortage of drama around Offices and default risks and debt restructuring and price pressures on CMBS or REITs in the space. There will be attempts to clarify what is an A, B, or C property and what risk lenders face. Certainly, the NYC office sector will be a discipline unto itself with Offices converting to Residential and the interesting battles that will ensue in bankruptcy courts on high leverage and tenant risks in the remote work age. Urban office challenges have been a topic since COVID.
With CAT and CNHI earnings now behind and companies such as United Rentals having weighed in, there is a mixed picture by market from the US to the global customer base. The run rate of economic activity is still very solid. That was clear in earnings season in capital goods and equipment rentals. The weight of the guidance flavor was on the bullish side of neutral for volume symmetry depending on the end market. The fear of “peaks” is justified for some such as CAT in the valuation debate, but “peak” does not necessarily lead to material contraction. That takes a lot more going wrong.
The forward-looking picture is more about what metaphorical missiles might strike spending plans with the big moving parts of systemic pain out there (debt ceiling, largest European land war since WWII, serious erosion of relations with OPEC nations, and the ultimate fear of unintended consequences with China). Bad relations with China also can be a catalyst for construction growth in the US as long as bad does not go “around the bend” to a trade war or military clashes.
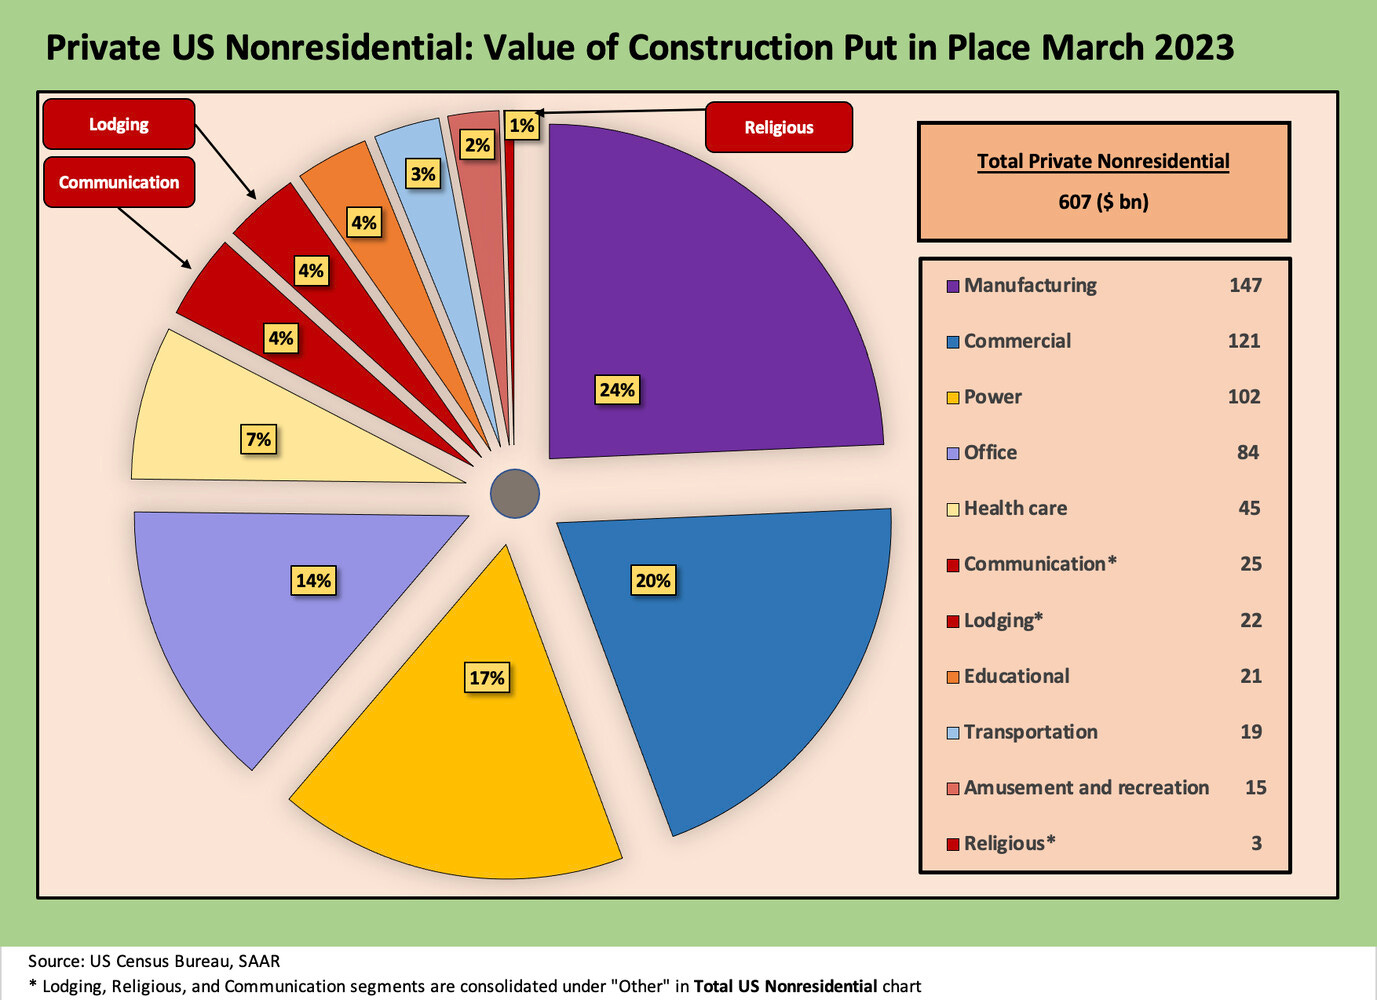
The above chart breaks out the private Construction mix and totals, and we see that Manufacturing is well ahead with Commercial at #2, Power at #3, Office #4, and Health Care at #5. The gap between #1 Manufacturing and #5 Health Care is over $100 bn.
For Private, we see Manufacturing at +62.5% YoY as we discussed above in the total section. The potential for a sustained high rate of manufacturing investment ahead is clear unless someone torches prospects by causing major economic setbacks. For example, Congress and a debt ceiling crisis could crush some private sector companies behind the expanded construction demand. A debt crisis could also cause some banks (larger and small) to pull back. If we see an economic crash on debt defaults, the oil patch will not be unscathed.
The rise of the Electric Vehicle (from assembly plants to supplier product evolution to battery makers, etc.) and the need to “reshore” more semiconductor capacity are the most frequently cited areas of manufacturing construction strength. The fears of unreliable supplier chains and “China risk” are growing increasingly pervasive for OEMs and services companies. The painful lessons of 2021-2022 from sourcing to freight have not been forgotten.
Power is another major line at #3, but that construction level has posted a small contraction sequentially both in total (public+ private) and in private construction. The Power line is overwhelmingly private ($102bn of the total $114 bn SAAR for March 2023). We see the sequential decline from Feb 2023 for private power at -0.3% and for YoY at -4.7%. Private Office is up +16.6% YoY while Health Care is +11.2% YoY. Health Care is at +0.6% sequentially from Feb 2023 or well ahead of the overall total sequential move of +0.3%.
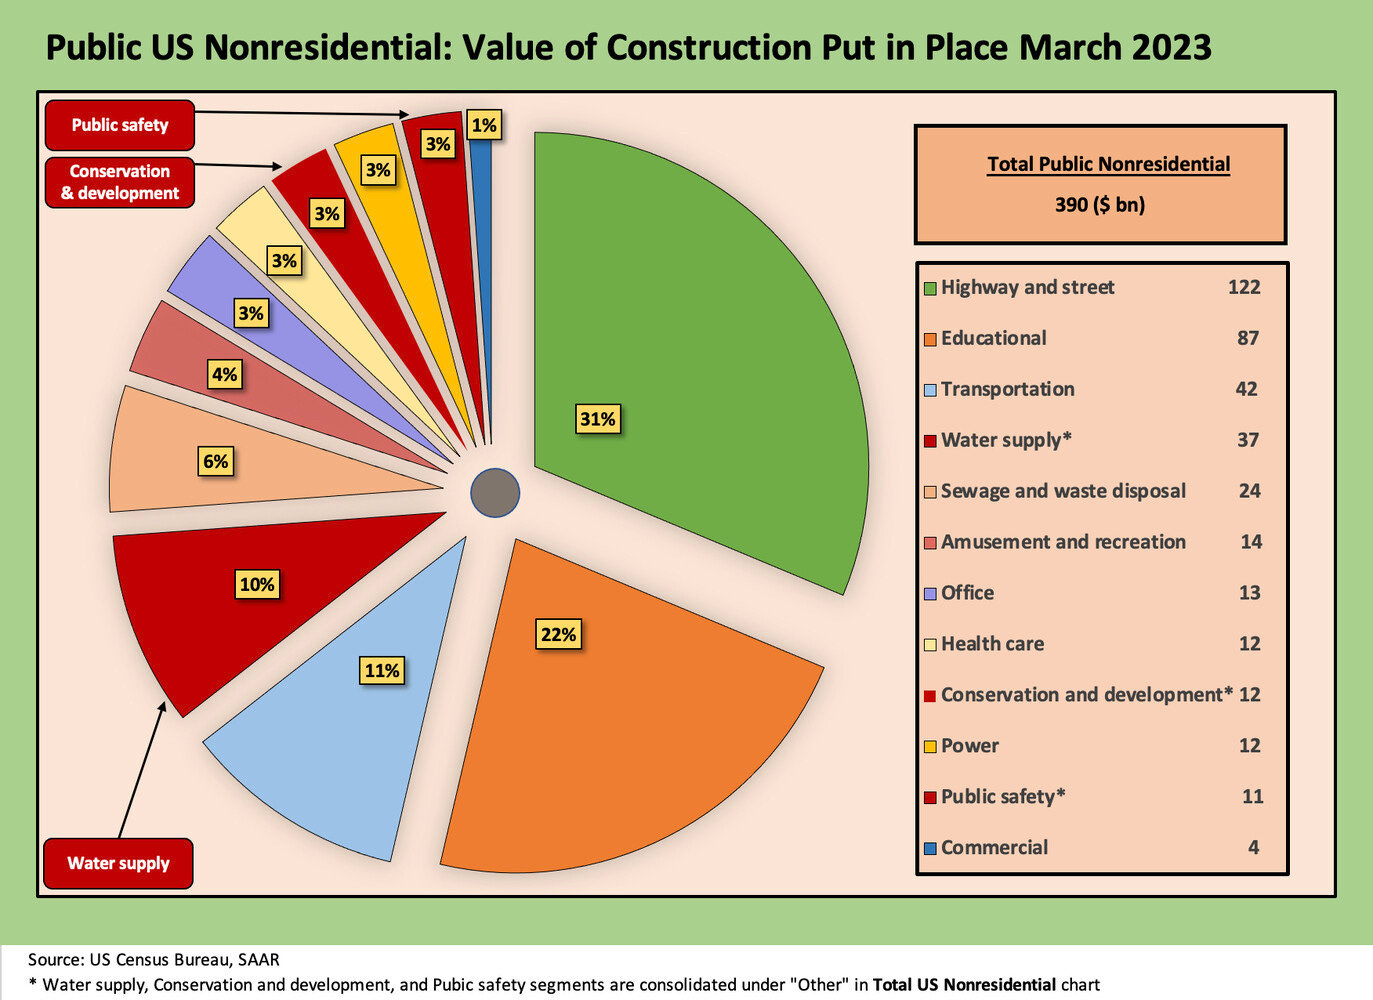
The above chart takes the same approach in the layout for the Public Nonresidential Construction for March 2023 of $390 bn (SAAR). Total construction of $390 was +15.0% YoY. Highway and Street are the lead category at 31% of total public construction spending at $122 bn as it increased +21.4% YoY vs. March 2022. The Infrastructure Bill was signed in Nov 2021, so the amounts in Public show five major categories up by a 20% handle YoY March 2023. We see 8 of the 12 categories up by double digits. That growth rate will necessarily level off depending on the pace of spending and budgeting decisions in Congress.
Education is #2 at 22% of total, so the two largest categories are over half the public spending allocation. We see education at +9.1% YoY. Transportation is a distant #3 and only increased by +4.8% YoY while being down -1.6% sequentially (no wonder rails and airports are a mess). Water supply is up by over 25% YoY and Sewage by over 24%, so that is 3 of the Top 5 up by a 20% handle with #3 Transportation at +4.8% and #2 Education at +9.1%.
In the end, we see a wide range of sequential growth and contraction from Feb 2023 to March 2023, but the YoY numbers vs. March 2022 on a SAAR basis show a lot of strength considering how ugly the interest rate environment was as a backdrop. A wide range of projects need to get planned in advance, so the fallout from interest rates come at a lag. As a result, the monthly construction numbers just moved up on our priority list.
We will see no shortage of commercial real estate headlines ahead on troubled real estate assets with too much debt and perhaps declining rents. Those financial asset issues (loans, CMBS, etc.) will spill into the economics of new project planning by category (especially Office). The spending aspects on how that flows into the multiplier effects across the regional and national economies need more attention in coming months. On a silver lining note for offices, turning those assets into apartment buildings entails construction spending even if that would be on the other side of financial asset pain.


