
Footnotes & Flashbacks: Credit Markets 9-23-24
A week of equity rallies and credit spread compression followed the FOMC cut, but duration is starting out on its back foot on the way to 4Q24.


Is that an election ahead?
The FOMC cut got a delayed risk rally in equities and some notable tightening in credit spreads, but the duration wildcard still has many doing their deficit math and pondering what can go wrong.
We get a fresh revision this week with the final 2Q24 GDP estimate and another round of PCE price data along with the related income and consumption data as the market restarts its speculative engines on whether we see another 50 or 75 bps cut by year end and some fresh UST curve reshaping.
Whether it is the GOP elephant in the room challenging the basic facts and economic logic of tariffs or the second kick of the Dem’s donkey braying about income and capital gains tax increases, there will be much to sort out in the election. The policy gaps are daunting.
For now, the market can adjust the blinders and stay focused on the -50 bps cuts and a base case of steady, positive earnings growth and a soft landing scenario holding until actual policy actions force a change of assumptions or elicit some aggressive repositioning of portfolios.

The latest round of numbers for IG and HY credit market returns and those rolling up from the credit tiers are staying the course. We are coming off after a weekly set of asset returns that shows bond funds weaker but risky assets stronger with a compression wave from the bottom up this past week as tighter spreads prevailed (see Mini Market Lookback: FOMC Week 9-21-24).
The UST curve was unfriendly to bond ETF returns for the week (see Footnotes & Flashbacks: Asset Returns 9-22-24). Lower on the front end and higher on the long end prevailed. The discussion around how such a low UST curve in the context of pre-crisis, non-ZIRP context can see longer rates go much lower with soaring deficits to fund will remain a challenge near term unless more signals of weakness surface.
The logical UST yield curve shape and what a “normal” upward slope looks like raises plenty of doubts of how low the 10Y UST can go even if fed funds ends up with a 2% handle (see Footnotes & Flashbacks: State of Yields 9-22-24).

The above chart updates the running YTD excess returns for IG vs. HY, and the patterns are both favorable and rational given the steady fundamentals in the markets. The favorable relative performance of the credit tiers from the bottom up show a vote of confidence in the credit cycle with the low end of HY a very strong performer recently as we detail in the CCC tier returns further below.
Compressed spreads for HY are in line with prior cyclical peaks of the post-crisis years even if not at the bubble levels of early June 2007 and Oct 1997. For IG, the current index spreads have even more past history supporting such spread levels for protracted periods.
We got a taste of how the numbers can turn in early August, but it will take some sustained fundamental weakness in industries or material setbacks in equity valuations with the correlation spillover to make it stick. In HY the potential for more refinancing/extension is supportive of dollar prices as is the UST curve.
The same is true for a wide range of steady industry fundamentals and a relatively lower mix of the “late cycle crazy deal flow” seen in prior cycles. The LBO excess and negative cash flow sectors borrowing to grow has not been a factor in the HY bond market with a bigger migration of the most leveraged transactions over to the private credit space.

The BBB vs. BB tier running excess returns are back to looking relatively compressed to the point of questionable value being delivered across the speculative grade divide. The +236 bps excess return for BBs compared to +204 bps for BBBs is not much of a lead even if both constitute good news coming off a tightening cycle with some major industry groups such as energy posting uninspiring numbers over in equities.
The strong bid for BB tier credits by aggressive IG investors and more defensive HY positioning remains favorable for the largest HY tier seen in BBs. BBB as the largest IG tier also offers more aggressive IG investors a way to take more credit risk while using the BBB tier as a natural source of duration with its 6.74 duration (vs. 4.76 for IG overall) for those looking to rates more than spreads in such an environment.

The outperformance of the CCC tier just took another leap away from the B tier with the recent rally and shifting mix of issuers in the CCC tier. The CCC YTD excess return is over 10 points YTD (1,016 bps) vs. the B tier at +268 bps. There is no question that historically the CCC tier has exponentially higher long term average annual default rates vs. the B tier, but the tier is seeing some exceptional spread compression of late with -111 bps over the past month.
CCCs always get back to constituent distortion and exits and entries and various other structural factors (bonds exchanges, CCC tier drop-outs, where/when losses get crystallized, mix shifts generally) so it is never perfectly clear on a trend basis.
A look at spreads…

IG spreads tightened -6 bps on the week to +93 bps. The above chart updates IG spreads across the cycles, and current spreads are near some of the low points of the post-crisis years but also very much in line with pre-crisis IG OAS levels seen for protracted periods. IG cruised through this year despite some volatility during the bout of early August, but the real tests could come in 2025.
We see IG spreads now in line with prior credit cycle peak periods even if modestly above some of the low ticks noted in the chart. As we look back across credit cycle peaks, the +70 bps for the IG index at the end of 1997 was lower than today after the market saw the record low in Oct 1997 at +53 bps.
The 1997-1998 average for IG OAS was +95 bps, and there was plenty of trouble in later 1998 which led to Fed easing in the fall. IG spreads as we wind down 2024 are closer to the lows of the late 1990s period than the long-term median of +132 bps noted in the median box above.
Looking at the credit bubble peak of 2007 as a frame of reference, IG OAS was at +100 bps at 6-30-07 ahead of a turbulent summer and fall that infected the largest sector in IG (banks and financial).
We are basically inside that late June 2007 level as we head toward 4Q24. IG spreads had widened by mid-2007 after the period from 1H04 through 1H07 saw IG OAS averages in double digits at around +93 bps. The spread lows in 1H07 of +86 bps were like the lows in 2H06 at +90 bps and 1H06 at +87 bps. In other words, current spreads have a lot of periods in common that ran for many months.

The week saw HY tighten by -22 bps to +315 bps from +337 bps. That is just inside the +316 cyclical lows of early Oct 2018 but wide to the Dec 2021 lows of +301 bps.
For some OAS level comps, HY OAS ended 1997 at +296 bps after HY OAS was inside +250 bps in Oct 1997 (+244 10-17-97). The 1997 period saw average spreads of +282 bps in 1H97, +270 bps in 2H97, and +298 bps in 1H98 before the summer chaos of Russia and LTCM (and brief Lehman funding and counterparty exposure scare) rolled in from August into the fall.
Spreads are tight now but have been tighter in markets with materially lower HY index quality mix (ratings tiers, leverage excess, record LBOs, bank system challenges, industry stress points, etc.). For some other frothy comps, the HY index OAS moved out to +298 bps on 6-30-07 after being as tight as +241 on 6-1-07. We thus are in the zone of mid-2007 even if well above the bottom tick.
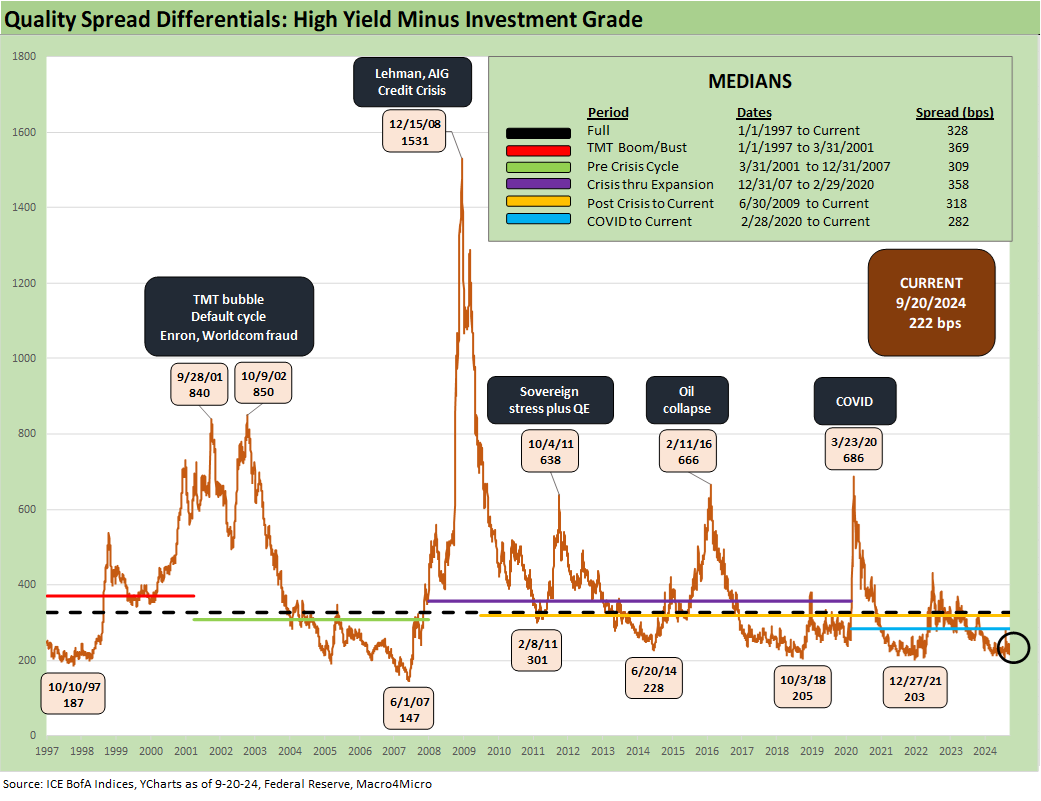
The “HY OAS minus IG OAS“ differential at +222 bps shows levels of relative credit compensation well inside the long-term median and more in line with those seen in June 2014 and modestly above those of Oct 2018 and Dec 2021. That still qualifies as tight.

The BB tier OAS of +191 bps is well inside the long-term median of +301 bps and has dipped below the lows of early 2022, Oct 2018, and June 2014. Current BB OAS is just above the multidecade lows of Jan 2020 ahead of COVID.
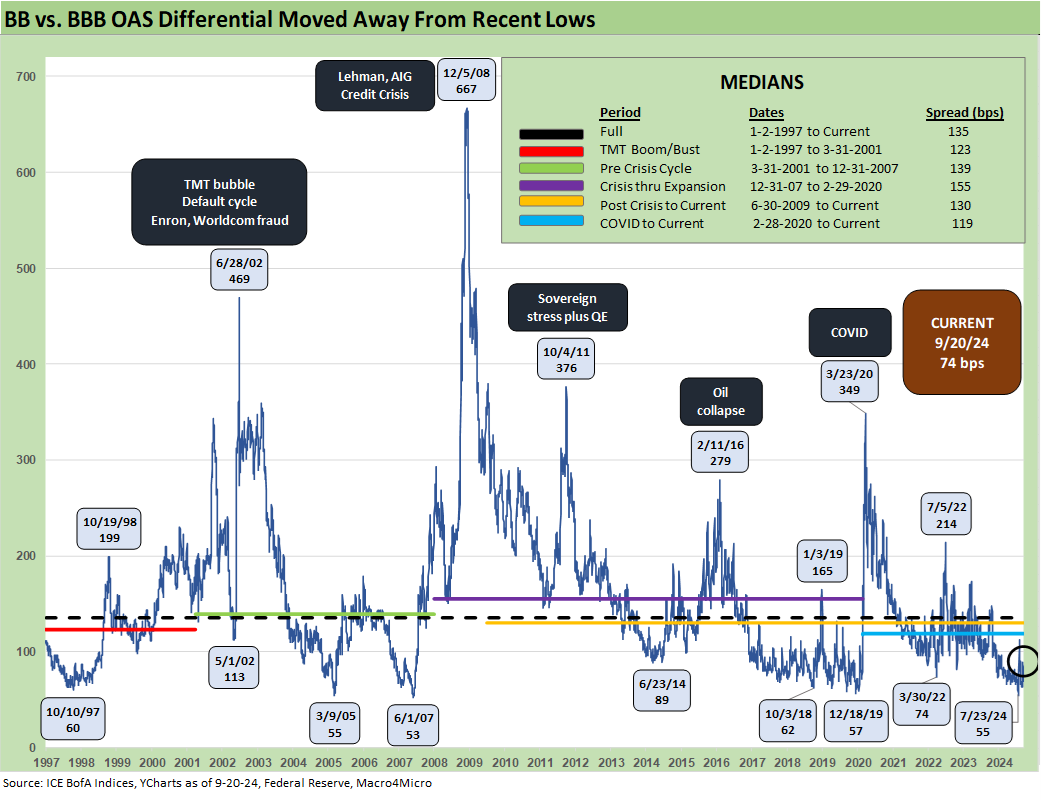
The “BB OAS minus BBB OAS” is back down to +74 bps which is well inside the long-term median of +135 bps but comfortably above the post-2007 low of +55 bps seen in July 2024 that was close to the +57 bps of Dec 2019 in a par-plus HY bond market with many bonds trading above call prices.

The B tier saw OAS tighten by -21 bps on the week to +307 bps, which is dwarfed by the long-term median of +469 bps. We frame the low B tier OAS points along the timeline above, and we are still a few good months wide to early June 2007 HY bubble levels of +236 bps.
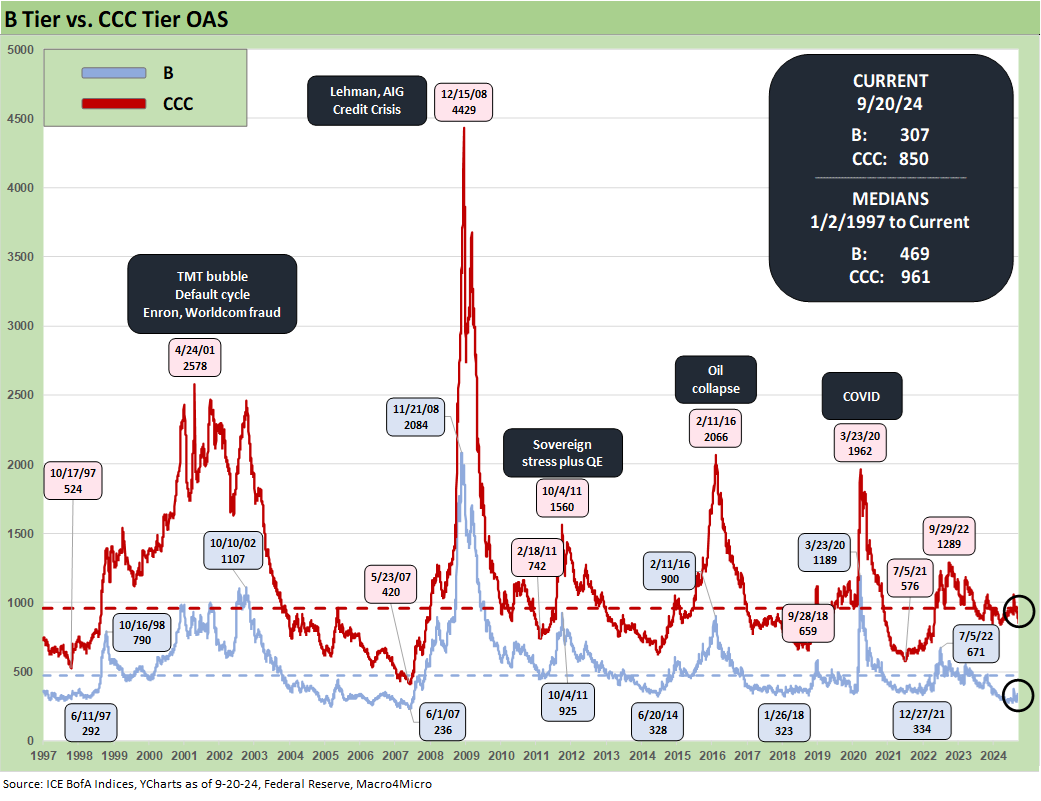
The above chart updates the running B tier OAS vs. CCC tier OAS as a reminder of what the CCC tier disconnects look like. Each CCC tier dollar price plunge had their own set of issuer and industry war stories as fixed income credit risk morphed into a high risk equity-like price action (see The B vs. CCC Battle: Tough Neighborhood, Rough Players 7-7-24).
A look at yields…
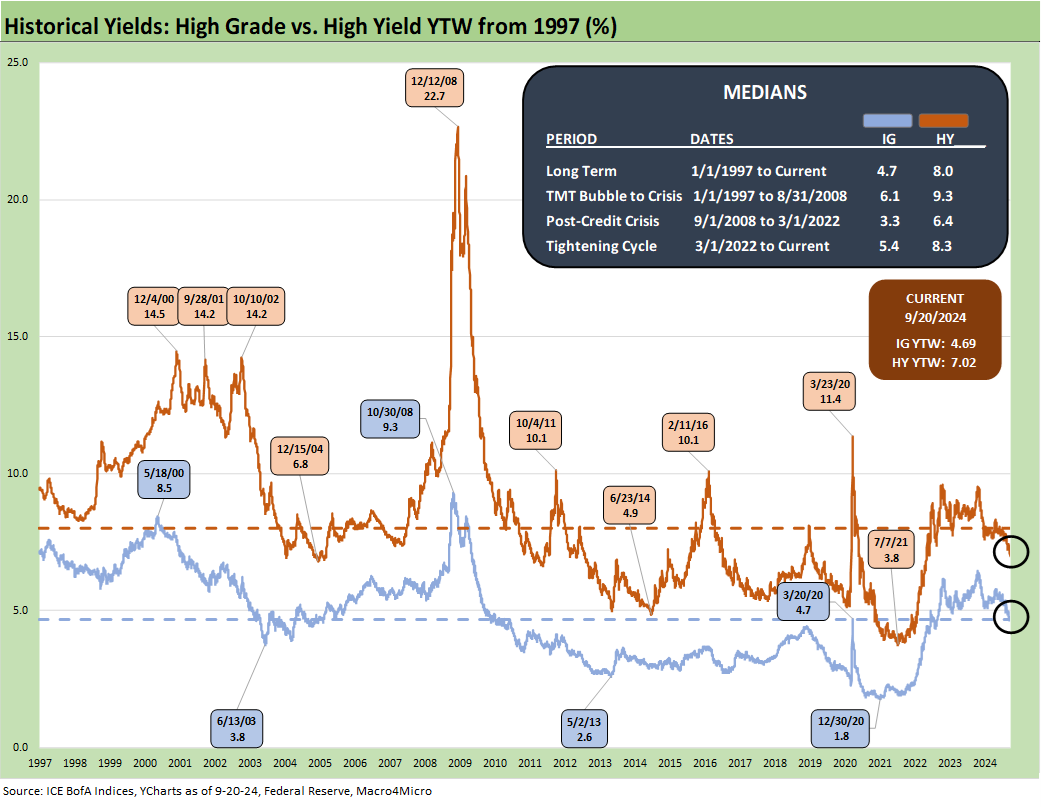
The above chart updates the running IG and HY index yields across time. We reiterate that the pre-crisis cycles offer the most relevant comparison in the absence of ZIRP and brief normalization periods through the COVID return to ZIRP. That means 6.1% for IG and 9.3% for HY is the most relevant comparison for the combined effects of credit spreads and UST levels.
With IG now back to 4% handles at 4.69% and HY on top of the 7% threshold at 7.02%, the corporate and HY markets have lost some luster. Despite that, many names would present attractive coupon opportunities in refi-and-extension financings with the right issuers. Many holdings in various names carry a mix of coupons as low as 2% in BB tier with some CCCs even printed at 5%. Cash flow and coupon income will remain an attraction for many and notably in retirement portfolios.

The above chart updates the IG index yields on the horizontal lines with some historical comparisons to credit cycle peaks of late 1997 and mid-2007. We also include the UST curves from the same dates.
There is no question that the current UST curve shape is especially strange in the context of prior credit cycle peaks. The steep inversion and very low absolute rates out the curve have to make the FOMC think twice even if some can make a case for holding the line based on their stated conceptual framework.
We look at historical UST slopes each week in our Footnotes publication on yields (see Footnotes & Flashbacks: State of Yields 9-22-24). The median slopes added to a theoretical fed funds and derived 3M UST make a sharply lower 10Y UST a “tough sell” without a recession scenario. The 3M to 10Y long term median is at a +160 bps slope. For 3M to 5Y UST, the median is +110 bps. That is tough math with the 10Y UST around 3.7% and 5Y UST at 3.5%.
For IG corporates, the challenge is seeing longer UST rates come down materially without a recession. Then you need to ponder the move off historically low spreads in an economic contraction scenario. The inversion can get whittled down with fed fund moves, but that will be a challenge for long UST with record deficits and two candidates promising some very expensive items on their policy menu that reduce revenue or raise budget outlays (or both).

The above chart does the same exercise at the same dates for HY that we ran through in the prior chart on IG. The HY index yields are close to the 2007 numbers than IG yields, but HY is knocking on the door of 6% handle yields soon.
See also:
Footnotes & Flashbacks: State of Yields 9-22-24
Footnotes & Flashbacks: Asset Returns 9-22-24
Mini Market Lookback: FOMC Week 9-21-24
Existing Homes Sales Aug 2024: Mortgages Still Rule 9-19-24
Home Starts Aug 2024: Mortgage Rates to Kickstart Hopes Ahead? 9-18-24
FOMC Action: Preemptive Strike for Payroll? 9-18-24
Retail Sales: Down to the Wire? 9-17-24
Industrial Production: Aug 2024 Capacity Utilization 9-17-24
Footnotes & Flashbacks: Credit Markets 9-16-24
Footnotes & Flashbacks: State of Yields 9-15-24
Footnotes & Flashbacks: Asset Returns 9-15-24
A Strange Policy Risk Week: Mini Market Lookback 9-14-24
Consumer Sentiment: Inflation Optimism? Split Moods 9-13-24
CPI Aug 2024: Steady Trend Supports Mandate Shift 9-11-24
Facts Matter: China Syndrome on Trade 9-10-24
Tariffs: Questions that Won’t Get Asked by Debate Moderators 9-10-24
August 2024 Payrolls: Slow Burn, Negative Revisions 9-6-24
Construction Spending: A Brief Pause? 9-3-24