
August 2024 Payrolls: Slow Burn, Negative Revisions
August numbers continue the weakening theme with -25 bps or -50 bps still an FOMC jump ball, but employment is not flagging contraction risk.


The question is whether the fuse is attached to a pile of tariffs.
The scorecard shows U-3 ticking lower to 4.2% from 4.3%, U-6 to 7.9% from 7.8%, YoY hourly earnings at +3.8%, the July 2024 numbers revised down from +114K to +89K, and June from +179K to +118K, so the trend is clear enough even if the FOMC game plan is not in terms of magnitude and timing.
The consumer quandary always flags credit cards and strains in affordability at the household level, but these jobs numbers are still materially positive in longer timeline context for those who are used to seeing a lot more “red” in the numbers across cyclical turning points.
The immediate UST curve reaction was a modest bull steepening move from 2Y to 10Y with slowly gathering evidence of some adverse trends in the usual signals economists like to watch such as gross private domestic investment (see 2Q24 GDP 2nd Estimate: The Power of 3 and Cutting 8-29-24).
PCE has regularly shown its resilience, so we still view the election outcome and related reaction to policy fears (from either side) as one of the bigger near-term threats with a geopolitical anxiety kicker in the catalyst collection.

The above chart updates the monthly payroll deltas back to March 2022 when ZIRP ended. The box in the upper right shows the median since Jan 2009 to be 210K. We are now running more consistently below that post-crisis median. We see 3 of the last 5 months below the Aug 2024 print, so many are taking the natural leap that payroll contraction is knocking on the door.
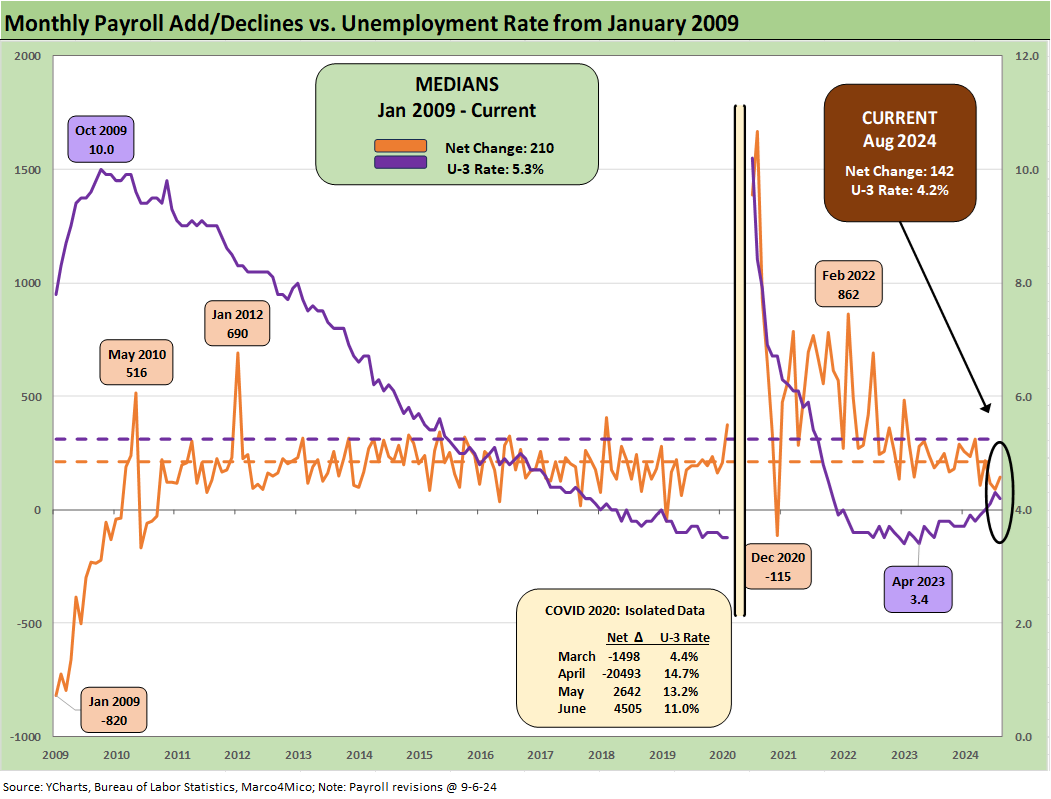
The above chart plots the monthly job adds vs. the unemployment rates since Jan 2009. We include the outsized COVID peak numbers in the box to help the quality of visuals in the chart. The 4.2% unemployment rate for August is down from 4.3% in July and comes on the back of -48K in the total unemployed against a 120K increase in the civilian labor force in the Household Survey.

The above chart plots the standard unemployment rate (U-3) vs. the underemployment rate, the U-6. The chart details the low and high points since 1994.
As a reminder, the U-6 metric is defined with the numerator as “total unemployed + persons marginally attached to the labor force + total employed part time for economic reasons.” The denominator is “civilian labor force + workers marginally attached to the labor force.”
The U-6 rose slightly this month from 7.8% to 7.9% (SAAR) and is up notably from 7.1% (SAAR) in Aug 2023 a year ago. In longer term context, the median for the U-6 since Jan 1994 is 9.4% while the U-3 median is 5.2%. From that vantage point, employment indicators are healthy enough, but there has still been meaningful deterioration from the low U-3 and U-6 levels of this recent cycle.

The above chart plots the “U-6 minus U-3” differential since 1994 with the current differential of 3.7% below the long-term median of 4.0%. We could look at this differential as a proxy for the range of employment challenges across a national economy. The idea of regional dislocations was a common feature in the 1980s and 1990s but less the case in post-crisis markets. The oil crash was a brief exception.
We see a Hi-Lo range that includes 2.9% on the low side and 7% handles in the post-crisis period. The timeline shows the recession levels of March 2009 (stock market lows) at 7.2% and the volatility of Sept 2011 at 7.4%. The COVID peak came in at 8.2%.
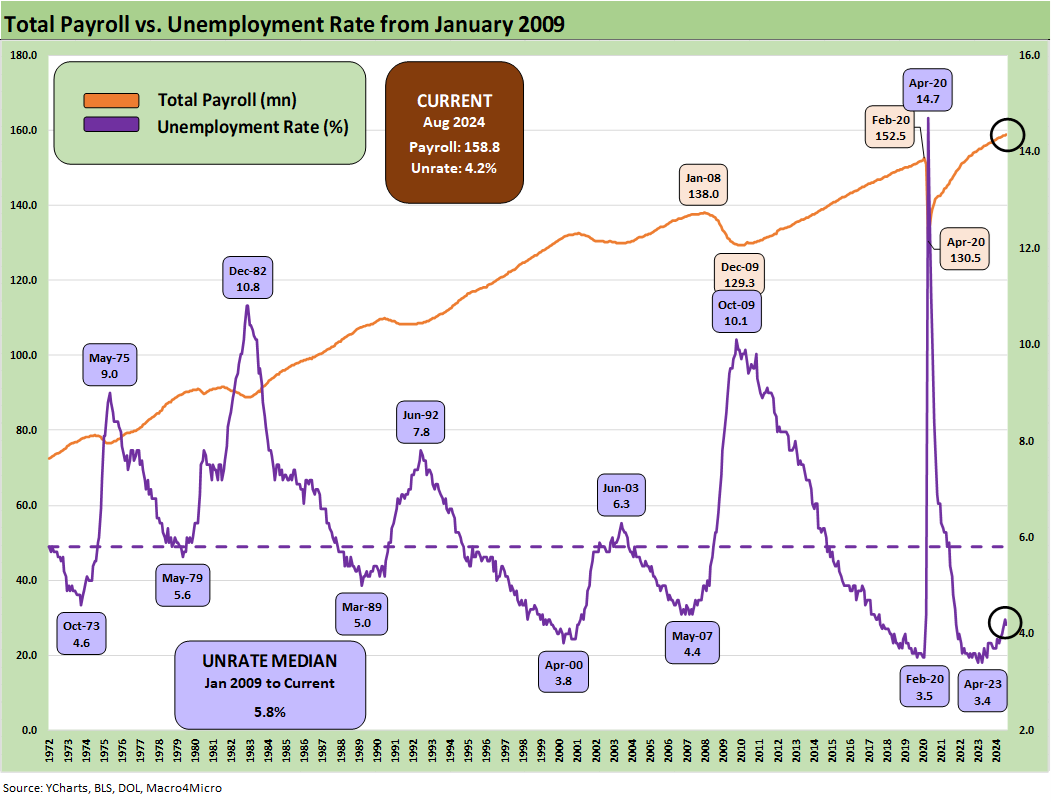
The above chart updates the “bodies on payroll” vs. the unemployment rate trends. “Bodies with paychecks” is still an important metric under the “Mo Paychecks, Mo Money, Mo Spending” rule. That always needs to be run through the strainer of structural underemployment, the need for multiple jobs, and wage trends. The ability to get a job of any sort was not always easy to assume in the 1970’s stagflation bouts and early 1980s double dip.

The above chart updates total payroll vs. job openings (see JOLTS July 2024: Mixed Bag, Hires Up, Layoffs/Discharges Up, Quits Flat 9-4-24). The JOLTS report show job openings well off the peak but still above the peak job openings level before COVID in Nov 2018 at 7.5 million.

The above chart offers the multicycle view from 1972 that offers a reality check on what a bad unemployment rate looks like across the decades from the bad old days. We see a median of 5.8% set against a +3.2% long-term CPI median. The current unemployment rate of 4.2% and CPI of 2.9% is not looking all that bad by those standards (see CPI July 2024: The Fall Campaign Begins 8-14-24).
Drilling into the occupational line items…
The monthly “payroll dance” usually starts with scanning the deltas across the occupations, so we detail the changes in the charts below while looking at MoM, YTD, LTM and post-Jan-2020 (for a view of the headcount change from just before COVID).

The above chart lays out the top-down trends with the headline numbers and a higher level view of the private sector deltas. We detail Government buckets in the last chart in the collection.
The +142K delta MoM was below expectations and based on recent history will get revised down again next month. The nuances of sequential trends are still not flagging net job losses (as in negative).
The YTD payroll adds of 1.2 million total payroll in the private sector is a very solid number, and we also see +263K in the Government ranks for a total of almost 1.5 million jobs added. With the 5.25% to 5.5% fed funds rates and steep inversion from 3M UST, that sustained job growth will be a discussion in economics classrooms in future decades.
The LTM payroll adds of 2.36 million and post-Jan 2020 of 6.7 million frames a rather productive job market that is so often depicted (along partisan lines) as a hellscape even as so many states have experienced booming job growth and sharply rising state GDP levels (see State Unemployment: A Sum-of-the-Parts BS Detector 6-30-24, Employment: Real Numbers vs. Fictitious Dystopian Hellscapes 3-10-24).
When Trump says (as he did at the Economic Club of New York yesterday) that essentially all hiring is undocumented workers with a heavy dose of escapees or those released from asylums and prisons in countries “no one has heard of” (geography lessons anyone?), we try to picture a hiring wave in so many red states that report their employment numbers each month. His cynical assumption is that no one (or at least MAGA diehards) pay attention to the monthly deltas for each state.
We keep trying to picture an insane asylum escapee from Cameroon looking for work in Alabama, Wyoming, South Dakota, etc. (Good luck with your job search). We link to the Trump speech in a comment posted yesterday (see Trump's New Sovereign Wealth Fund: Tariff Dollars for a Funded Pool of Patronage? 9-5-24). His speech on economics is worth a listen for “perspective.”

The above chart breaks out the MoM deltas by occupation. The usual labor-intensive service operations in Leisure & Hospitality and Health Care/Social Assistance lead the pack. The Construction business put up another good month given the high levels of activity in that sector with its myriad projects across numerous subsectors (see Construction Spending: A Brief Pause? 9-3-24).
Even if housing starts are lagging, the legislative support for industrial/manufacturing activity and public sector infrastructure has driven a high rate of construction hiring that continues into 2024. We look at construction subsector payrolls in more detail further below.
On the negative side, manufacturing of durable goods is in the red with nondurables slightly positive. Given the multiplier effects of durables, that is another negative signal for the cycle. Manufacturing is still in a secular stall since pre-COVID but had previously been on the mend in flipping the COVID job losses back into the positive range since Jan 2020. That manufacturing weakness is still deep in a hole since 2000 after the Clinton years (see Goods and Manufacturing: Fact Checking Job Rhetoric 9-5-24).
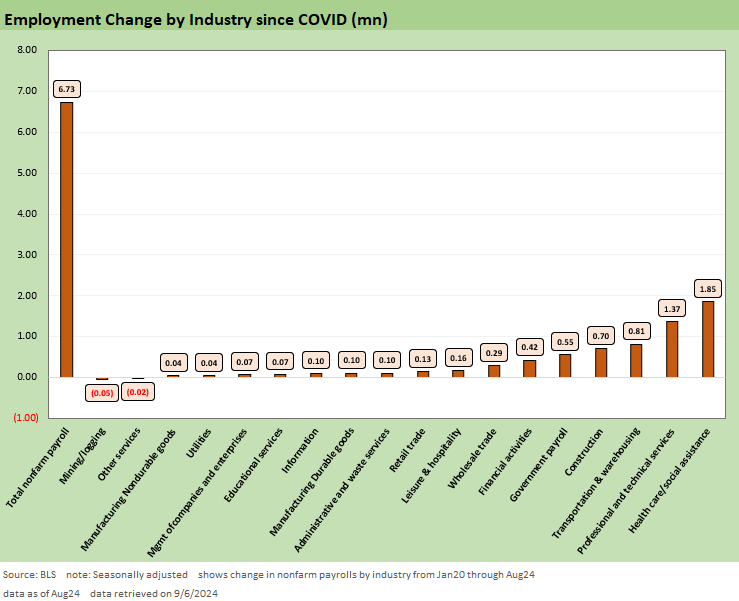
The above chart updates the running occupation deltas since Jan 2020. The demographic tailwinds supporting Health Care/Social Assistance are the usual themes, but that sector lacks the multiplier effects of Manufacturing, which remains in the doldrums but are at least positive.
The worst round of pain for manufacturing was in the decade from 2000 to 2009. The chances of refilling that hole remain long odds, and tariffs alone will not do the trick. Tariffs in fact could make matters worse for many employers when considering the layers of side effects.

The above chart updates where the US as a services economy stands in payroll. We see +5.4 million jobs added in Services since Jan 2020, 1.66 million LTM, and 1.09 million YTD. For the YTD numbers, the additions are dominated by Health Care/Social Assistance and Leisure/Hospitality that tend to be characterized by lower wage payrolls.
Among the positive triple digit lines YTD, we see the very diverse bucket of Professional and Technical services and Transportation and Warehousing. For the YTD period, only 3 lines are in the red with only one (Information) in low double digits.

The above table summarizes overall manufacturing payrolls and then breaks out Durables deltas. The news is not pretty with negatives in Durables in total YTD at -43K. We see 7 of the 12 lines negative, 4 positive and 1 rounding to zero. The dismal ISM numbers and recurring themes around the offshoring history do not need to be revisited.
With an election year coming to a head, we are hearing a lot of promises from both sides. The decision revolves around whose policies will simply be benignly ineffective for Manufacturing (Harris) and which will he high-energy, loud, and net damaging (Trump). Trump’s main goal is to apply severe penalties on supplier chains built over decades. That might work potentially and eventually, but only on the other side of a deep recession and widespread restructuring of industries and massive investment in reconstructed supplier chains. We doubt anyone wants to revisit 1980-82. There has been no clarity that the magnitude of the demands are even understood by Trump.
The manufacturing sector decisions on reshoring face a very challenging situation in revising strategies in a polarized nation with a 50-50 hate-fest going on. They face dramatically different solutions on the table from the warring political parties, and that means the plan could often end up being to “just hold the line and be defensive” given the intrinsic uncertainties of elections and midterms only two years away.
The lack of dexterity in Congress with so many hardliners and partisan-only votes makes it difficult to find the common ground that made the Reagan and Clinton years so successful and the economy light years ahead of what Trump and Biden delivered (see Presidential GDP Dance Off: Clinton vs. Trump 7-27-24, Presidential GDP Dance Off: Reagan vs. Trump 7-27-24).
The economic IQs in Congress are not exactly the envy of the world. You know what they will say before they say it, and often facts are not included (and factual misstatements embraced).
Meanwhile, the Durables sector struggles. A tariff binge will only make that worse as manufacturers will need to find a way to rationalize costs to offset the unit cost damage from supplier chain tariffs. Raising prices is easier when the cycle is strong. Tariffs combined with contraction in demand would be a disaster for many. 100% expensing of depreciation and bonus depreciation, etc., as pitched at the economic club by Trump yesterday was already tried in his 2017 action, but that net benefit was undone by the tariffs wave (see HY Pain: A 2018 Lookback to Ponder 8-3-24).

Nondurables across the cycles has been the Death Valley of secular erosion with some exceptions such as Food Manufacturing and Chemicals. The US had some natural demographic positives and tailwinds from ag sector strengths for food-related industries and competitive advantages in chemicals (e.g., low-cost natural gas feedstocks).

The above chart updates the consistently good news in construction jobs. The YTD increase of +160K, +228K LTM, and +700K since Jan 2020 tells the story. These are very strong numbers with some subsectors such as residential facing favorable demographics in terms of supply shortages. The public sector is more dependent on legislation (functional political bodies), the tax base, and the health of regional economies.
Construction will necessarily level off, but the longer term projects continue subject to the next round of policy shifts (see Construction Spending: A Brief Pause? 9-3-24). For residential and the slowdown on that front (see Housing Starts July 2024: The Working Capital “Prevent Defense” 8-16-24), the direction of mortgage rates and housing policy (see Harris Housing Plan: The South’s Gonna Do It Again!? 8-28-24) will make for some drama in the next few months.

The Government payrolls have grown impressively YTD at +263K and LTM at +486K . The LTM is a majority of the +552K since Jan 2020. Notably, State and Local hiring has been the main driver at +428K LTM vs. only 406K since Jan 2020.
As we noted earlier in the commentary, the “two sets of books” run by state and local politicians that the national economy is a disaster while their local economies are very strong and adding to payroll calls out a relative lack of “sincerity” that is exposed by their tax base and budgets. Just googling around some red state Governors and local leaders bragging about their state and local economies is amusing – sort of (see State Unemployment: A Sum-of-the-Parts BS Detector 6-30-24, Employment: Real Numbers vs. Fictitious Dystopian Hellscapes 3-10-24).
Contributors:
Glenn Reynolds, CFA, glenn@macro4micro.com
Kevin Chun, CFA, kevin@macro4micro.com
See also:
Trump's New Sovereign Wealth Fund: Tariff Dollars for a Funded Pool of Patronage? 9-5-24
Goods and Manufacturing: Fact Checking Job Rhetoric 9-5-24
JOLTS July 2024: Mixed Bag, Hires Up, Layoffs/Discharges Up, Quits Flat 9-4-24
Construction Spending: A Brief Pause? 9-3-24
PCE July 2024: Inflation, Income and Outlays 8-30-24
2Q24 GDP 2nd Estimate: The Power of 3 and Cutting 8-29-24
Harris Housing Plan: The South’s Gonna Do It Again!? 8-28-24
Payroll: A Little Context Music 8-22-24
All the President’s Stocks 8-21-24
CPI July 2024: The Fall Campaign Begins 8-14-24
Total Return Quilt: Annual Lookback to 2008 8-14-24
HY Industry Mix: Damage Report 8-7-24
Volatility and the VIX Vapors: A Lookback from 1997 8-6-24
HY Pain: A 2018 Lookback to Ponder 8-3-24
Payroll July 2024: Ready, Set, Don’t Panic 8-2-24
JOLTS June 2024: Countdown to FOMC, Ticking Clock to Mass Deportation? 7-30-24)
Presidential GDP Dance Off: Clinton vs. Trump 7-27-24
Presidential GDP Dance Off: Reagan vs. Trump 7-27-24
2Q24 GDP: Into the Investment Weeds 7-25-24
GDP 2Q24: Banking a Strong Quarter for Election Season 7-25-24