
Footnotes & Flashbacks: State of Yields 9-22-24
The FOMC debates starts anew on UST action and shapeshifting with the 3M UST moving lower and the 10Y UST staying stubborn.


Curves: 1 part art, 1 part speculation, and 1 part confusion…
We update the UST curve shifts and reshaping after this past week saw a -50 bps easing and an uptick in the longer end as bond ETFs underperformed.
We update the 3M to 10Y UST segment slope as many in the market face a fresh test on where and when to deploy cash out the curve, into credit, and/or shift allocation to equities.
The dominant questions will be “When?” and “How much?” from here in 4Q24 by the FOMC after the dot plot signals with some handicapping whether the longer end will shift and in turn flow into mortgage rates and impact refinancing costs for corporate issuers.
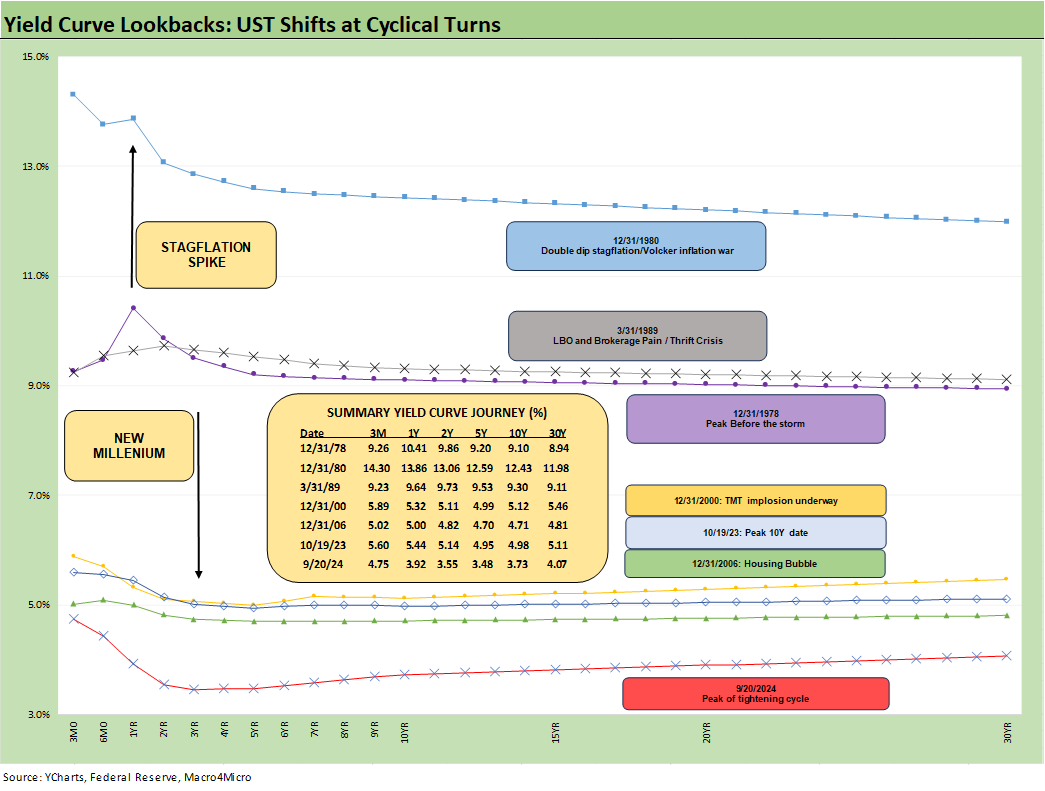
The above chart updates the UST curve from the “non-ZIRP years” before the credit crisis from the 1978 Carter inversion on across the credit cycles, the economic transition periods, and shifting monetary policies. The last curve plotted before the crisis is the credit cycle peak calendar year of 2006 as a rendezvous with mortgage pain in late 2007 (recession start Dec 2007 per NBER) came ahead of the crisis in 2008 and ensuing ZIRP stretch and bouts of normalization before COVID.
The easy and obvious takeaway is that today’s UST curve is extremely low by any historical standard with the exception of the ZIRP/QE and minimal normalization periods until the end of ZIRP and into the inflation battle of 2022. We also include the peak UST curve from Oct 2019 when the 10Y peaked (10-19-23). The curve is now very low and remains materially inverted on the front end.
Even with the recent drop in fed funds and 3M UST, the inversion remains glaring on the front end. As we detailed after the cut this week, there is still a healthy cushion of fed funds in excess of PCE for additional easing as the year continues. That will be subject to the data with real fed funds levels (net of PCE) above long term medians (see FOMC Action: Preemptive Strike for Payroll? 9-18-24). In addition to PCE inflation this week brings the final estimate on 2Q24 GDP.

The above chart updates the running UST deltas from the peak 10Y UST date of 10-19-23 and also the YTD deltas as those eventually turned around and all are mostly now going in the same direction (as in lower) with the 30Y UST slightly higher. As we cover further below, we have the UST curve upward sloping from 2Y UST, but the 3M to 5Y and 3M to 10Y UST are materially inverted and are still offering some “ponder time” for those heavy in cash and trying to sort out election policy risk.

The above chart updates the UST migrations across the tightening cycle and end of ZIRP in 1Q22. We include a memory box on the tightening process with the dates and magnitudes. The move into a bull steepening just faced a fresh stall in the 10Y area, but there are a lot of cyclical variables and monetary decisions yet to play out.
We always highlight the convergence of the 10Y UST area between the 12-31-22 and 12-31-23 UST curves even with a 100 bps differential in fed funds. That history will get a fresh test now with -50 bps of easing and the 10Y UST for this week staying stubborn around 3.7%, which at least is below where the market was at the end of 2023 and 2022. The 10Y UST moving below 3% is a very big ask outside of a deep recession.

The above chart updates the 1-week deltas along the UST curve as we discussed in the Mini Market Lookback posted earlier. The longer duration benefits will require better direction than the above for more mortgage relief, but tighter spreads could help in getting mortgages closer to mid-5% range.
A 5% handle would ignite even more demand and refinancing that would free up liquidity for existing homeowners currently restrained by the low mortgage rates on their homes. We cover that topic routinely in our existing home sales pieces. The 60% of mortgage with 4% or less will not make it easy to free up more inventory at lower prices. Lower mortgages will at least bring higher transaction volumes (see Existing Homes Sales Aug 2024: Mortgages Still Rule 9-19-24).

The above chart offers another visual on the YTD deltas across the UST curve. The bull steepener will need more help on the longer end to keep momentum, but the expectation of more easing will reward shorter duration bonds and help funding costs tied to shorter duration liabilities such as auto loans. Such effects come at a lag. Lower short to intermediate rates allow for lower cost use of financing incentives, which in substance are marketing costs incurred by the OEMs offered through their finance units.

The above chart updates the running UST deltas from the date of the 10Y UST peak (10-19-23). The downshift has been impressive and comes against a backdrop of the most recent period of 2Q24 posting +3.0% GDP growth (through the second revision, final revision is this week) and payrolls that are still rising despite the unemployment rate ticking higher (see August 2024 Payrolls: Slow Burn, Negative Revisions 9-6-24).

The above chart updates the Freddie Mac 30Y mortgage benchmark on the horizontal line and compares current levels to two critical periods during the housing bubble years. The 12-31-05 date was the end of the peak year for homebuilding and the mid-2006 period marked the timeline when RMBS quality was coming under scrutiny and raising concerns around asset quality and housing bubble risks.
We also plot the UST curves for each period as frames of reference. The relationship of the 30Y benchmark differential relative to the gaps in the 2005 vs. current yield curve offers some hope on the ability of the current 30Y mortgage to move lower, but that is not assured.

The above chart updates the long-term 3M to 10Y UST curve, and the inversion is now down to -102 bps from the peak of -189 bps on May and June 2023 but a very long way from the +160 bps long term median.
We note the UST segments in the box that we typically track, and the 2Y to 10Y and 2Y to 30Y are both now upward sloping. The inversion from 3M UST has a long way to go to encourage more extension out the curve.

The above chart shortens up the timeline to the beginning of 2021 for a more granular view of the wild ride since the end of ZIRP. We see the peak steepness of +227 bps in May 2022 down to the peak inversion of -189 bps in May and June of 2023 just ahead of the final hike in July 2023.
The peak 10Y of 10-19-23 brough the inversion down to -62 bps before the Nov-Dec 2023 UST rally. Then came the adverse UST duration shifts in early 2024 as the UST gyrated on the way to the bull steepening in later 2024 ahead of this past week’s fed funds cut.

We wrap with the UST deltas since the start of March 2022, the month that ZIRP ended and the tightening cycle began. The UST deltas in the box quantify the running moves of the UST migration across those years from upward sloping to a bear flattener and then into a bear inversion.
The current upward sloping UST curve from the 2Y UST has a long way to go before getting back closer to the upward sloping medians. The easing in fed funds is just a start in the direction of flattening on the short end.
As we cover above, the inversion from 3M is radically different from that seen across the historical timelines. The 3M UST around 4.7% is a long walk from a 2Y UST at 3.6%, assuming the UST curve goes to flatter against a 10Y UST.
See also:
Mini Market Lookback: FOMC Week 9-21-24
Existing Homes Sales Aug 2024: Mortgages Still Rule 9-19-24
Home Starts Aug 2024: Mortgage Rates to Kickstart Hopes Ahead? 9-18-24
FOMC Action: Preemptive Strike for Payroll? 9-18-24
Retail Sales: Down to the Wire? 9-17-24
Industrial Production: Aug 2024 Capacity Utilization 9-17-24
Footnotes & Flashbacks: Credit Markets 9-16-24
Footnotes & Flashbacks: State of Yields 9-15-24
Footnotes & Flashbacks: Asset Returns 9-15-24
A Strange Policy Risk Week: Mini Market Lookback 9-14-24
Consumer Sentiment: Inflation Optimism? Split Moods 9-13-24
CPI Aug 2024: Steady Trend Supports Mandate Shift 9-11-24
Facts Matter: China Syndrome on Trade 9-10-24
Tariffs: Questions that Won’t Get Asked by Debate Moderators 9-10-24
August 2024 Payrolls: Slow Burn, Negative Revisions 9-6-24
Construction Spending: A Brief Pause? 9-3-24