
CPI Aug 2024: Steady Trend Supports Mandate Shift
CPI brings enough steady and favorable price news to shift the focus more toward payroll, but the Services line stays sticky.


Food away from home remains sticky.
The 2.5% headline CPI helps the political story with below long-term medians, but there is no hiding from the repriced menu and diminished affordability in areas such as food, shelter, and autos even with the minimal inflation in food at home and improved inflation for select durables such as new and used cars.
“All items less shelter” at +1.1% YoY is a feel-good price metric as is the deflation in Durables (-4.2% YoY) and deflation in “Nondurables less food” (-2.3%) to go with the 0.0% in Nondurables YoY.
The heavily weighted Services inflation battle continues with +4.8% for total Services and +5.2% for Shelter (+5.0% rent of primary residence, +5.4% Owners’ Equivalent Rent).
With PPI ahead this week and Retail Sales (another favorite) next week with Industrial Production, the FOMC will be well armed to make the call with -25 bps in the lead vs. -50 bps on expectation of a series of cuts through year end.

The above chart simply updates the run rates for headline CPI and fed funds across the decades. The long-term fed funds median of +5.1% is just below current levels and the headline CPI of +2.5% is below the long-term median of +3.1%.
The wild ride along the way is broken out along the time series. We highlight that those long-ago fed funds rates provided include some weekly averages from the Fed which miss some of those 20% days that were the highs back in the Volcker years (see Fed Funds-CPI Differentials: Reversion Time? 10-11-22).
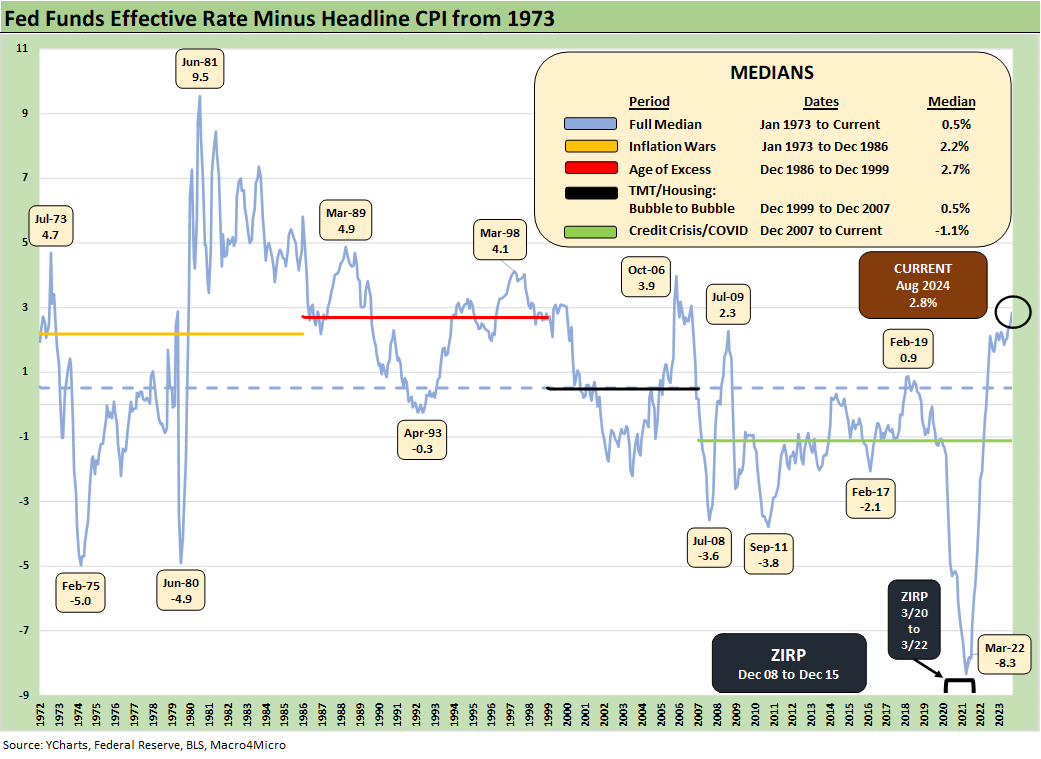
The above chart frames the differential between fed funds and headline CPI. The chart updates the level of tightening of real fed funds vs. CPI. We know that PCE is the main event for the Fed (see PCE July 2024: Inflation, Income and Outlays 8-30-24), but it never hurts to have a few more angles.
With the fed funds effective rate of 5.3% now 2.8% above headline CPI of +2.5%, the differential offers a reminder that there is ample room to ease without it being “Accommodation.” We saw that “closet accommodation” back in 2022 even as tightening was ramping up while inflation was running high. The market was facing negative real fed funds rates (i.e. was effectively still accommodation).

The above table details a selection of the special aggregate price indexes we like to watch and how they have trended since the highs of 2022. All items less shelter of +1.1% is reassuring as are the Goods lines. The various cuts of services remain stubborn by most any angle with the recurring issues of Shelter reminding us why housing is a major focus and will be a heated political topic in the home stretch to the election (see Harris Housing Plan: The South’s Gonna Do It Again!? 8-28-24).

The above chart is our “Big 5” with Food, Energy, Shelter, Automotive, and Medical inflation. These line items comprise over 75% of the CPI index. Together with the “Notables” buckets we include in the next chart, the Big 5 + those Notables comprise almost 87% of the CPI index.
We see “Food All” inflation in check at +2.1% but only +0.9% for Food at home as other costs and labor pressures are keeping Food away from home high at +4.0%. Energy has been deflating again at -4.0% with room to move lower in the current month based on recent oil price trends. Natural gas is always a seasonal wildcard around weather and the peak heating season, but the energy numbers are supportive of headline CPI.
In all the political noise and inflation finger pointing, we seldom hear the name “Putin” and the late Fed 2022 invasion effect that saw Energy inflation cross the 40% line ahead of the June CPI peak of +9.1%. Gasoline inflation moves very quickly (to just below 60% in June), but the aftereffects of raw material costs (petrochemicals) and energy bills across manufacturing and services alike all factor into a range of lag effects.
Shelter remains a very stubborn CPI line that requires more supply and lower mortgages to draw out more sellers in existing home sales and more qualified buyers as monthly payment demands ease with rates.
The challenge to Harris and her housing plan is to understand and address the supply side of the equation as well as the financial demands on households. That is a highly complex challenge, and she can’t use the simple progressive sheet music of “gouging” and evil investors (see New Home Sales July 2024: To Get by with a Little Help from My Feds? 8-25-24, Harris Housing Plan: The South’s Gonna Do It Again!? 8-28-24).
We include our own version of “Automotive” since it is such an important part of household economics (see Automotive Inflation: More than Meets the Eye10-17-22). We see deflation in vehicles, but Motor Vehicle Insurance now has the second highest weighting of the auto group CPI behind new vehicles.
Medical Care inflation is moderate, but the big political risk is more forward-looking into 2025 with the threats to cancel the Affordable Care Act. The Trump-Harris debate shed zero light on any alternative plans with Harris focused on expanding and upgrading it. Trump still has no plan despite the 7 years since McCain gave his repeal of ACA the thumbs down. Health care inflation taking off would be crushing for households and the PCE line of GDP.
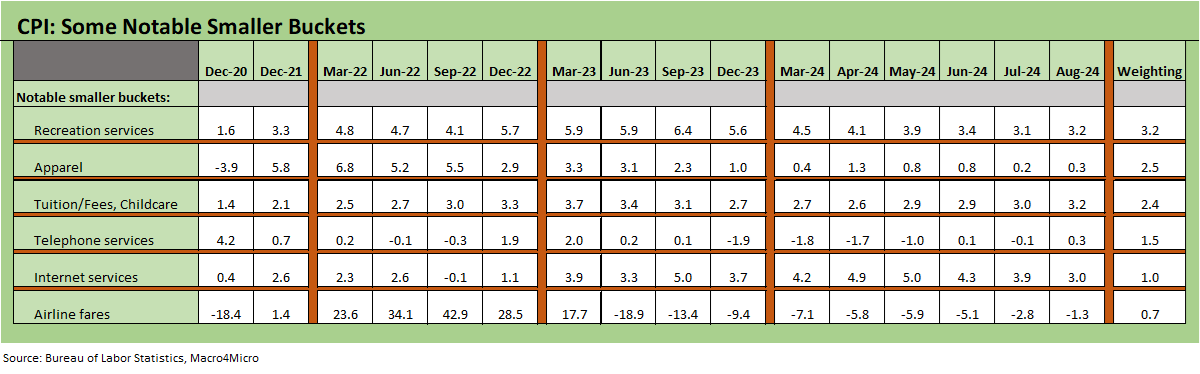
The above chart includes a collection of goods and services that are near and dear to the hearts of households. We see 5 of the 6 posting sequential moves that were YoY increases in the price indexes for each, so that is not good news for the -50 bps crowd any more than the stubborn 5% area on Services.
A quick reminder on CPI vs. PCE…
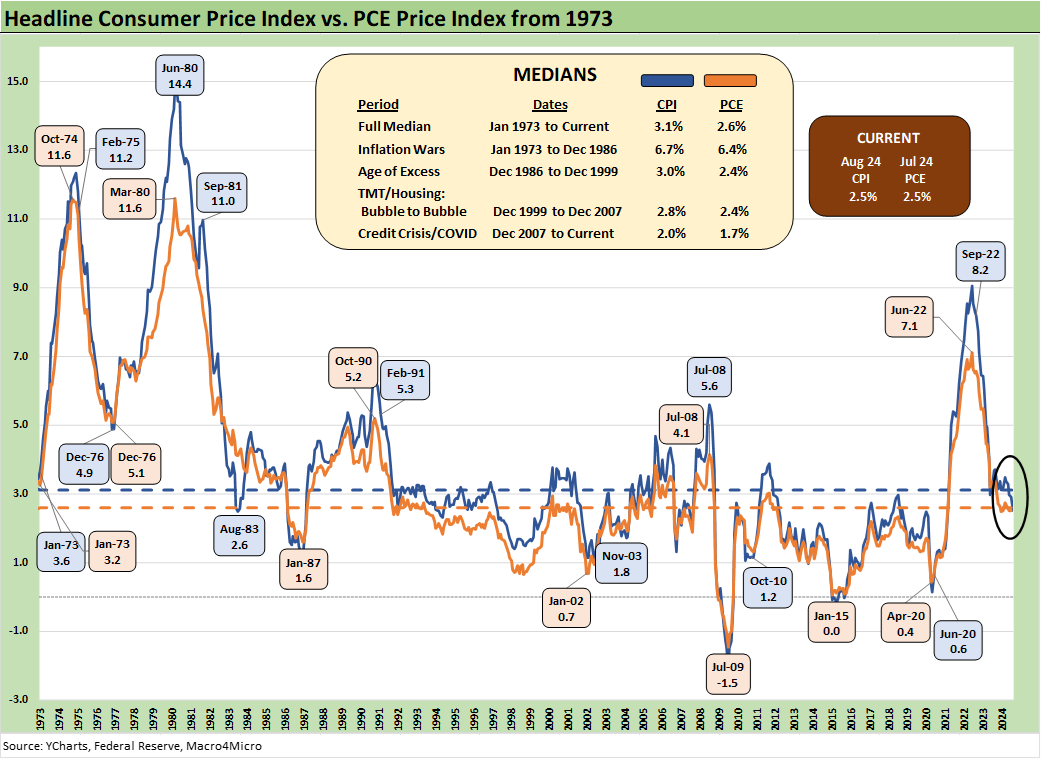
The Fed inflation discussions always revolve around the PCE price index (headline and core), so here we update the running long-term comparison of the two to help the thought process. The long-term medians for CPI and PCE are 3.1% and 2.6%, respectively. Those who came of working age in the 1970s still think about CPI, and we can’t get rid of the habit.
See also:
Facts Matter: China Syndrome on Trade 9-10-24
Tariffs: Questions that Won’t Get Asked by Debate Moderators 9-10-24
Footnotes & Flashbacks: Credit Markets 9-9-24
Footnotes & Flashbacks: State of Yields 9-8-24
Footnotes & Flashbacks: Asset Returns 9-7-24
Another Volatile Week: Mini Market Lookback 9-7-24
August 2024 Payrolls: Slow Burn, Negative Revisions 9-6-24
Trump's New Sovereign Wealth Fund: Tariff Dollars for a Funded Pool of Patronage? 9-5-24
Goods and Manufacturing: Fact Checking Job Rhetoric 9-5-24
JOLTS July 2024: Mixed Bag, Hires Up, Layoffs/Discharges Up, Quits Flat 9-4-24
Construction Spending: A Brief Pause? 9-3-24
Labor Day Weekend: Mini Market Lookback 9-2-24
PCE July 2024: Inflation, Income and Outlays 8-30-24
2Q24 GDP 2nd Estimate: The Power of 3 and Cutting 8-29-24
Harris Housing Plan: The South’s Gonna Do It Again!? 8-28-24
New Home Sales July 2024: To Get by with a Little Help from My Feds? 8-25-24
Payroll: A Little Context Music 8-22-24
All the President’s Stocks 8-21-24