
Construction Spending: Timing is Everything
We look at the latest strong numbers in construction, where earlier planning translated into economic wins.


We look at some very solid construction numbers for Oct 2023 as the timing of the mega project initiatives flowed into the solid 3Q23 GDP performance.
The 3Q23 GDP revisions of this week in Gross Private Domestic Investment and Fixed Asset Investment tell a story that makes the “landing” scenarios about a lot more than the consumer sector even if the latter still ranks #1 by a long shot in scenario spinning exercises.
The impressive YoY % growth in manufacturing construction stands out even as the largest private sector line item is disproportionately on the rise.

With a fresh dose of GDP data this week, we saw major upward revisions in some fixed investment lines and notably in structures (see 3Q23: Fab Five 11-29-23) where growth in the second 3Q23 GDP estimate included a quadrupling of the percentage increase on the structures line.
The construction data release this morning adds more granularity to the growth story and underscores where a lot of the progress is coming from with nonresidential spending leading the charge. We looked at some of these issues earlier in the fall (see Construction: Project Economics Drive Nonresidential 10-2-23), and the trend line continues as we break out herein.
The easy line items to highlight are in nonresidential, but we even see some stabilization and a turn in residential as the builders put the worst of the tightening and curve shift swoon behind them in construction projects. Multifamily and single family residential construction in progress has been covered in our home starts updates (see Housing Starts Oct 2023: Back in the Game Coach? 11-17-23), and the direction in 2024 will be heavily tied to the same UST curve questions driving so many other parts of the economy and markets at this point. Demand is there based on demographics, but the economics still are fuzzy for a sustained higher rate of activity in residential into 2024.
The trends and the history around “infrastructure” and the private-public tag team are born out of a combination of economic need and legislative incentives. Budget hawks (or partisan opponents of convenience) are often against such bills until the benefits show up in their backyard. Political shamelessness predates the Declaration of Independence, so that is old news.
The economic benefits of many contentious legislative initiatives were clear in the GDP numbers this week as well as in the construction update. How this all gets paid for is the other battle that will only play out through the budget process and next debt ceiling war in early 2025 after the next election. For now, economic growth and jobs have been the winners.
Construction has brought decidedly positive economic news even as some real estate sectors are under a dark cloud. Commercial real estate trends broadly often get conflated with “new money spending” by those who forget to separate “old real estate” and structures from the new. The issues around financial asset risk (the “Office Property” panic thing) is very real but also a different topic.
We looked at that distinction in earlier commentaries to hammer home valuation and loan risk should not get confused with the growth benefits of current construction ( see Construction Spending: Demystifying Nonresidential Mix 5-9-23). Yesterday’s “loan going bad” with a lien on an asset losing value is a threat to lenders, but new projects are based on economic inputs that make the project worthwhile (even if some of the assumptions there can be second-guessed such as long-term EV demand).
In this note we give an update on the construction rate of growth and the impressive numbers getting put on the board for intermediate term projects. Many of these projects “have legs” and will keep on running into 2024 even if the YoY math fades.
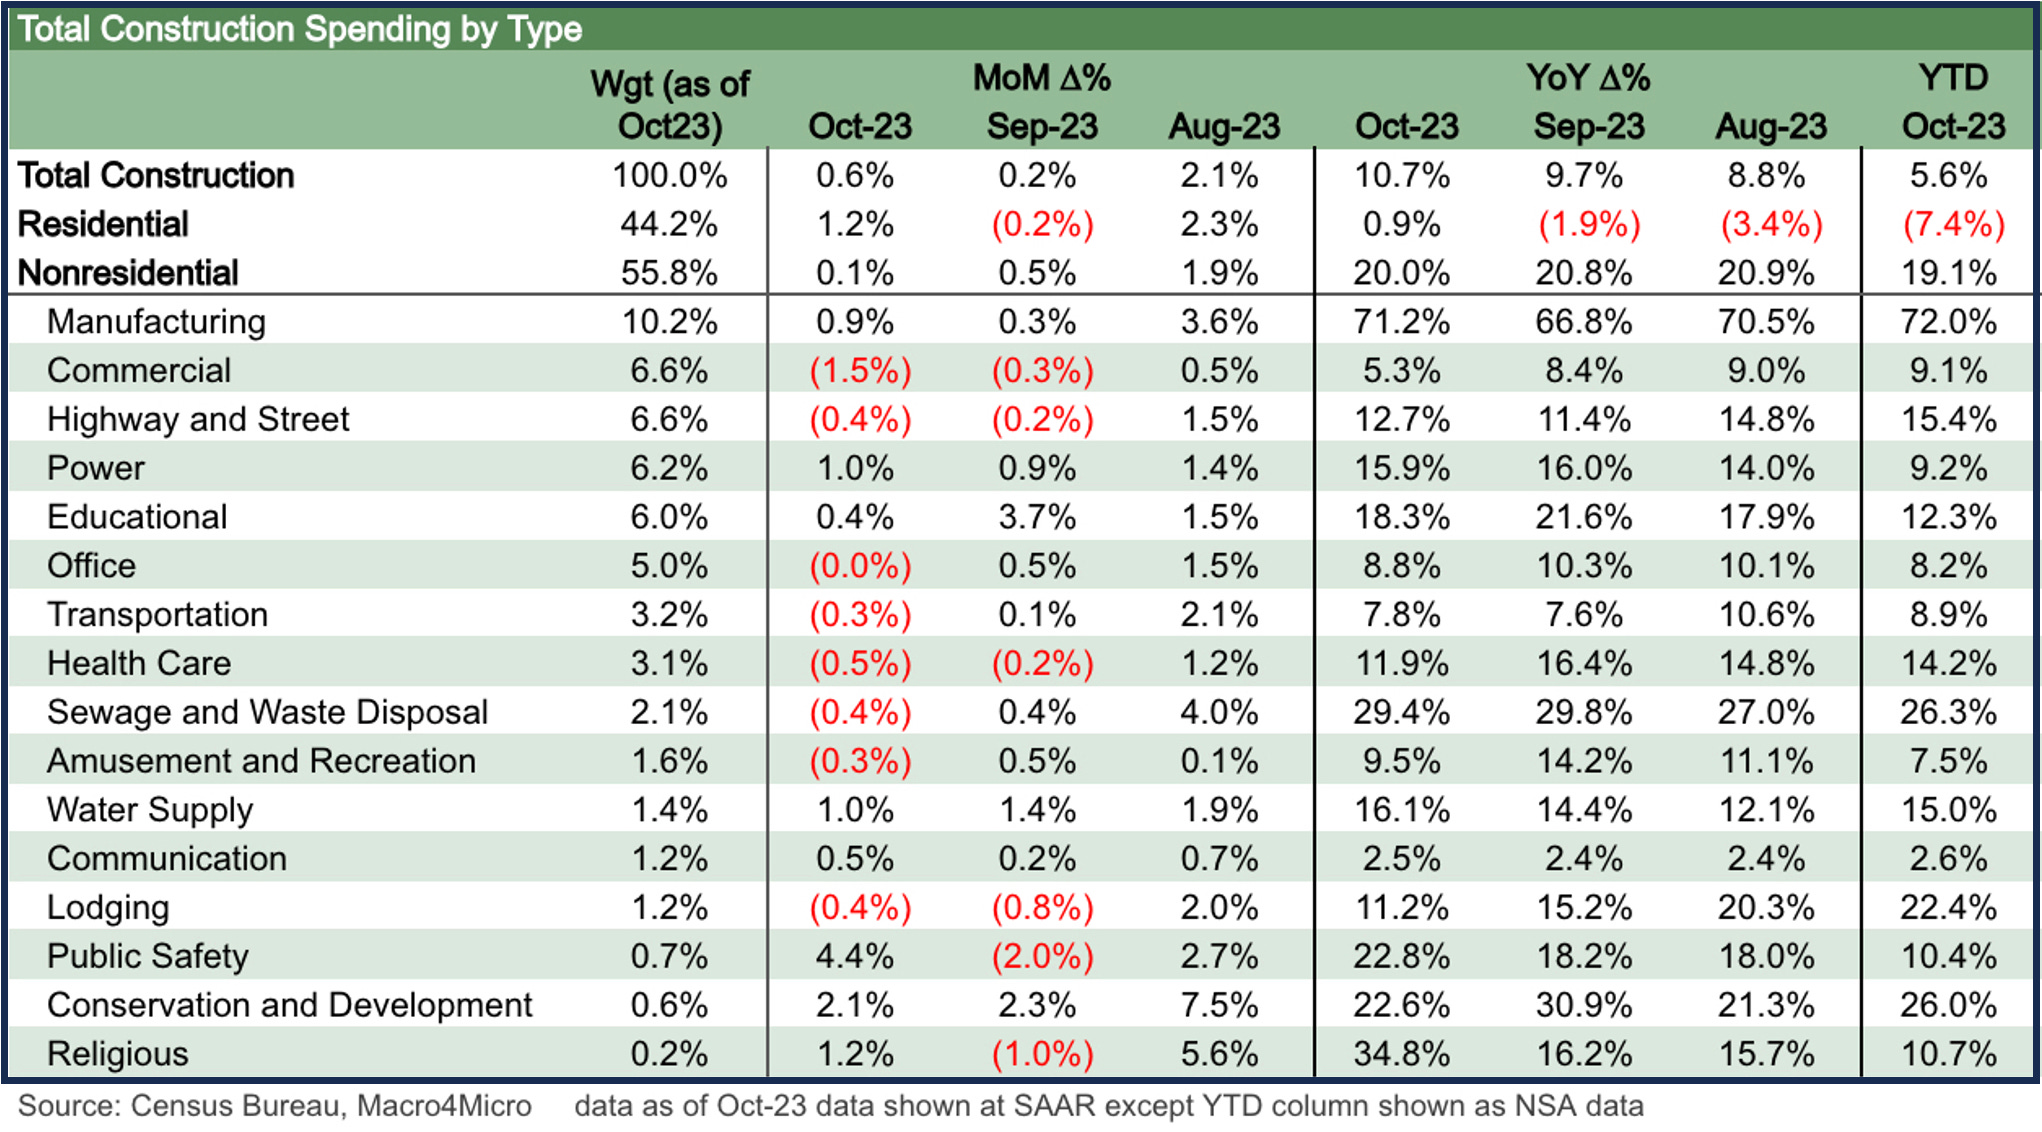
The above chart looks at the total construction numbers (private + public). The numbers show a lot of the positive effects of action in some major areas of need and in some cases catering to new investment opportunities. The debate is over whether all those opportunities are truly as good as hoped. There is a school of thought that “reshoring is its own reward” politically but also with respect to national security and mitigating geopolitical risk (notably as it relates to China). That bodes well for construction.
The legislative window is tricky in Washington and has never been this brutal. In a major swing election (like 2008, 2016, and 2020), the White House and party at the helm likely has two years open before the midterms smack them down. The bills passed can drive a lot of activity on the public dime as well as in the private sector capex budgets.
Whatever one might feel about the programs based on their party affiliations (notably climate-based bills these days), the feelings and ideological divides do not change the facts of measurable impacts such as construction. We all know that “facts” are not an abundant commodity in politics in the new age and too much of the media. But construction has plenty of them. The facts are that legislation has generated a lot of economic activity on the books across infrastructure, EV and related plant investments (battery, assembly, etc.) and in semiconductors and more.
Choices get made, and when new Presidents get elected the window is often not open for long with both houses aligned with the White House (Obama had 2 years, Trump had 2 years, and Biden had 2 years). You pick your spots and need to get it on the books before the usual midterm slap fight. Obama chose health care and financial market reform. Trump chose tax cuts and trade (protectionism) as his focus. Biden chose post-COVID stimulus and infrastructure, semis, and IRA (heavy on climate). Luckily for markets, Biden whiffed on Build Back Better and his apparent FDR syndrome.
Trump chose trade wars and tariffs and a NAFTA beatdown (and name change) over infrastructure. “NAFTA” was a product of Bush and Clinton, so the name had to go. That choice by Trump to avoid getting infrastructure done and focusing on trade war flexing was a bad move and most of the GOP knew it (even if most were hiding under their desks). Trump started damaging trade skirmishes that hammered the farm sector and set the stage for inflation pressure that only got worse later under Biden in the post-COVID ZIRP world.
Trump’s trade policies also upset domestic capex planning on major questions of policy stability that raised the stakes on supplier chain and capacity planning. We look at the investment fade and the 2019 weakness that drove the Fed to ease in separate commentaries.
There is a reason that Trump and some of his deep-thinking minions in the House were opposed to such bills as infrastructure and CHIPS. It would be a win for Biden by being a win for the economy, and that is very much in evidence in the fixed investment line items and in jobs. The Senate, with its higher ratio of housebroken members than in the House, knew that many of these bills were good economic measures and could thus get more support. Build Back Better of course did not get the support it needed even from the Democrats for a long list of reasons that do not matter any longer.
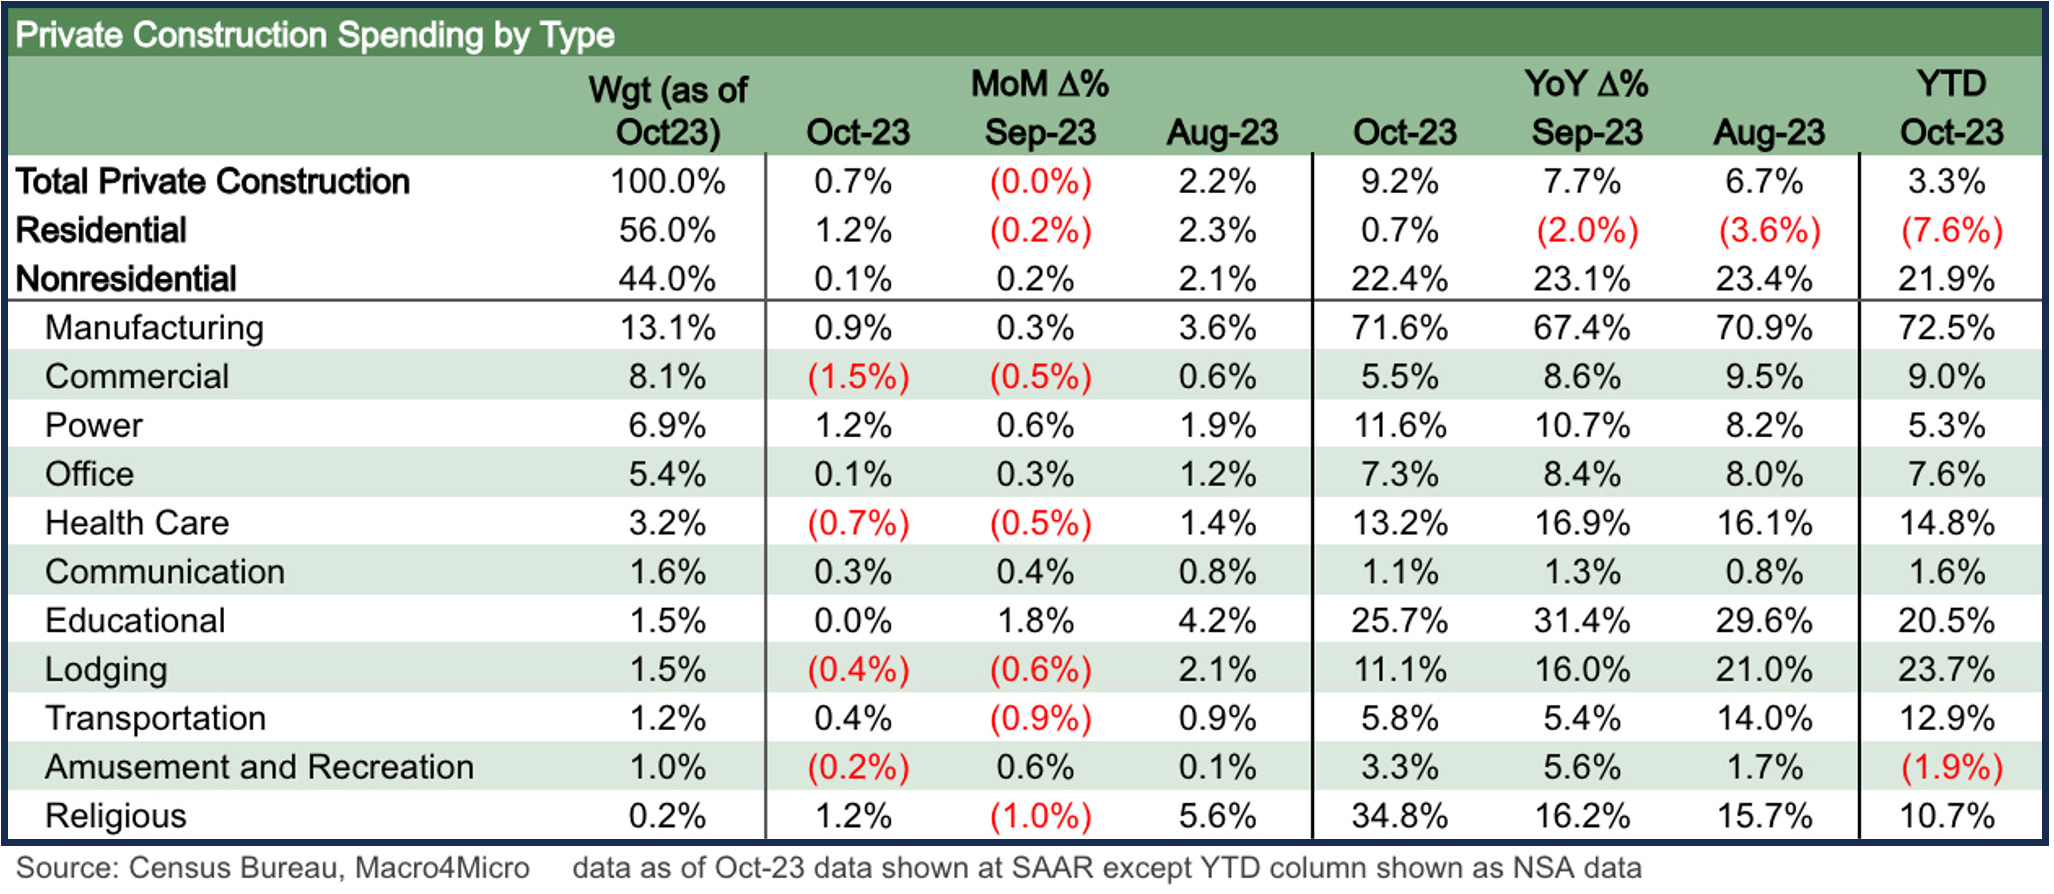
The above chart breaks out the private piece of the construction story, and the array of positive YoY numbers show the clearly positive impacts. We line these categories of spending up in descending order of weight. The Manufacturing number is pretty dazzling at a +71.6% increase YoY as the largest category. With respect to the theme that the US needs to rebuild its manufacturing capabilities, that is the type of trend that the market needs to see.
The biggest regional beneficiaries of that spending run across the political spectrum with much of it in the transplant belt (i.e., “red states”) as well as the classic swing states. As we covered in earlier construction commentaries, these trends flow directly into a few hundred thousand jobs in construction (see October Jobs: Market Ponders the Enigma in the Puzzle 11-3-23). That does not even include the multiplier effect benefits across the supplier chains (materials, components, equipment) and supporting infrastructure services (freight and logistics, financial services, etc.). Taxes at the state and local level also win.
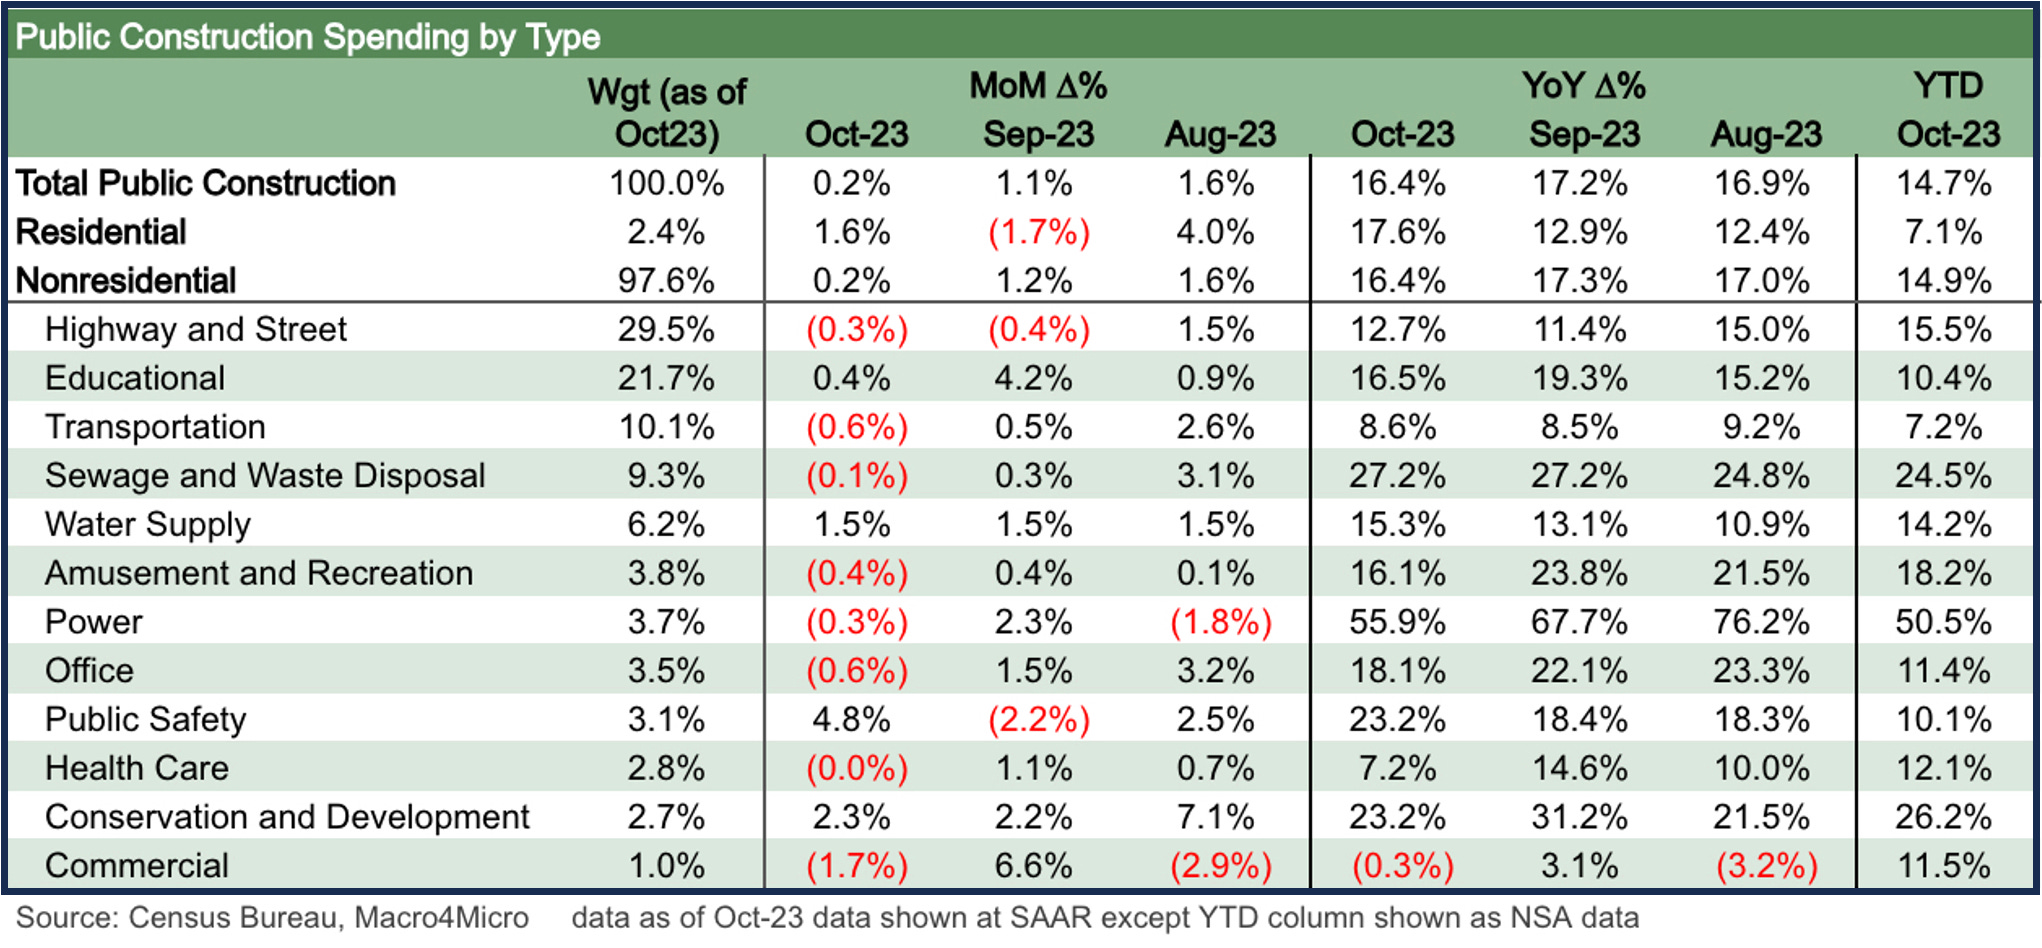
The above chart for the public sector is more of what we expect in an infrastructure bill and the crying need for more upgrades to support a growing population and record number of “bodies” on payrolls and a record retiree base.
Public sector infrastructure is not as satisfying to the ego as head slapping global leaders and handing out tariffs at will, but the economic effects are positive instead of negative (like tariffs, where the buyer pays and not the seller, rumors to the contrary from the Trump team). Choices were made, and the decision was that trade battles beat infrastructure as a priority. The credit to those who get it done was a political worry before and after the fact, so the tendency is to obscure and obfuscate how important these neglected areas clearly are in the real economy.
Contributors:
Glenn Reynolds, CFA glenn@macro4micro.com
Kevin Chun, CFA kevin@macro4micro.com