
Footnotes & Flashbacks: Asset Returns 9-22-24
We look back at a week that saw equities rally and credit spreads tighten while bond returns weakened.


The new FOMC game begins for 4Q24…
The FOMC action got risky assets back in rally mode, but much bigger questions of fiscal and economic policy lurk dead ahead from taxes to trade to defense and some very challenging deficit math.
The risk rally and fresh round of expectations of more cuts will at least temporarily push back on the buzz kill of trade war scenarios, the hard truths on tariff risk, and the natural slowing of numerous subsectors and industries at this point in the cycle.
The 3Q24 earnings season will be unfolding in what is perhaps the most important election since 1860 with the1968 election war seeming like a no-name undercard in historical context.

Despite some setbacks in bellwether tech, the above chart shows a very solid mix of positive returns across the 1-month and 3-months for the high-level debt and equity asset classes we monitor. Credit markets and fixed income turned in a strong 3-month run as duration supported bond performance after a rough start to the year and credit spreads stay compressed and near the historical lows of the past cycles.
For credit, HY has rallied sharply off the FOMC action this past week while US-centric small caps are telling a favorable story that did not evaporate as quickly as the late 2023 rally did for the Russell 2000 benchmark. We see double-digit total returns YTD across the board in equities with 20% handles in large cap broad market benchmarks.

The above chart updates the 1500 and 3000 benchmarks that show some pockets of relative weakness in Energy and Growth over 1 month and 3 months but off a still very strong YTD period with Energy a notable exception.
Financials and Industrials have both held in well with Value while Growth has been more volatile of late. For 2024, Real Estate is perhaps the biggest surprise as it rallied hard with interest rates from the 1-month and 3-months periods while still ringing up double-digit YTD returns at just under +14%.
The rolling return visual
In the next section, we get into the details of the 32 ETFs and benchmarks for a mix of the trailing periods. Below we offer a condensed 4-chart view for an easy visual on how the mix of positive vs. negative returns shape up. This is a useful exercise we do each week looking for signals across industry groups and asset classes. We also have a YTD version that we include in the broader commentary on the time horizons further below.
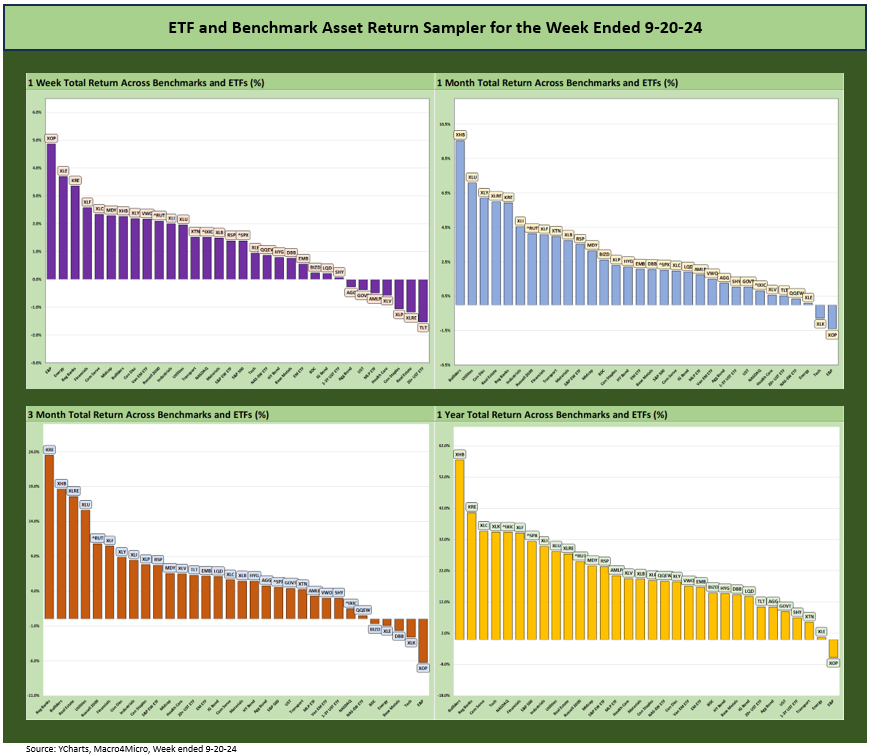
The positive symmetry in the above chart does not leave much room for debate with the heavy mix of positive returns including a 31-1 score for the LTM period and more recently the 30-2 period for the 1-month folded into a 27-5 period over 3 months that included the VIX spike. We don’t include the YTD period in the above chart, but that timeline rings up a 30-2 score with only the Transports ETF (XTN) and E&P (XOP) in the red.
The Magnificent 7 heavy ETFs…
Some of the benchmarks and industry ETFs we include have issuer concentration elements that leave them wagged by a few names. When looking across some of the bellwether industry and subsector ETFs in the rankings, it is good to keep in mind which narrow ETFs (vs. broad market benchmarks) get wagged more by the “Magnificent 7” including Consumer Discretionary (XLY) with Amazon and Tesla, Tech (XLK) with Microsoft, Apple, and NVIDIA, and Communications Services (XLC) with Alphabet and Meta.

We already looked at the rebounding tech performance for the week in our “Mini Market Lookback” posted earlier (see Mini Market Lookback: FOMC Week 9-21-24). The weekly tech returns show only one bellwether in the red, and that is a long way from the all-negative performance of two weeks ago. We see 3 of the Mag 7 in the red for the trailing 3 months (Alphabet, Microsoft, and NVIDIA), with 5 of the Mag 7 in double digits for 6 months (ex-Amazon and Microsoft) and only Tesla negative on a YTD basis.

We see the 1-week return mix at 25-7 favoring positive for the worst mix of the timeline collection. The above chart was also addressed in the Mini Market Lookback earlier, and the relatively weaker returns of bond ETFs was a highlight with 3 in negative range (TLT, GOVT, AGG) on duration set against the longer end steepener.
Energy rebounded impressively into the top two leaders with Regional Banks (KRE) and Financials (XLF) near the top. Midcaps and Smal Caps beat out the large cap NASDAQ and S&P 500 for the week. They also trumped the Equal Weight S&P 500.
Homebuilders (XHB) held in well in the top quartile on favorable mortgage rate trends while the Real Estate ETF (XLRE) did a fade in the bottom rung as the UST curve moved higher on the long end.
The flexibility of Homebuilders (XHB) to keep driving volumes using their array of incentives make them a very distinctive interest-rate-sensitive play. The Real Estate (XLRE) fade comes against a very solid 1-month and 3-months performance (see charts further below) as investors wrestle with valuation.

The 1-month performance weighed in at a 30-2 score with E&P digging a hole on oil prices before this past week’s rally and the Tech ETF (XLK) still showing the pain of 2 weeks ago in second to last (see Another Volatile Week: Mini Market Lookback 9-7-24).
In equities, interest rate sensitive ETFs, cyclicals, and value stocks showed strength in the mix above. Homebuilders (XHB) rallied back again with Utilities (XLU), Real Estate (XLRE), Regional Banks (KRE), and Financials (XLF) among the top quartile.
Bond ETFs for 1 month were spread across the bottom, third, and lower half of the second quartile as spreads performed well and shorter duration held in better with TLT at the bottom of the bond ETF mix. Energy was at the bottom with E&P (XOP) and Tech (XLK), Equal Weight NASDAQ 100 (QQEW), and NASDAQ in the bottom quartile.
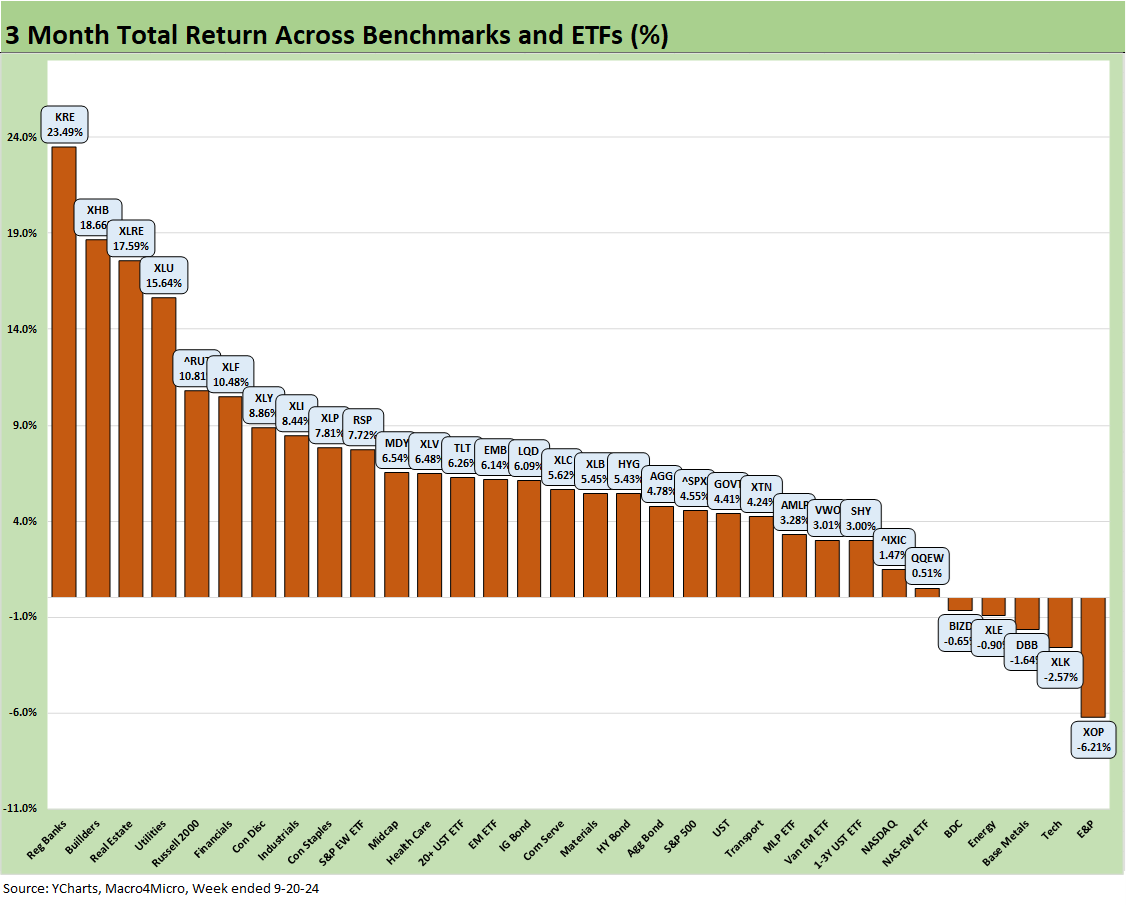
The 3-month stretch weighed in at 27-5 with all 7 bond ETFs positive and E&P (XOP), Tech (XLK) and Base Metals (DBB) making an unusual bottom 3 mix with Energy (XLE) and the BDC ETF (BIZD) rounding out the five line items in the red.
In the top tier, we see interest rate sensitivity winning again with Regional Banks (KRE) on top followed by Homebuilders (XHB), Real Estate (XLRE), and Utilities (XLU) up in the top of the rankings followed by the Russell 2000 and Financials (XLF).
Bond ETFs are all positive but spread across a few quartiles. We see a single bond ETF in the upper end of the bottom quartile with the short UST 1Y-3Y ETF (SHY) to go with three in the third quartile (GOVT, AGG, HYG) and three in the second quartile (TLT, EMB, LQD) as favorable duration returns took over in recent months with TLT on top among the bond ETFs.

The YTD returns show a 30-2 score with E&P (XOP) barely in the red and the Transports ETF (XTN) as a regular bottom dweller in last place at -4.1%. We see 5 bond ETFs in the bottom quartile YTD as bonds have a hard time keeping pace with stocks in a good equity year. The other 2 bond ETFs are in the third quartile with EM Sovereign debt (EMB) on top of the bond ETF alternatives and HYG next.
What is striking over the YTD period is that we see Communications Services (XLC) at #3, the Mag 7 heavy S&P 500 at #5, and NASDAQ at #6 but the Tech ETF (XLK) in the second quartile and Equal Weight NASDAQ 100 ETF (QQEW) in the bottom quartile. We see the Equal Weight S&P 500 ETF (RSP) at +13.4% and ranking 8 slots below the S&P 500 (+20.8%).

The trailing 1-year score of 31-1 got to ride the big rally in risk in Nov-Dec 2023 and the rebound later in 2024 after a rough start for duration in 1H24. Duration was not a winner into the UST peaks of Oct 2023 (10-19-23 peak for 10Y UST), but then the rally kicked into gear for the final two months of the year. The market posted a solid LTM for equities and bonds with major rallies in equities and credit spreads to wrap calendar 2023 followed by more good equities numbers in 2024. HY spreads are tighter than the end of 2023 as of this point but only modestly so given the year end 2023 rally.
We see Homebuilders (XHB) on top at a very impressive +57.5% and Regional Banks (+40.6%) at a distant #2. The Mag 7 influence is evident at #3 (XLC), #4 (XLK), #5 (NASDAQ) and #7 (S&P 500) with Financials (XLF) breaking up the mix at #6. Industrials rounded out the top quartile.
We see energy on the bottom with E&P (XOP) as the sole item in the red and Energy (XLE) just across the line in positive range. The bond ETFs include 5 of the 7 ETFs in the bottom quartile with HY (HYG) and EM Sovereign (EMB) modestly higher in the third quartile. EMB posted +16.6% returns and HYG +14.7%, so those two asset classes registered returns ahead of the long-term nominal returns in equities. That may be low in the rankings, but that is in the context of an LTM with a very strong equity market.
See also:
Mini Market Lookback: FOMC Week 9-21-24
Existing Homes Sales Aug 2024: Mortgages Still Rule 9-19-24
Home Starts Aug 2024: Mortgage Rates to Kickstart Hopes Ahead? 9-18-24
FOMC Action: Preemptive Strike for Payroll? 9-18-24
Retail Sales: Down to the Wire? 9-17-24
Industrial Production: Aug 2024 Capacity Utilization 9-17-24
Footnotes & Flashbacks: Credit Markets 9-16-24
Footnotes & Flashbacks: State of Yields 9-15-24
Footnotes & Flashbacks: Asset Returns 9-15-24
A Strange Policy Risk Week: Mini Market Lookback 9-14-24
Consumer Sentiment: Inflation Optimism? Split Moods 9-13-24
CPI Aug 2024: Steady Trend Supports Mandate Shift 9-11-24
Facts Matter: China Syndrome on Trade 9-10-24
Tariffs: Questions that Won’t Get Asked by Debate Moderators 9-10-24
August 2024 Payrolls: Slow Burn, Negative Revisions 9-6-24
Construction Spending: A Brief Pause? 9-3-24