
Existing Homes Sales June 2024: Supply Up, Prices Up, Volume Down
June existing home sales was a “more of the same” month with a similar, unusual pattern of “inventory up, prices up” also seen in May.


Inventory, prices, volume. First, lower the mortgage rates….
The similarities of June 2024 trends to May were clear enough with inventories rising and median prices hitting record highs again but with volumes off (see Existing Home Sales May 2024: Weary Climb 6-21-24).
The high 6% range of mortgages has just not moved the needle enough on monthly payment strain, and the recently elevated hopes seen in the market around the direction of interest rates could be giving buyers pause on locking in rates now and/or encouraging sellers to hold the line on prices.
The net effect has been all four regions posting price gains, but volumes also declined in all four regions even with inventory climbing across the total market by +23.4% YoY for June.
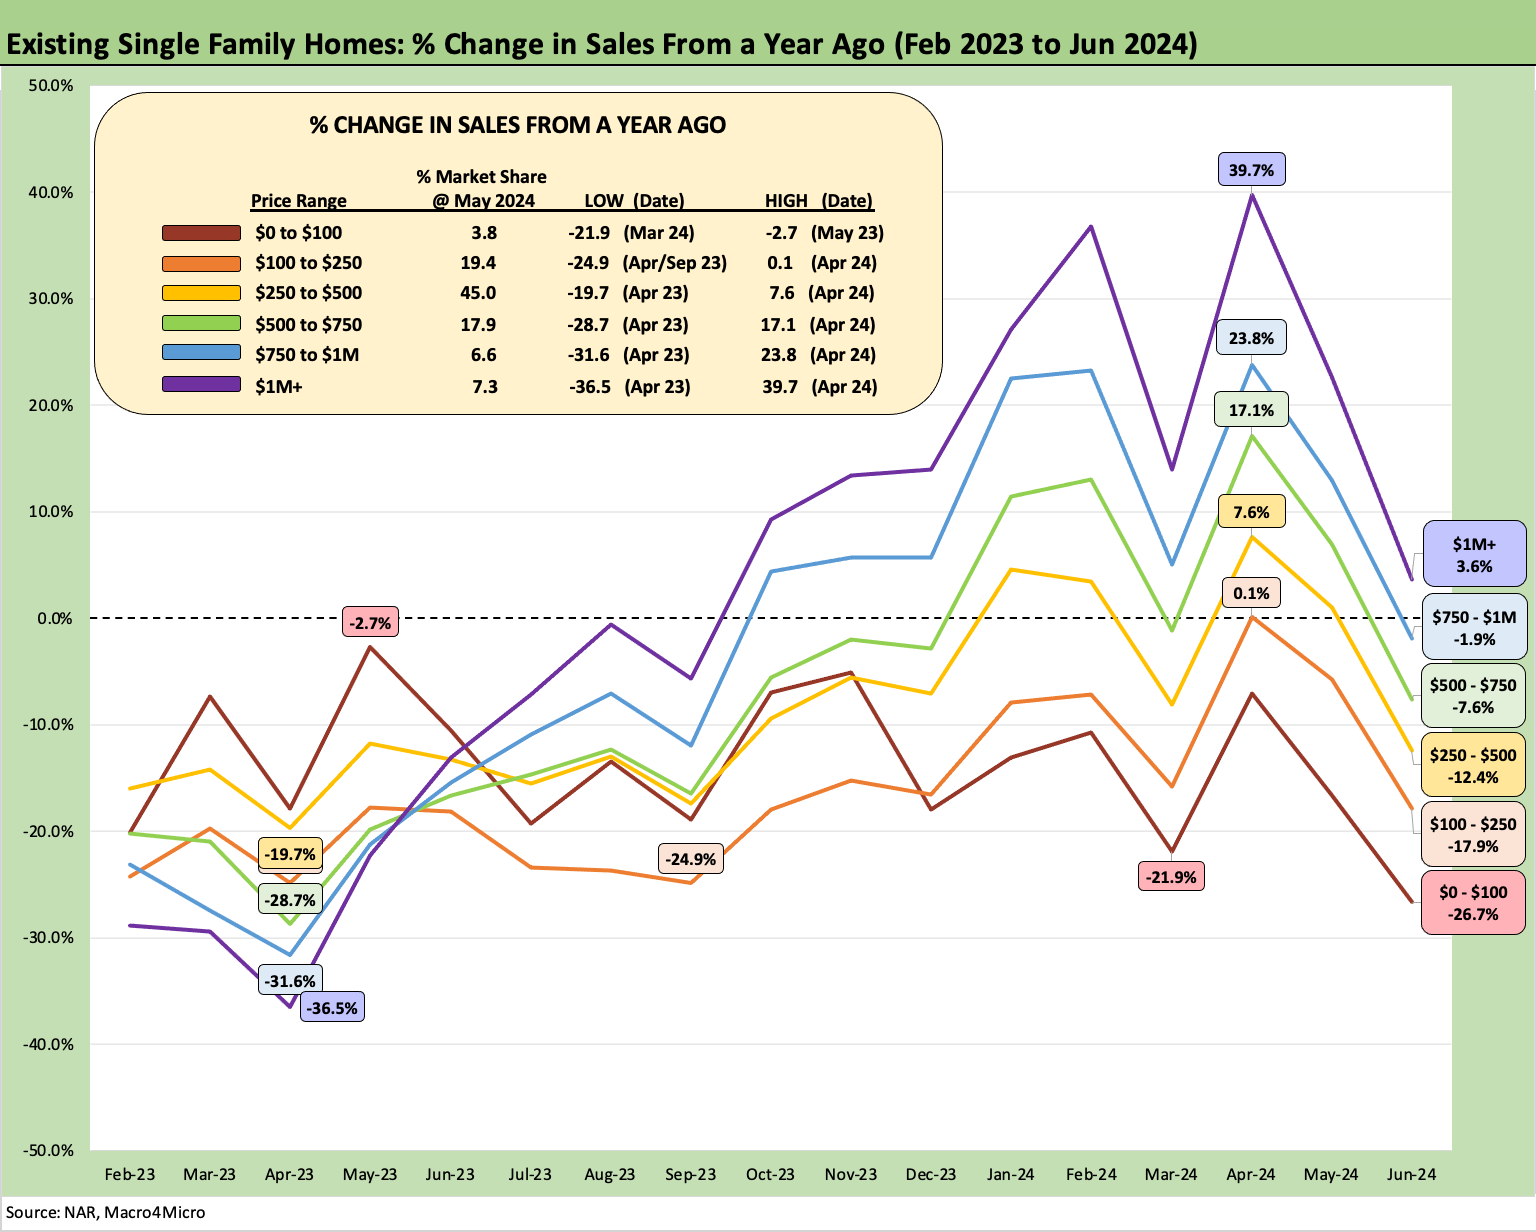
The above chart had been showing the rich getting richer with the higher price tiers rising faster and the lower price tiers staying frustrated. The lower share of first-time buyers in the current market are part of the underlying factors. We also might be seeing a bigger share of the potential buyer base falling short in terms of mortgage qualification or unable to get “enough house” for their dollar.
As we have covered across the year, the new home builders have more tools at their disposal to drive volume and notably with their mortgage buydown programs and captive mortgage operations, fee incentives, and some tactical price discounting where possible without upsetting the community sales planning.
Life is not as easy for existing home sellers, and the locked-in mortgage effect is tough on move-up buyers. The home price is one problem, but the bigger problem is borrowing rates for someone holding a 3% or 4% handle mortgage.
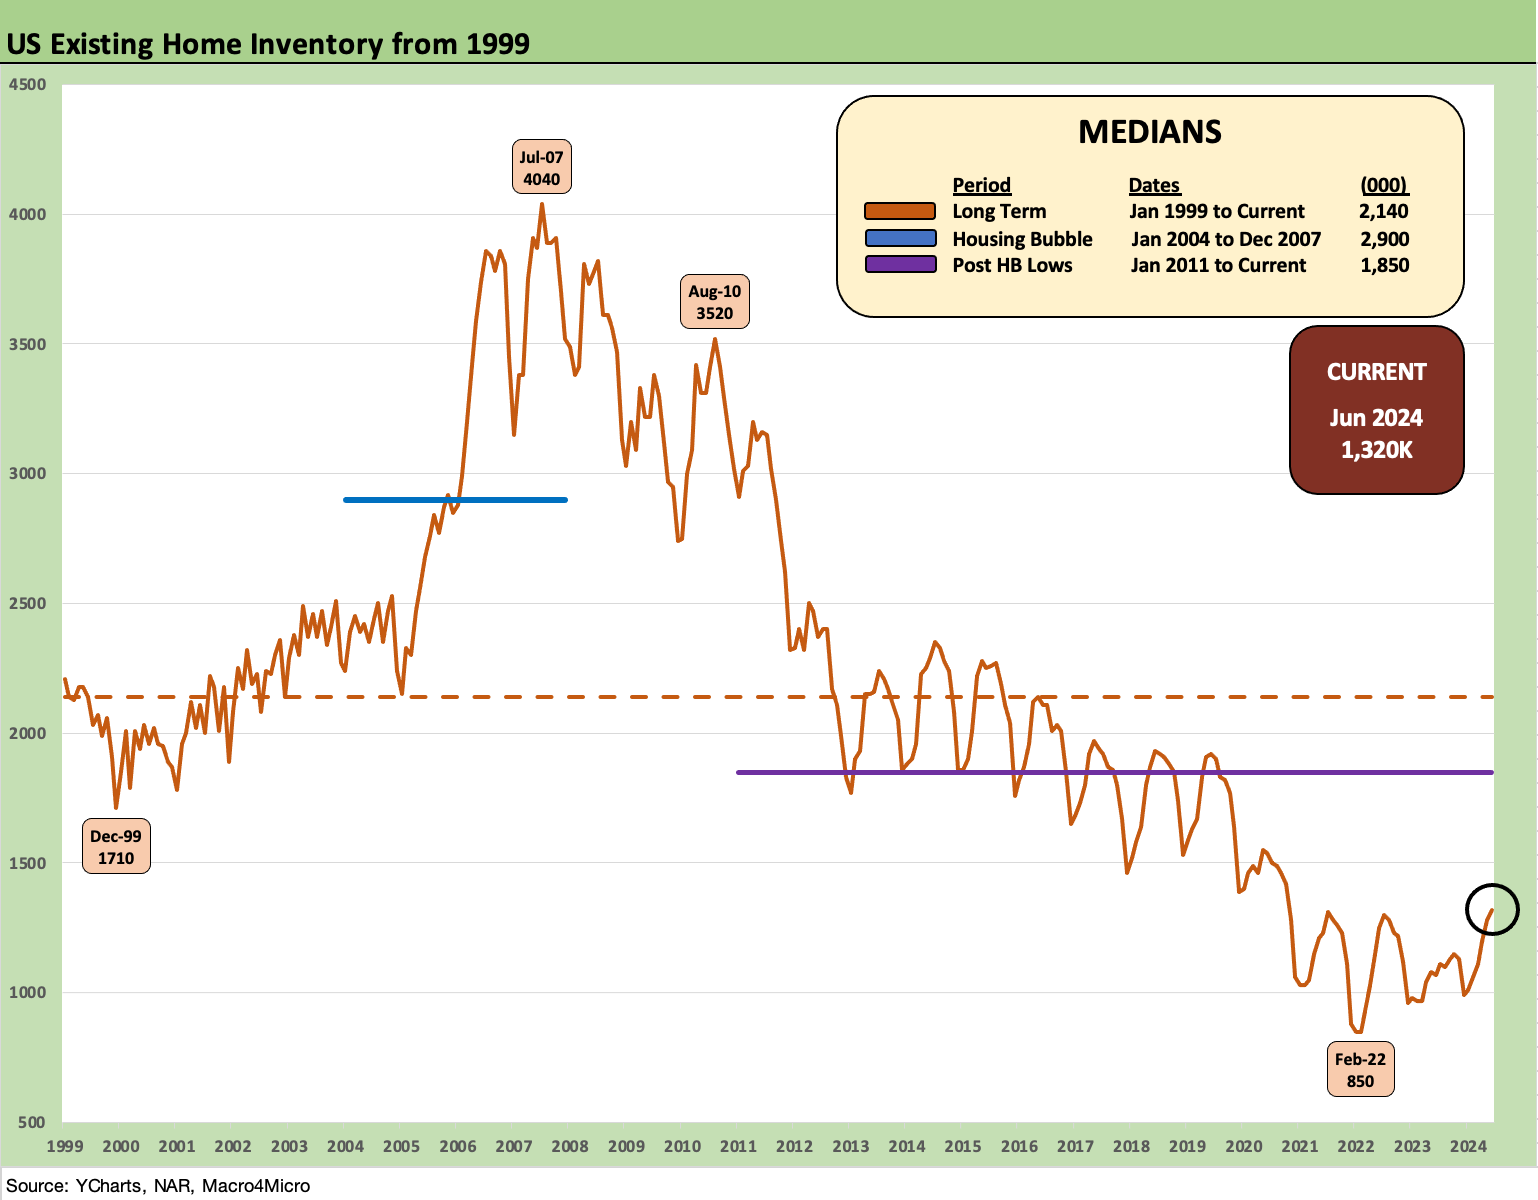
The existing home sales inventory climbed to 1.32 million units with the peak selling season underway, but the higher prices and mortgage backdrop are not turning and transacting at a pace to keep up. Total existing inventory reached 4.1 months at current selling rates which is the first time over 4.0 months supply since 2020. That was an eye-catching headline. Single family only inventory weighed in at 3.8 months in June, up from 3.5 months in May and is higher than the past year.
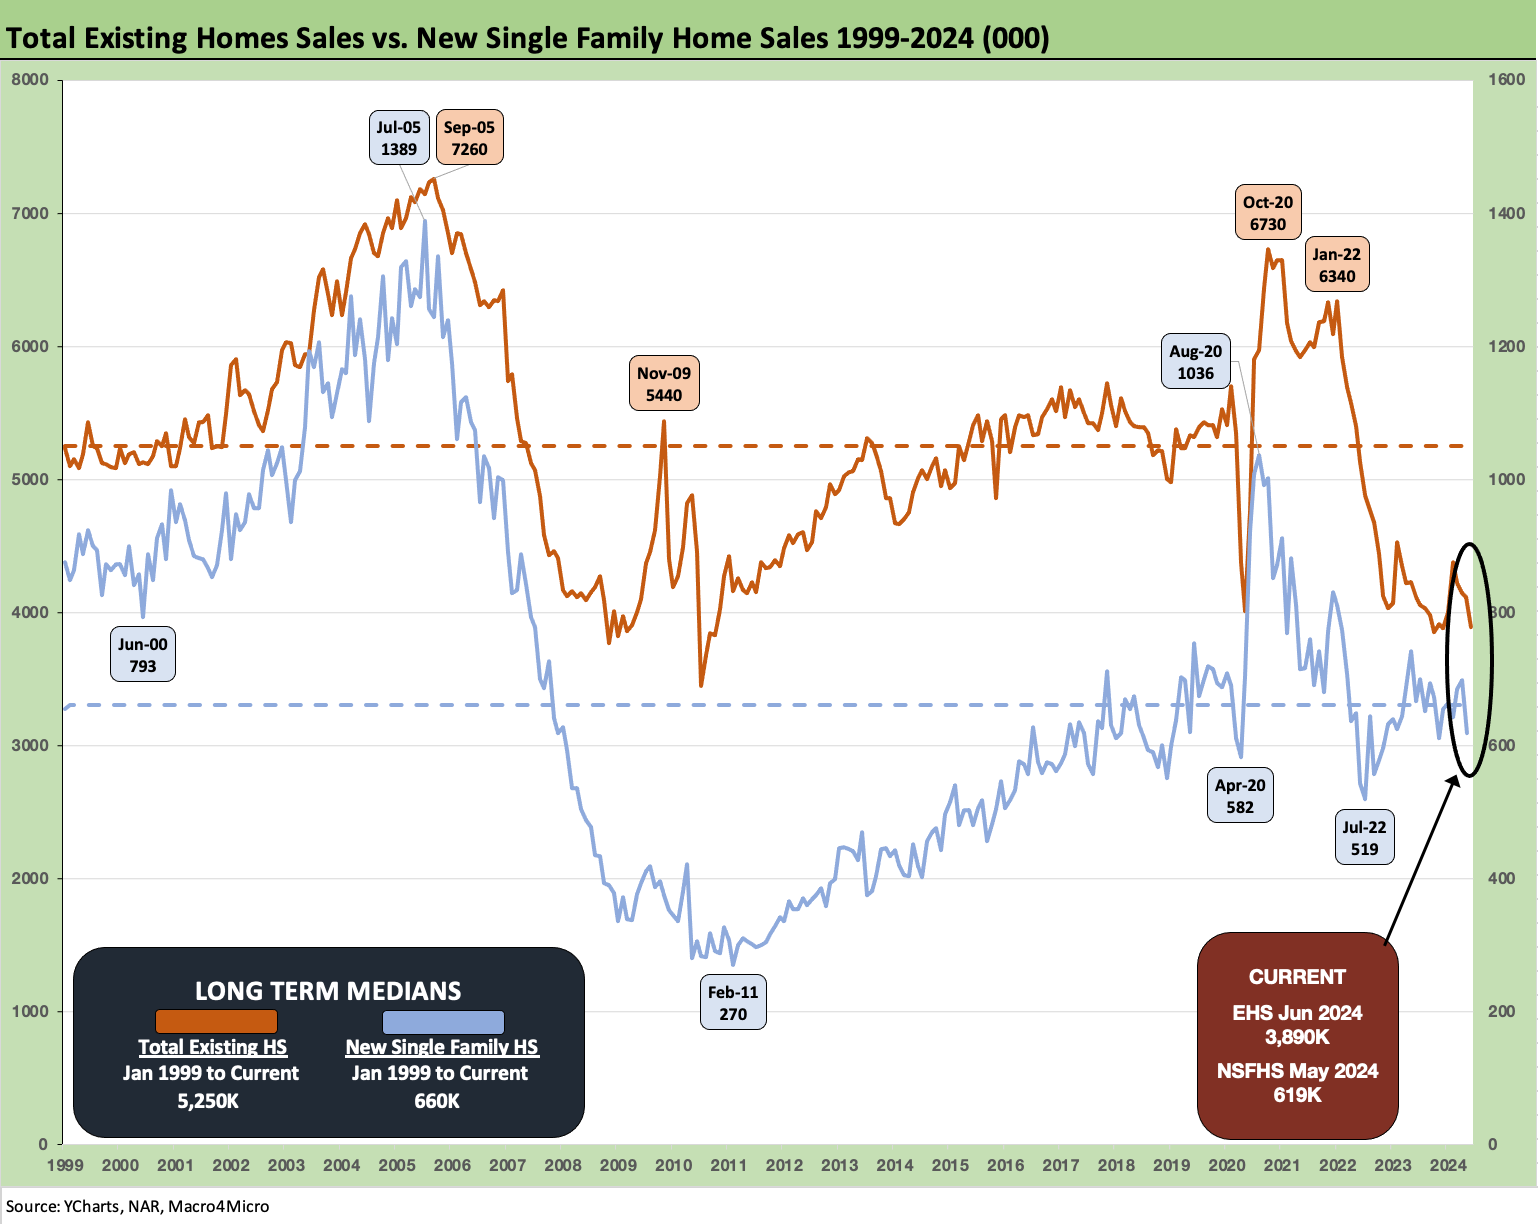
The above two-sided chart updates the pattern of sales volumes for total existing home sales (“EHS”) vs. new single family home sales. The EHS weighed in 3.89 million for June after 4.11 for May 2024 while new single family sales for May was a grim 619K (see New Home Sales: Pumping the Brakes 6-26-24). We will get the updated new single family numbers for June 2024 tomorrow.
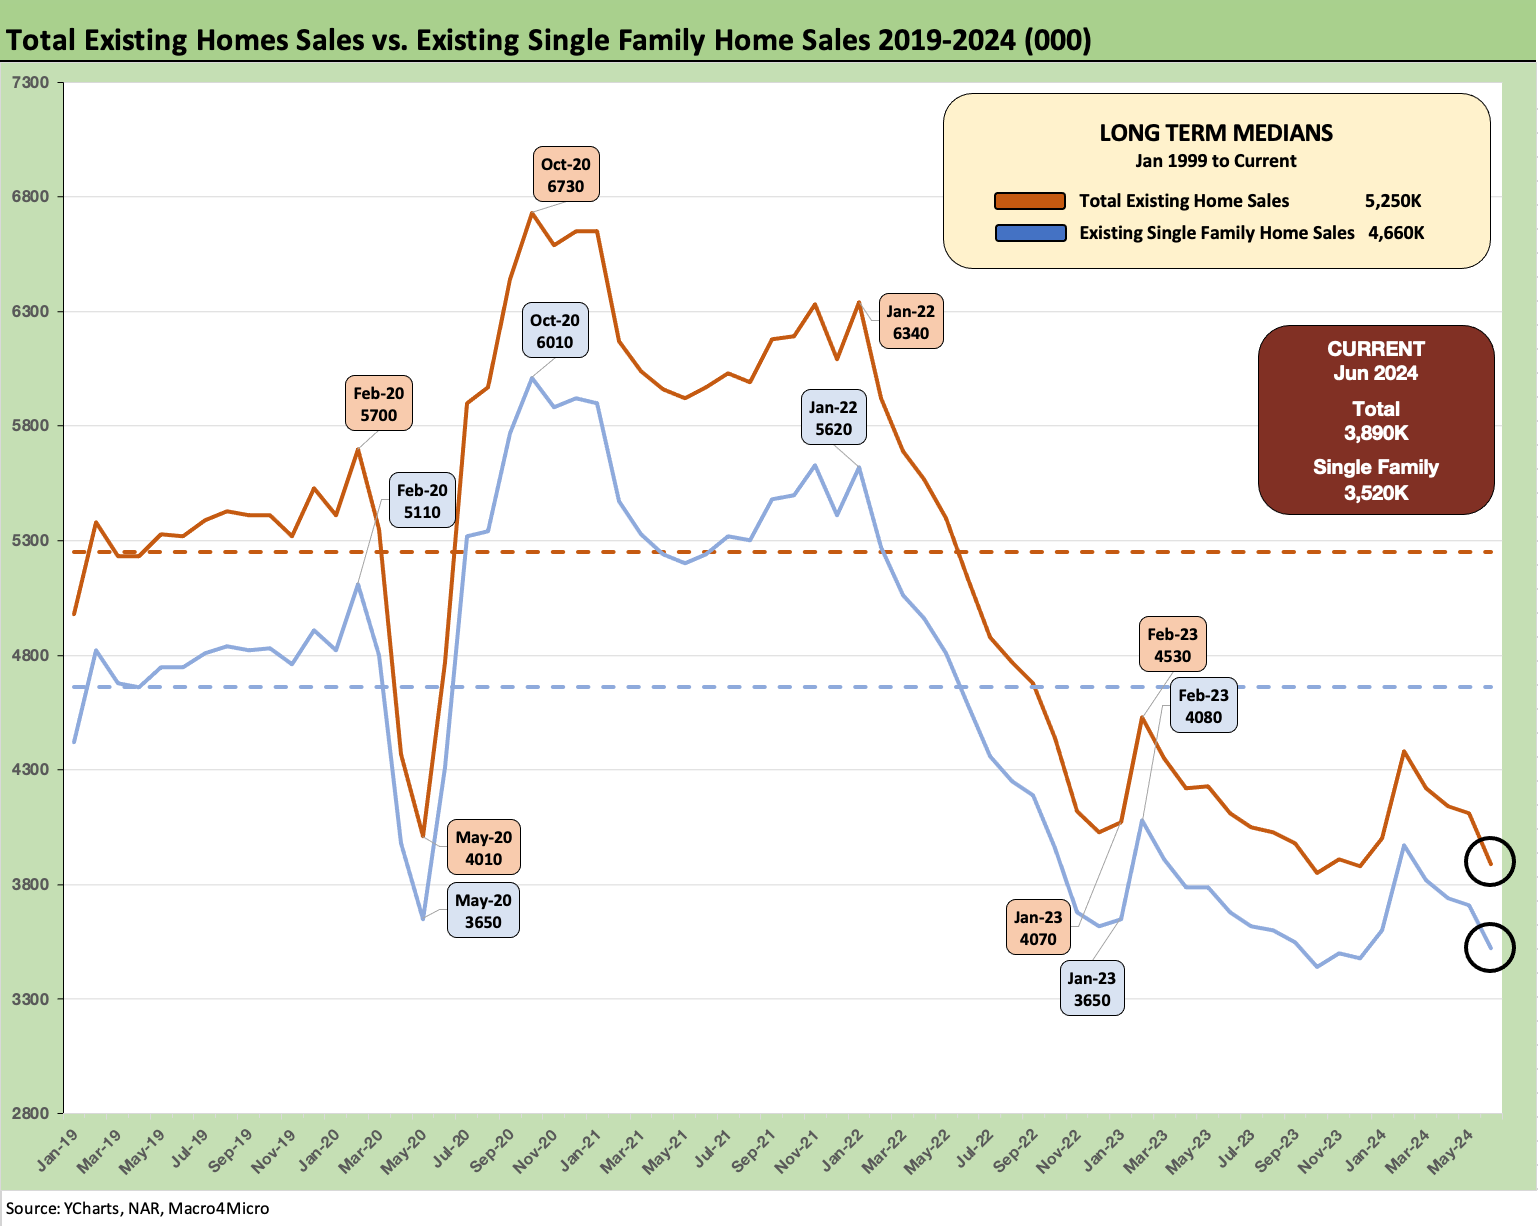
The above chart breaks out the timeline for single family alone vs. total existing home sales of 3.89 million, which is well below the long-term median (from Jan 1999) of 5.25 million. The lower line is ex-condo/ex-co-ops. Total single family ex-condos/co-ops declined sequentially to 3.52 million in June from 3.71 million in May. We saw 380K in condos and co-ops in June, down from 400K in May 2024.
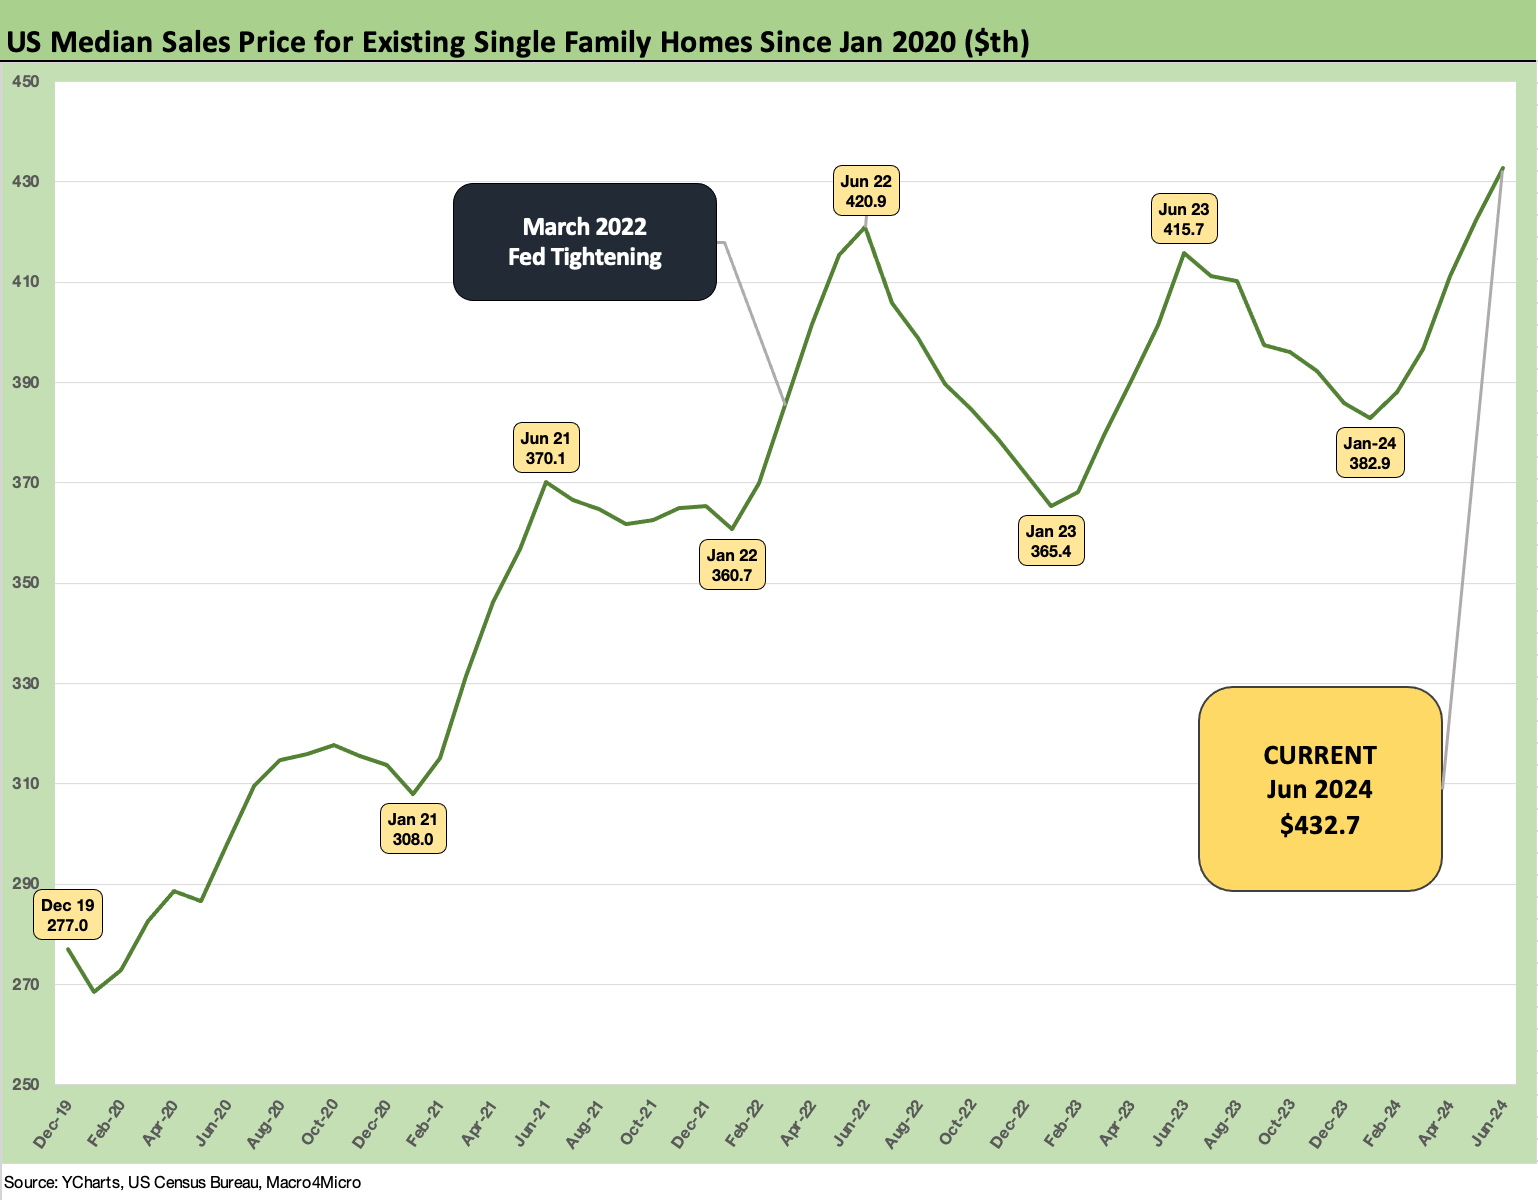
The above chart gives a simple visual on the timeline for median single family home prices into the past two months of record highs with rising inventory levels strangely enough also part of the trend mix.
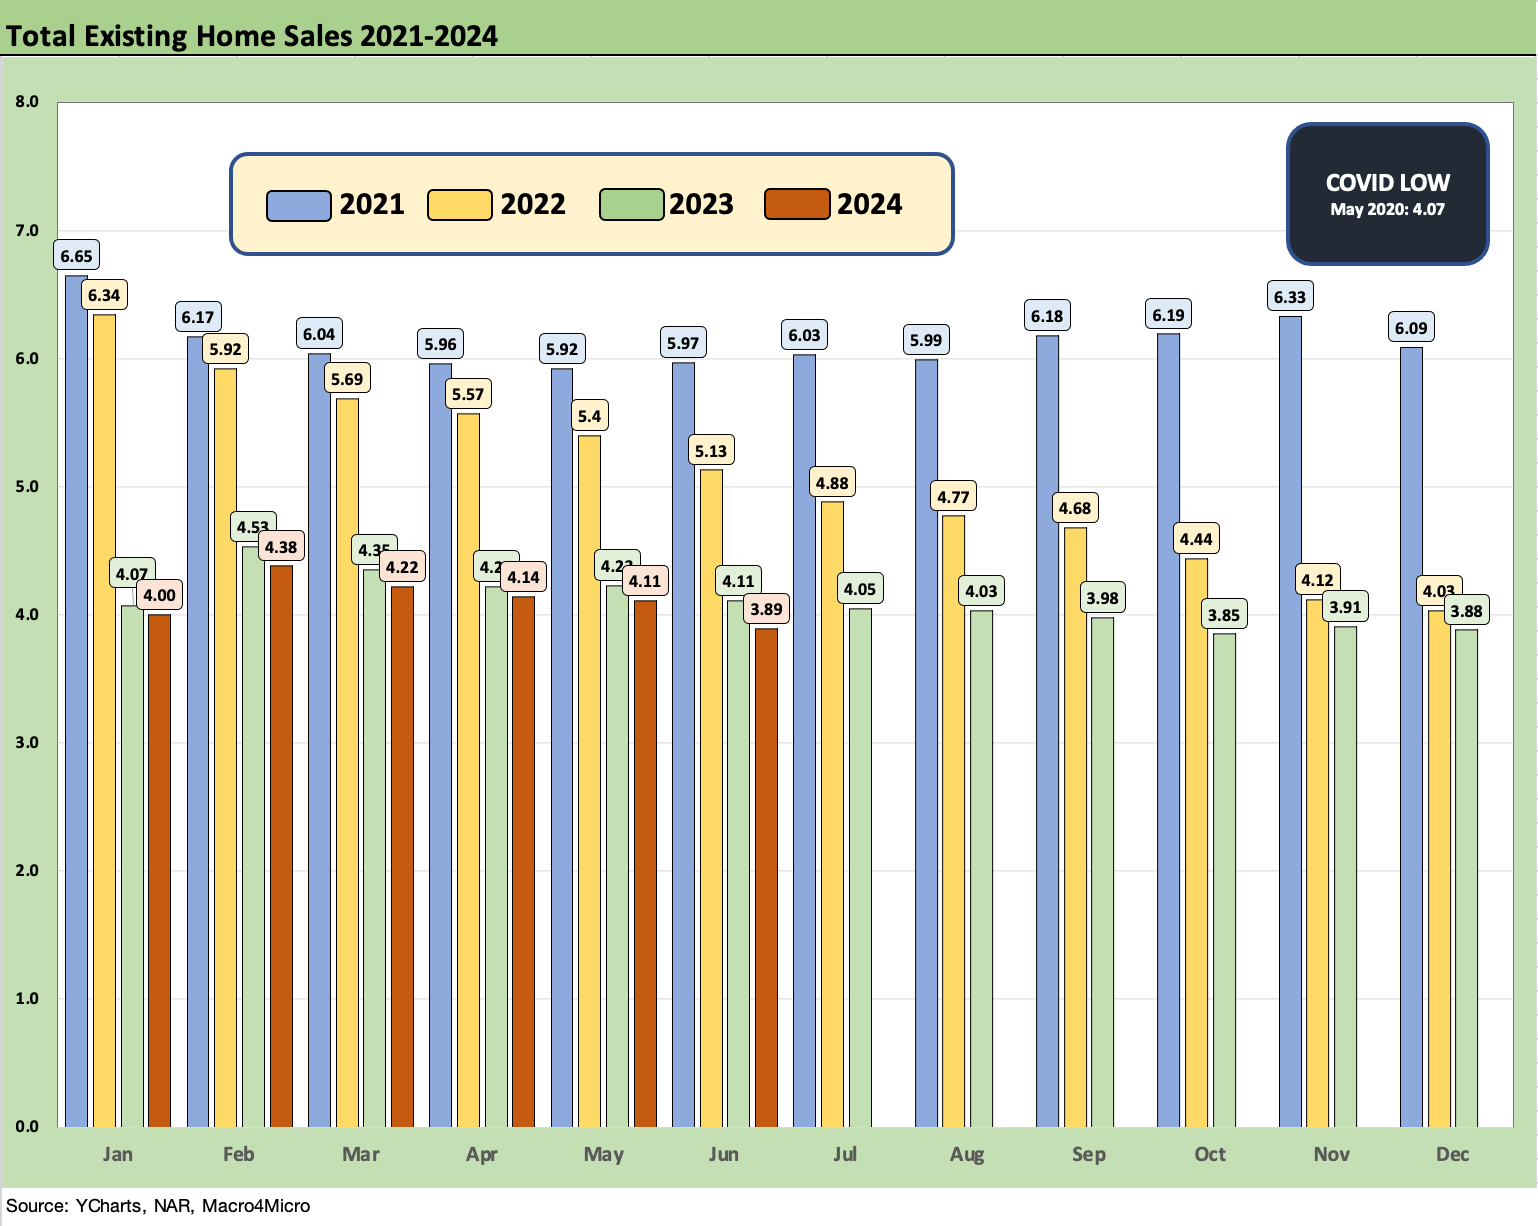
The above chart updates the monthly existing home sales across the timeline from Jan 2021 through June 2024. The market is a long way from the 6 million and high 5 million handles of 2021 and then into early 2022 when many homeowners refinanced, and new buyers locked in low mortgages. ZIRP ended in March 2022 and then the UST migration began (see Footnotes & Flashbacks: State of Yields 7-21-24).
The June 2024 total of 3.89 million is below the May 2020 COVID trough although we had a few more sub-4 million handles along the way as noted in the chart.
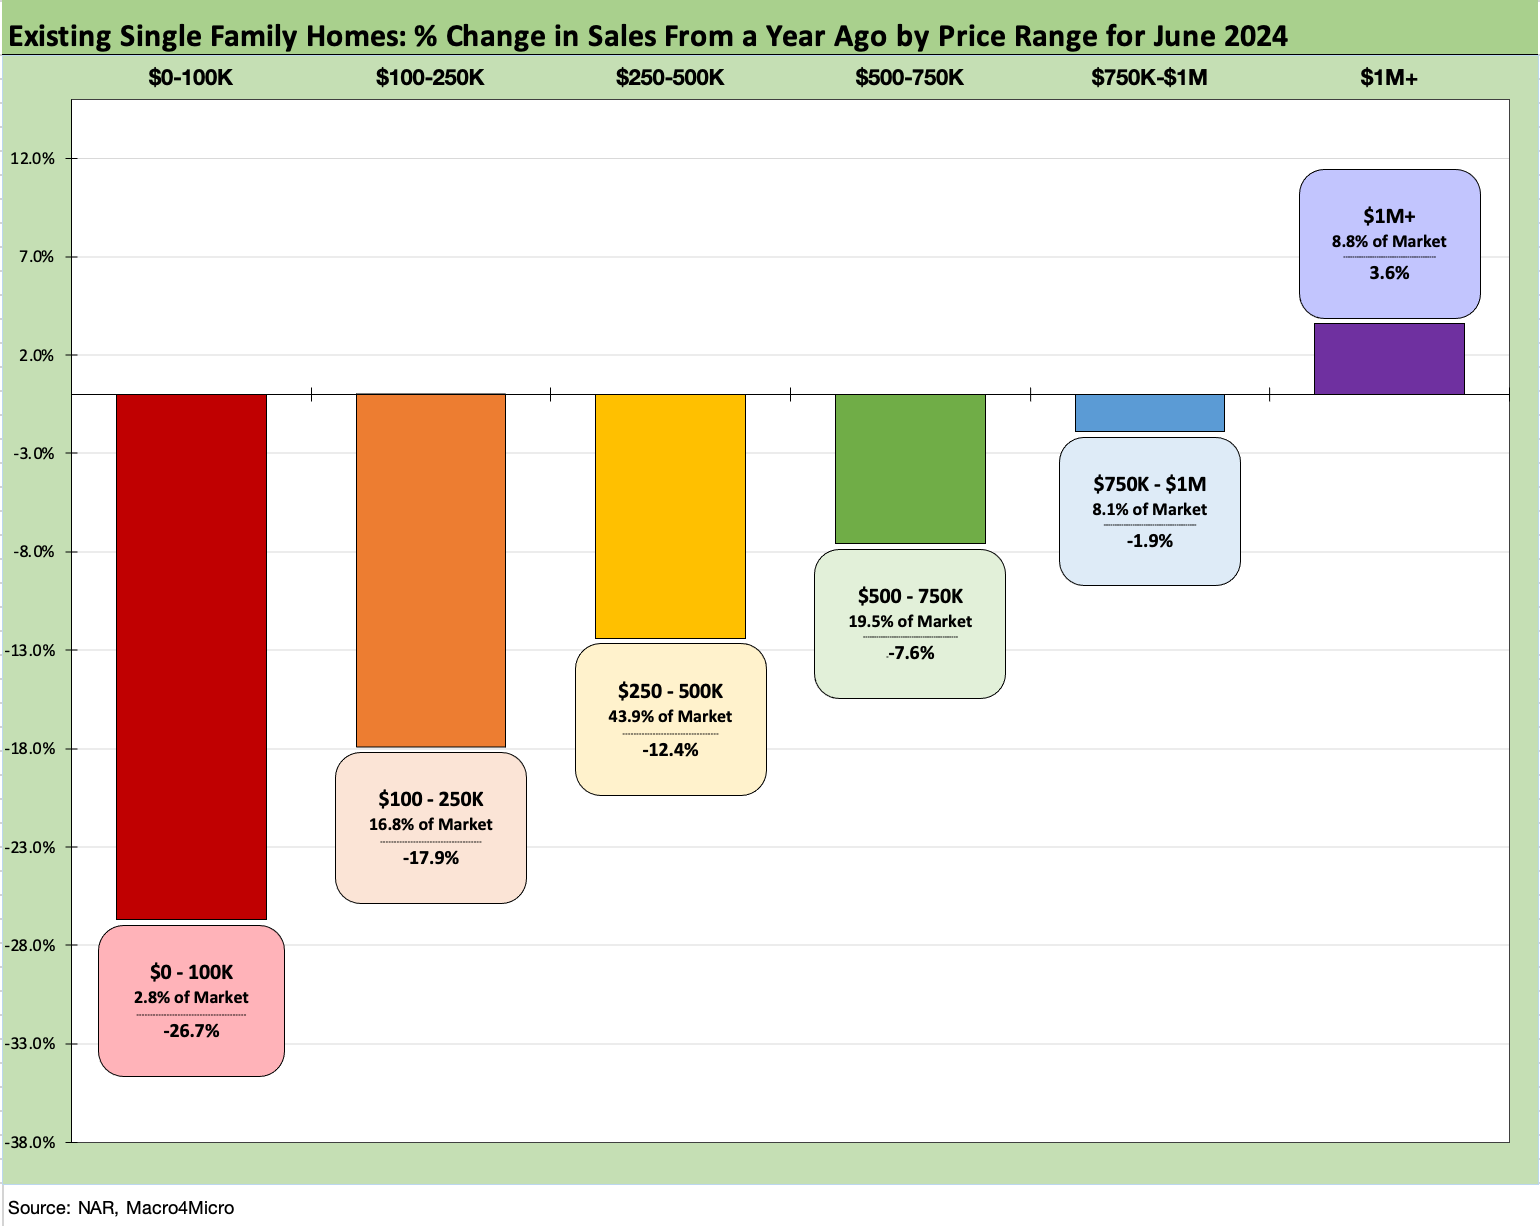
The above chart updates the running sales % deltas for the different price tiers. We see only the $1+ million bucket higher with the rest negative. The chart also breaks out the share of the market held by that price tier.
The lion’s share of the lineup is in the $250K to $500K range and that is down -12.4%. Last month only the two lowest price tiers were down. The solid performance of the high price builders also reaffirms the easier life for those who can pay cash or easily refinance later after a high down payment (see Toll Brothers: A Rising Tide Lifts Big Boats 5-23-24).
See also:
Footnotes & Flashbacks: Credit Markets 7-22-24
Footnotes & Flashbacks: State of Yields 7-21-24
Footnotes & Flashbacks: Asset Returns 7-20-24
Housing Starts June 2024: Still All About the Deliveries 7-17-24
Homebuilder Equities: “Morning After” on Rate Optimism 7-12-24
Homebuilders: Equity Performance and Size Rankings 7-11-24
Credit Crib Note: KB Home 7-9-24
New Home Sales: Pumping the Brakes 6-26-24
Lennar: Key Metrics Still Tell a Positive Macro Story 6-20-24
Credit Crib Note: NVR, Inc. 5-28-24
New Home Sales April 2024: Spring Not Springing Enough 5-23-24
Toll Brothers: A Rising Tide Lifts Big Boats 5-23-24
Credit Crib Note: Taylor Morrison 5-20-24