
PCE July 2024: Inflation, Income and Outlays
Uneventful PCE price trends hold steady as consumption leaves the soft landing theme intact ahead of upcoming FOMC actions.


At least until Tuesday…
Sideways YoY PCE price trends in the mid-2% range, and MoM PCE that was flat at the core level while posting a slight uptick at the headline level, sends the markets into Labor Day weekend on a serene note.
While payroll numbers started off August with a VIX bang, we believe it would require a cyclical gut punch on jobs to get the FOMC into -50 bps mode in the mid-Sept meeting that will also bring a new dot plot.
The consumer is still the key driver with PCE outpacing DPI again and the savings rate down to 2.9% in July. That comes after a heavier mix of negative revisions on the domestic investment lines we saw this week on the 2nd estimate for 2Q24 GDP (see 2Q24 GDP 2nd Estimate: The Power of 3 and Cutting 8-29-24).
As the “Who caused inflation?” rhetoric picks up in election season around a topic that is far more complicated and multi-tiered than the Washington types are inclined to admit, we drop in some charts on the DPI vs. PCE monthly trends.
The DPI vs. PCE charts offer a reminder of the stimulus/relief disbursements with Trump’s signature on 2 of the 3, including one in Dec 2020 (Jan 2021 checks) and Biden’s signature on the last of 3 packages for the March 2021 checks.
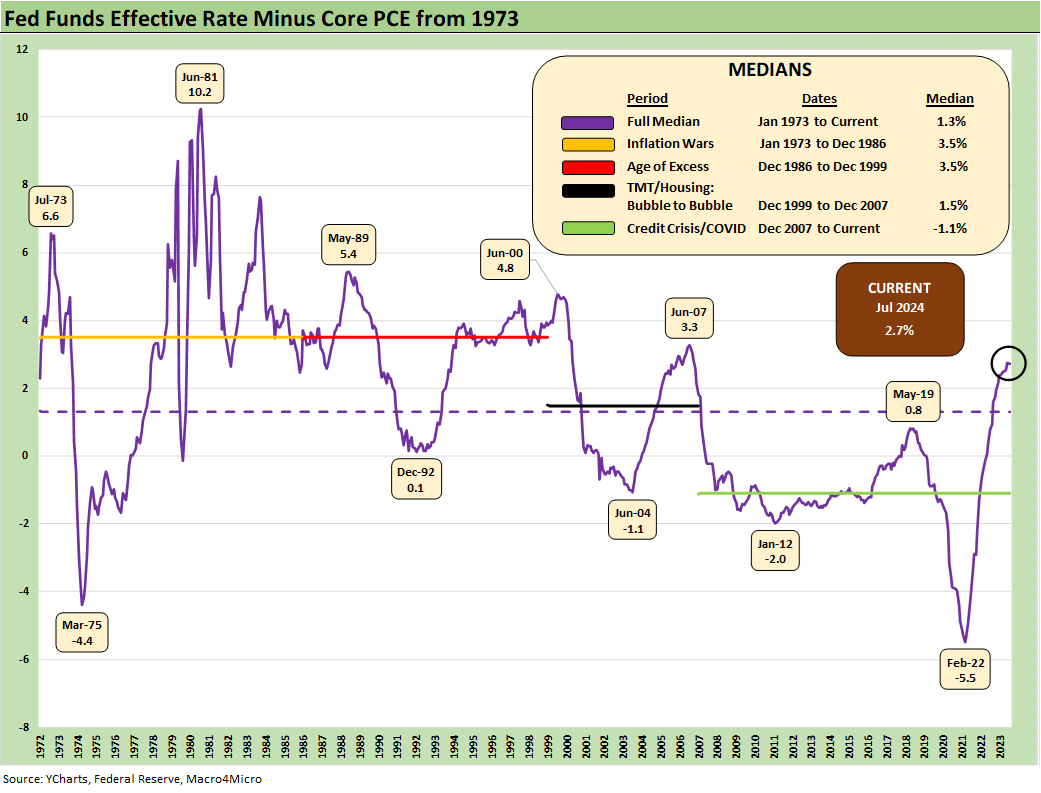
With the FOMC set to ease at the mid-Sept meeting, we find the “fed funds minus Core PCE” relationship useful in framing real fed fund rates and relative tightening profile across history. The relationship between fed funds and Core PCE right now is +2.7 bps after starting out in 2022 with fed funds well short of inflation for a protracted period.
In other words, the tightening in late 2022 was in substance “accommodation” with many investors still screaming for a pause even then (see Fed Funds vs. PCE Price Index: What is Normal? 10-31-22, Fed Funds vs CPI: Narrowing of the Gap12-14-22). That changed with the Fed’s steady tightening and inflation peaking in mid-2022 as low unemployment rates and steady PCE resilience in the GDP numbers kept recession risk at bay.
The +2.7 points of real fed funds in place now is framed against a long-term median (from Jan 1973) of +1.3%. That leaves a lot of room for the FOMC to maneuver relative to current inflation rates. In theory, a steady series of easing during the fall is quite doable unless the inflation story faces a setback. By Nov, the election will be over and there will be a new wave of inflation debates on tariff impacts and what the “winner” will do.
If Trump wins, there will most certainly be a battle over FOMC control (firing Powell etc.) but that is for 2025 outlook discussions. If Harris wins (and after the authorities pacify the ensuing redneck riots in Washington), there also could be some political issues around the FOMC and rates.
Generally, the Harris team has been quiet on that front other than a few progressive Powell bashers (notably Senator Warren). Unsurprisingly, the general view of progressives is that rates are too high. Short rates are in fact too high, but further out the UST curve actually post some of the lowest rates in the modern capital markets era outside the ZIRP and normalization periods (see Footnotes & Flashbacks: State of Yields 8-25-24).
We will also need to watch the pressures on the FOMC as the Harris housing plans sees more specifics (see Harris Housing Plan: The South’s Gonna Do It Again!? 8-28-24). The yield curve remains the dominant driver of housing affordability.

The above chart runs across the history of headline PCE inflation (+2.5% for July 2024) and Core PCE inflation (+2.6% for July 2024). We also include a memory jogger of events across the timeline from the Arab Oil Embargo through the 2022-2024 chaos of post-COVID inflation and into the Russia-Ukraine mess and tightening cycle.
The long-term median from 1972 is +2.6% for PCE and +2.4% for Core PCE. That means that PCE inflation numbers are now around that long term median which include the pain of the 1970s inflation spike and double-dip stagflation and recessions of 1980-1982.

The shorter time horizon above runs from 1997 to 2024. We start the time series as the TMT bubble was just taking off, and we see the median PCE and Core PCE below the 2.0% line. That period saw inflation pushed lower by the systemic credit meltdown that spiked in Sept 2008 with the recession starting date later determined as Dec 2007.
The 18-month downturn ending June 2009 ranks as the longest since the Great Depression. That PCE level over such a brutal backdrop implies that getting to 2.0% PCE is more aspirational than achievable and a pipe dream for Core without a deep recession. Oil can always collapse and help headline PCE, but the history of food inflation is that it almost never deflates.

The above chart plots the Headline PCE inflation vs. Core PCE differential as Food and Energy swing around. Headline and Core PCE have converged as food and energy inflation declined across time (see CPI July 2024: The Fall Campaign Begins 8-14-24). The long-term median is zero.
As we have covered in our CPI work, energy can move dramatically higher and lower with inflation spikes and deflation plunges. Food can be volatile in some narrow product groups like any commodity, but history shows the menu tends to go one way (higher) with declining food inflation not actually deflating back to where you started (see Inflation Timelines: Cyclical Histories, Key CPI Buckets 11-21-23). To the extent the Harris team want to talk a lot about price-gouging, that is a political posture play. If they think that can translate into viable policy after an election, they will fail. That is a topic for another day.
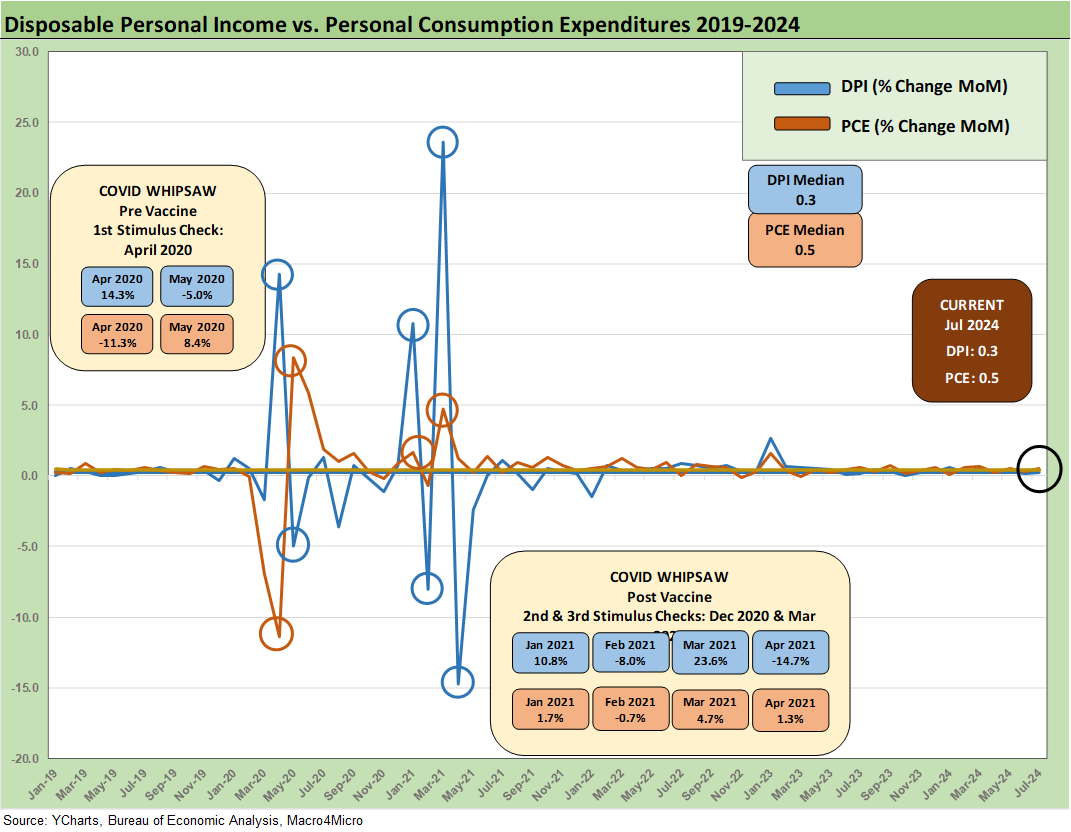
The above chart looks at the path of DPI vs. PCE across the period from 2019, before COVID, on across the COVID crisis (and 2-month recession), the waves of stimulus and relief, the inflation spike, the tightening cycle, and now into what is shaping up as a soft landing (so far). The economic resilience has been driven by the steady consumer sector after a robust period of investment that we detail in our GDP analysis (see 2Q24 GDP 2nd Estimate: The Power of 3 and Cutting 8-29-24, GDP 2Q24: Banking a Strong Quarter for Election Season 7-25-24, 2Q24 GDP: Into the Investment Weeds 7-25-24).
In the next chart, we narrow the timeline to exclude the wild DPI swings associated with the three COVID relief and stimulus packages including two under Trump and one under Biden. The Trump signature was on the CARES Act (March 2020, shows up in the DPI in April 2020) and his signature was on the Dec 2020 legislation disbursed in Jan 2021 (he never seems to mention that one!). Biden’s signature was on the America Rescue Plan that was disbursed in March 2021. As a reminder, the vaccine was just becoming available on a wide scale, and 2021 also had a deadly strain before a less threatening series of COVID waves later.
These stimulus topics will come up since the partisan pitch is that only the third of the three is the cause of all problems (of course, not the Dec 2020 legislation disbursed in Jan 2021). Anything that stimulates demand when the supply side is impaired is a cause of inflation. The Fed accommodation made spending at the corporate level and household ability to borrow and spend (mortgage refi boom) cheaper. That adds to the problem.
The fact that global shipping companies saw their cyclical peak profits rise around 20-fold from prior cycles told a story of what costs needed to be passed along. That freight challenge continued from the port to the truck/rail to the warehouse and labor that was touching each stop along the way.
Lingering tariffs – brought to you by Trump and continued by Biden – piled on. Putin’s war in Ukraine added a raft of inflationary factors from headline inflation (energy, grain, etc.) to core. The use of sanctions are not on the short list of good ideas for easing global supply challenges. The list goes on…
Anyone who offers you a simple explanation of inflation is a partisan, a salesman, a liar, is economically ignorant, or is an “economically ignorant, partisan liar trying to sell you something.” Sometimes they just call them politicians. Of course, the world does not have Walter Cronkite or Huntley and Brinkley and such types to turn to in the new age of media.
The new breed of media types don’t do the digging and don’t spend the time trying to clarify complexities. They are about ratings, makeup, and wardrobe and are often partisan. CNBC is an exception since they actually frame and debate the topics and have experts (with varying degrees of expertise) to do battle on causes and effects of inflation.

The above chart shortens up the timeline to remove the 2020-2021 distortions and just looks at the tightening cycle from early 2022 through current times. The biggest distortion was to start 2023, but the scale is much smaller. We look at each month for DPI and PCE in the next chart. PCE has generally shown impressive endurance.
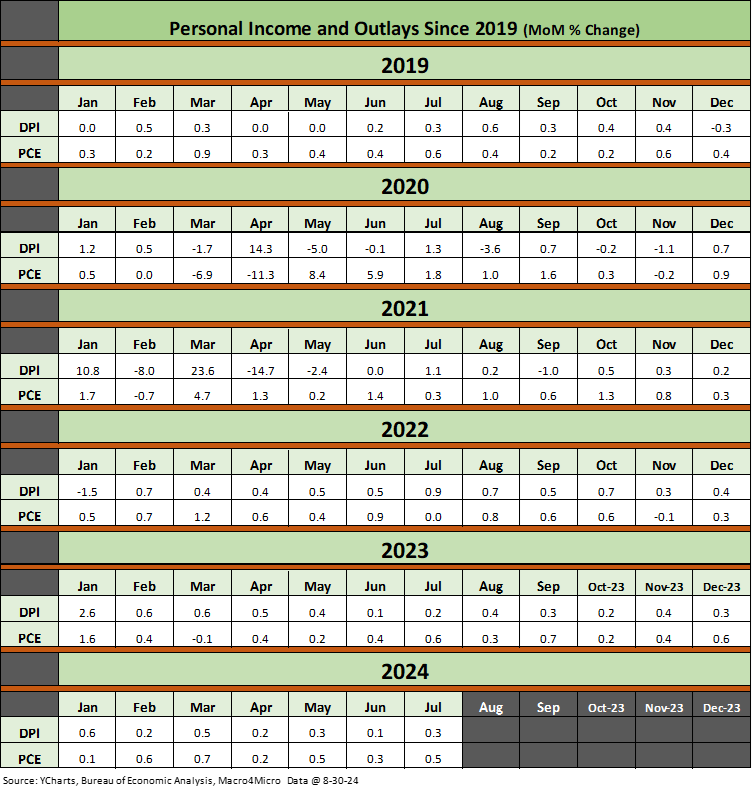
The above chart looks back across the years and months for MoM % trends in Disposable Personal Income vs. Personal Consumption Expenditures. The recent trends show PCE generally outpacing DPI in 2024 with a notable exception in Jan 2024. That bodes well for GDP resilience but not for the 2.0% PCE price index line.
Consumption is demand, and something would need to give on employment. Even rising defaults and delinquencies will only dent PCE to a certain extent. That is where the post-election tariff battles, retaliation, and trade wars will come into play and what that could potentially mean for markets.
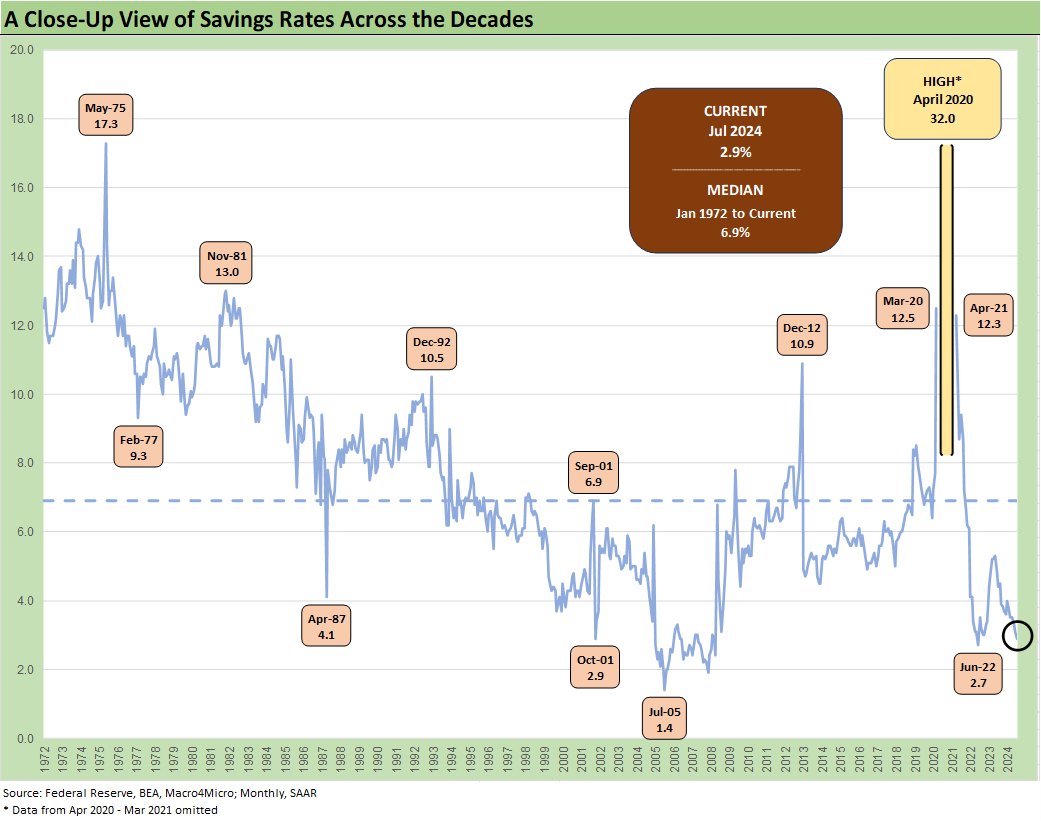
The above time series looks at saving rates as updated in the PCE release. The history of the US consumer has led to phrases such as “never bet against the US consumer” with the July dip below a 3.0% savings rate offering a reminder.
We have looked at this history in prior commentaries (see Savings Rates: Context Across the Cycles 10-27-23), and the focus on asset quality each quarter looks to be a recurring activity in the fall given the lofty credit card activity and outstanding balances on the way into holiday season. The 2.9% saving rate is off the low tick of mid-2022 but in line with 2001 lows. The bar for excess is still set back in the housing bubble and excess of 2005 at +1.4% in July 2005. The long-term median of almost 7% is on a different planet than current levels.
See also:
2Q24 GDP 2nd Estimate: The Power of 3 and Cutting 8-29-24
Harris Housing Plan: The South’s Gonna Do It Again!? 8-28-24
Durable Goods Jul24: Transport U-Turn 8-26-24
New Home Sales July 2024: To Get by with a Little Help from My Feds? 8-25-24
Footnotes & Flashbacks: Asset Returns 8-25-24
Footnotes & Flashbacks: State of Yields 8-25-24
Existing Home Sales July 2024: Making a Move? 8-23-24
Payroll: A Little Context Music 8-22-24
All the President’s Stocks 8-21-24
Housing Starts July 2024: The Working Capital “Prevent Defense” 8-16-24
Total Return Quilt: Annual Lookback to 2008 8-14-24
CPI July 2024: The Fall Campaign Begins 8-14-24
HY Industry Mix: Damage Report 8-7-24
Volatility and the VIX Vapors: A Lookback from 1997 8-6-24
HY Pain: A 2018 Lookback to Ponder 8-3-24
Payroll July 2024: Ready, Set, Don’t Panic 8-2-24
Employment Cost Index: June 2024 8-1-24
Presidential GDP Dance Off: Clinton vs. Trump 7-27-24
Presidential GDP Dance Off: Reagan vs. Trump 7-27-24
PCE June 2024: Inflation, Income, and Outlays 7-26-24
2Q24 GDP: Into the Investment Weeds 7-25-24
GDP 2Q24: Banking a Strong Quarter for Election Season 7-25-24
Inflation Timelines: Cyclical Histories, Key CPI Buckets 11-21-23
Savings Rates: Context Across the Cycles 10-27-23
Inflation Rorschach Test: Looking at Relief and Stimulus 2-28-23