Existing Home Sales July 2024: Making a Move?
Existing home sales volume and inventory print a sequential uptick but with prices slightly lower.
Existing home sales rebound picking up speed…
Existing home sales volumes ticked slightly higher by +1.3% to 3.95 million for the first rise in four months while declining by -2.5% YoY.
Existing home sales prices ticked lower sequentially (to $422.6K from $426.9K) while prices were higher YoY at +4.2%.
The “single family only” subset (ex- condos/co-ops) posted higher volumes sequentially (+1.4%) but were down YoY (-1.4%) with prices down sequentially ($428.5K) but up +4.2% YoY from $411.2K.
We saw 4 of 6 price tiers climb in volumes this month with the relative increase for each tier rising incrementally more in the higher price tiers with double-digit increases for the three tiers above $500K.
The above chart updates the running monthly sales % deltas for the different price tiers from early 2023. The chart also breaks out the share of the July market held by that price tier in the box (Note: we revisit the stats in the last chart of this commentary). We detail the highs and lows of the YoY deltas as well. The worst beatings YoY were generally in the spring of 2023 when framing against the period when tightening was just getting started.
The lion’s share of the sales volume is in the $250K to $500K range with almost 45% of sales. The $500K to $750K share is over 19% with the $100K to $250K brackets another 17% share of the sales volumes. Those three price tiers are over 80% of total volume.
The July existing home sales volume posted a marked shift from last month with 4 of the 6 price tiers positive this month after only the million-dollar bucket was positive last month by +3.6%.
The existing home sales inventory climbed slightly to 1.33 million units as the peak selling season winds down. Some improvement in the mortgage backdrop has not done much to break the “locked-in effect” and free up materially higher volumes.
Total existing inventory reached 4.0 months at current selling rates, which is the second month in a row at 4.0 months or higher supply with mostly 3 handles (and a few 2 handles) over the past year and for the calendar years 2021 to 2023. “Single family only” inventory weighed in at 3.9 months in July, down from 4.0 months in June but up from 2.8 months in Feb and 3.0 in March.
The above two-sided chart updates the pattern of sales volumes for total existing home sales (“EHS”) vs. new single family home sales. The EHS weighed in 3.95 million for July after 3.90 for June 2024 while new single family sales for June was a very slow 617K (see New Homes Sales June 2024: Half Time? Waiting for Mortgage Trends 7-24-24). We will get the updated new single family numbers for July 2024 tomorrow.
The above chart breaks out the timeline for single family alone of 3.57 million vs. total existing home sales of 3.95 million, which is well below the long-term median (from Jan 1999) of 5.25 million for total existing homes.
The lower line is ex-condo/ex-co-ops. Total single family ex-condos/co-ops rose sequentially to 3.57 million in July from 3.52 million in June. We saw 380K in condos and co-ops in July, flat to 380K in June 2024.
The above chart gives a simple visual on the timeline for median single family home prices over the past few months that reached record highs of $432.9K in June before a small sequential downtick in July to $428.5K. Slightly rising inventory levels strangely enough are also part of the trends along with higher prices vs. the early spring and fall season although July had a small price dip sequentially. Single family on a YoY basis was +4.2% YoY.
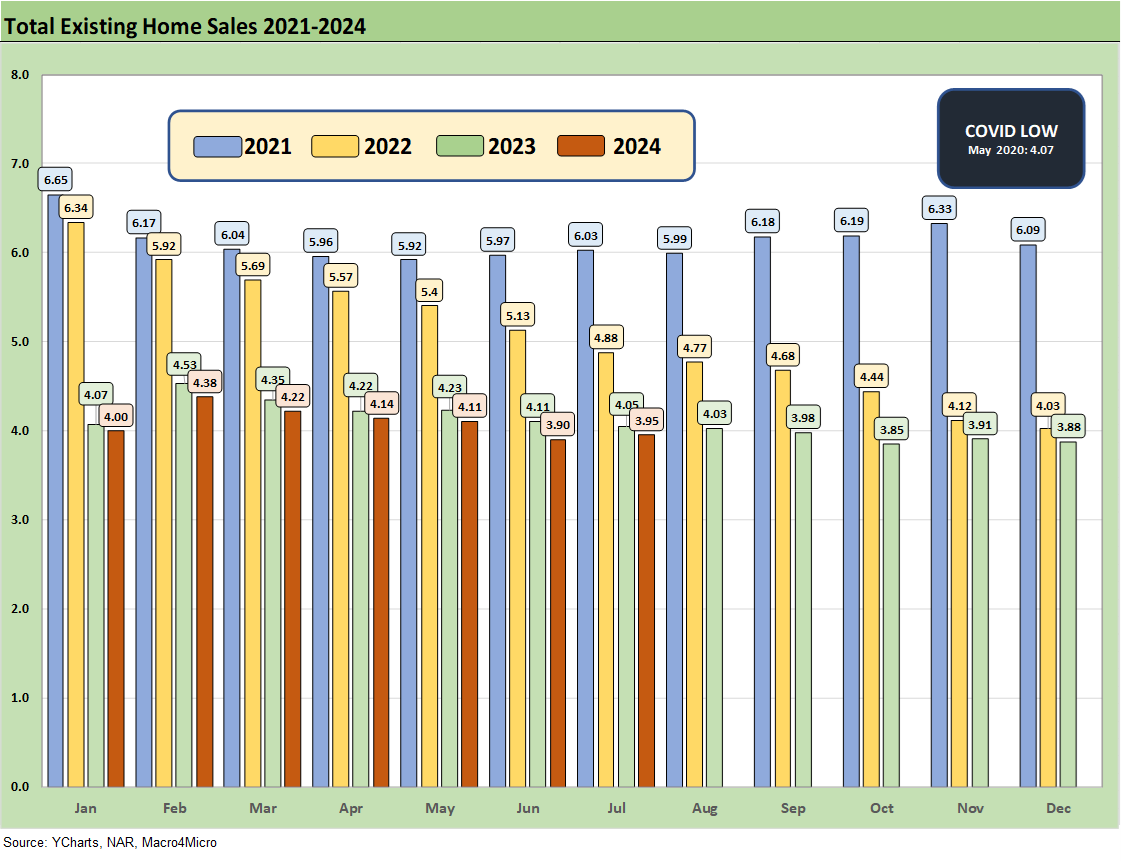
The above chart updates the monthly existing home sales across the timeline from Jan 2021 through July 2024. The market is a long way from the 6 million and high 5 million handles of 2021 and then into early 2022 when many homeowners refinanced, and new buyers locked in low mortgages. ZIRP ended in March 2022 and then the UST migration began.
The July 2024 total of 3.95 million is below the May 2020 COVID trough of 4.07 although we had a few more sub-4 million handles along the way as noted in the chart.
We wrap the sales trends for the various price brackets we track. We see 4 of the 6 higher with each higher price from $250 to $500K to $1 million moving higher along the way. The two lowest price tiers declined with $100K to $250K only slightly.
See also:
Payroll: A Little Context Music 8-22-24
All the President’s Stocks 8-21-24
Footnotes & Flashbacks: Credit Markets 8-19-24
Footnotes & Flashbacks: State of Yields 8-18-24
Footnotes & Flashbacks: Asset Returns 8-17-24
Retail Sales: Third Wind? 8-15-24
Industrial Production: Capacity Utilization Trends 8-15-24
Total Return Quilt: Annual Lookback to 2008 8-14-24
CPI July 2024: The Fall Campaign Begins 8-14-24
HY Industry Mix: Damage Report 8-7-24
Volatility and the VIX Vapors: A Lookback from 1997 8-6-24
Housing and Homebuilders:
Credit Crib Note: PulteGroup (PHM) 8-11-24
Credit Crib Note: D.R. Horton (DHI) 8-8-24
New Homes Sales June 2024: Half Time? Waiting for Mortgage Trends 7-24-24
Existing Home Sales June 2024: Supply Up, Prices Up, Volumes Down 7-23-24
Housing Starts June 2024: Still All About the Deliveries 7-17-24
Homebuilder Equities: “Morning After” on Rate Optimism 7-12-24
Homebuilders: Equity Performance and Size Rankings 7-11-24
Credit Crib Note: KB Home 7-9-24
Lennar: Key Metrics Still Tell a Positive Macro Story 6-20-24
Credit Crib Note: NVR, Inc. 5-28-24


