
Housing Starts July 2024: The Working Capital “Prevent Defense”
Another weak month for home starts as the builders closely monitor starts vs. deliveries cadence and sell down inventory.


We update the comparative equity returns for the homebuilder peer group of 14 builders we monitor as home starts shifted lower.
Builders are keeping to their working capital discipline while selling down inventory and are prudent in their balance of deliveries and starts. New home sales data will be out at the end of next week.
The yield curve dynamics will continue to be uncertain out the curve with mortgages remaining in the 6% handle bracket (6.49% Freddie Mac 8-15-24) but with rates still facing more than a few question marks around the direction of FOMC actions (controlled by the Fed) and how that will frame up in the UST slope and the 10Y UST that drives 30Y mortgages (controlled by the market).
The housing affordability challenge will not go away even with 100 bps of lower fed funds, but it would sure help even if the questionable scenario of the 10Y UST moving lower in “basis point lockstep” is a highly unlikely scenario in the absence of severe macro pressure that would also weigh on employment and the demand side of the equation in housing.
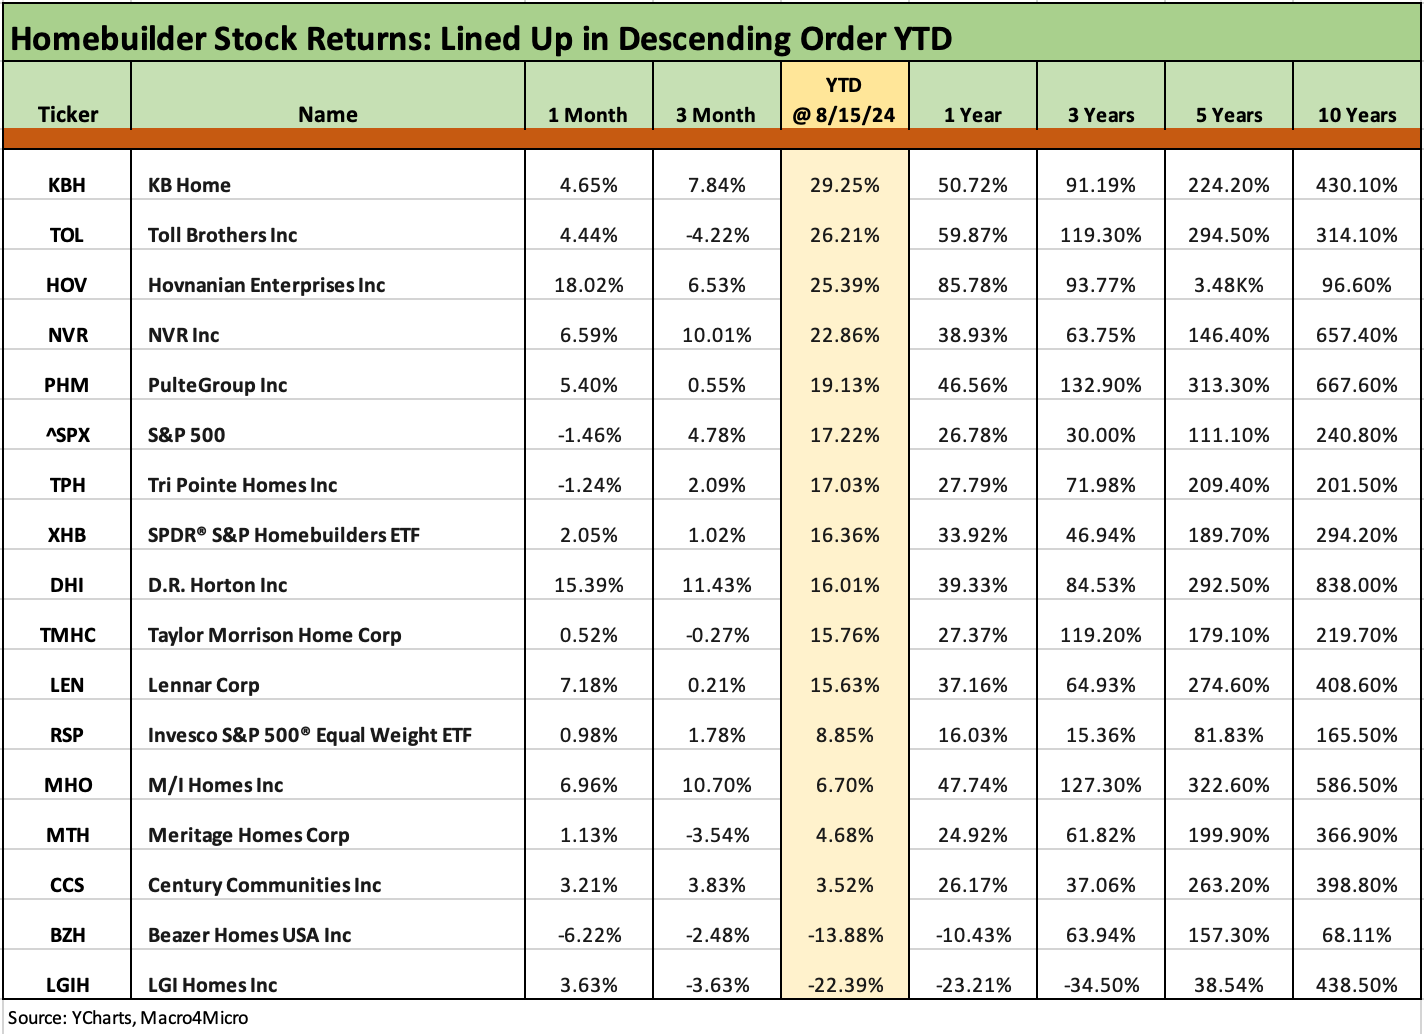
Before getting into the housing starts details for July, we first update time horizon equity returns across the major homebuilder peer group. We line up the builder and benchmark returns in descending order of YTD total return.
In our last update in the June 2024 starts commentary (see Housing Starts June 2024: Still All About the Deliveries 7-17-24), we saw a very good rally month for homebuilders. That was before the early August noise around jobs and the consumer sector that brought a rougher start this month. That said, the Homebuilder ETF (XHB) still outperformed the S&P 500 and Equal Weight S&P 500 ETF (RSP) over the choppy rolling 1-month period as did a significant majority of the 14 major public builders detailed above.
We use the phrase “prevent defense” in the title of this commentary since a lot can happen beyond this peak selling season between now and next spring. The housing sector and the direction of economic policies are entering into a period of considerable uncertainty across the Fed on the monetary side. On the fundamental side, the handicapping of where the consumer sector will head (notably jobs and appetites for mortgages) goes under the heading of recession risk.
The markets also face the uncertainty around who will be at the helm in the White House, who will control the purse strings in the House, and how the Senate majority will operate. For Congress, that sets the stage on what legislation gets to the floor and for the Senate narrowly what the game plan is around “going nuclear” (eliminating the filibuster). Trump will insist on the nuclear option for anything he wants (majority only, no filibuster). For the Senate, McConnell was the main obstacle to Trump on that filibuster status before the former majority leader more recently became a boned fish. That keeps the range of possible outcomes even wider.
We won’t open up that Pandora’s box of policy risk in this note, but the tariffs and deficit topics allow for a lot of room on how the UST curve will shift or reshape, what canyon-esque US deficits will look like, and what record UST supply will mean for fed funds vs. the 10Y UST (and in turn 30Y mortgages).
The specter of trade wars matters to homebuilder supplier chains just as any other major industry from materials and components to appliances. The range of outcomes one can derive (or concoct) will promote homebuilder discipline across the remainder of this peak home sales season as the summer winds down and we roll into the election season.
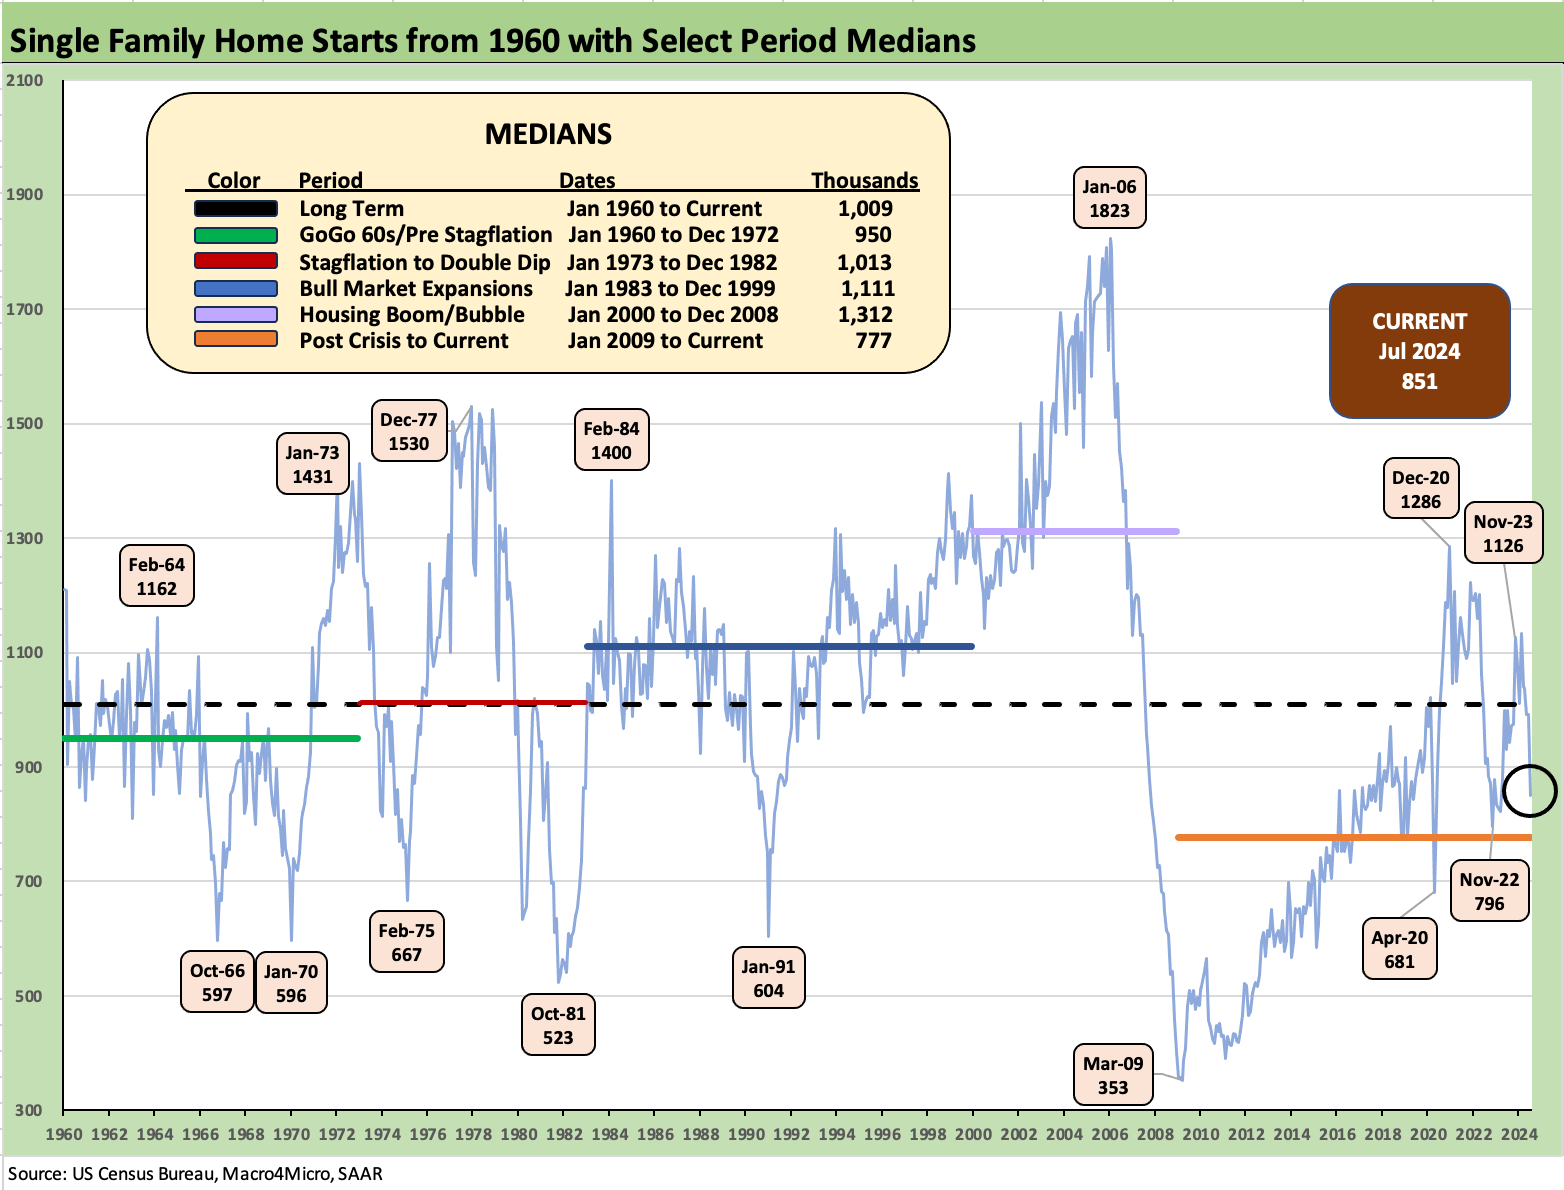
The above chart plots the long-term time series for single family home starts, and the July run rate of 851K is back below the long-term median as well as the range of other timeline medians detailed in the box with the exception of the current median that runs from the crisis of Jan 2009 through July 2024.
The month of July was driven by a -22.9% sequential decline in the South that was influenced by Hurricane Beryl that slammed the Gulf in early July. Beryl was cited by the Fed in the industrial production press release this week as well, but that move for IP was more about the Motor Vehicles line (see Industrial Production: Capacity Utilization Trends 8-15-24).
Overall single family starts were down by -14.1% sequentially and -14.8% YoY. Total starts including multifamily was down by -6.8% sequentially and -16.0% YoY as multifamily posted a positive sequential variance at +11.7% and slowed the pace of YoY weakness with a -21.8% YoY decline.
The South region comprised 54% of single family starts in July with the -22.9% MoM move (-18.4% YoY) after accounting for 60% of SAAR single family starts in June. The dip in July for the South is just one more reminder of how much the South broadly and Texas and Florida narrowly drive total housing activity.
We recently published detailed commentaries on D.R. Horton (see Credit Crib Note: D.R. Horton (DHI) 8-8-24) and PulteGroup (see Credit Crib Note: PulteGroup (PHM) 8-11-24 ), and the role played by the South in even the largest national players is an eye-opener for those who don’t watch the major homebuilders closely.
The West region at #2 with over 24% of single family starts was only down by -1.4% sequentially but was -16.8% YoY. The Midwest region at 16% of single family starts was +16.8% sequentially and +8.2% YoY. The small Northeast market at 6% of total weighed in at -27.1% sequentially in single family starts and -19.0% YoY.
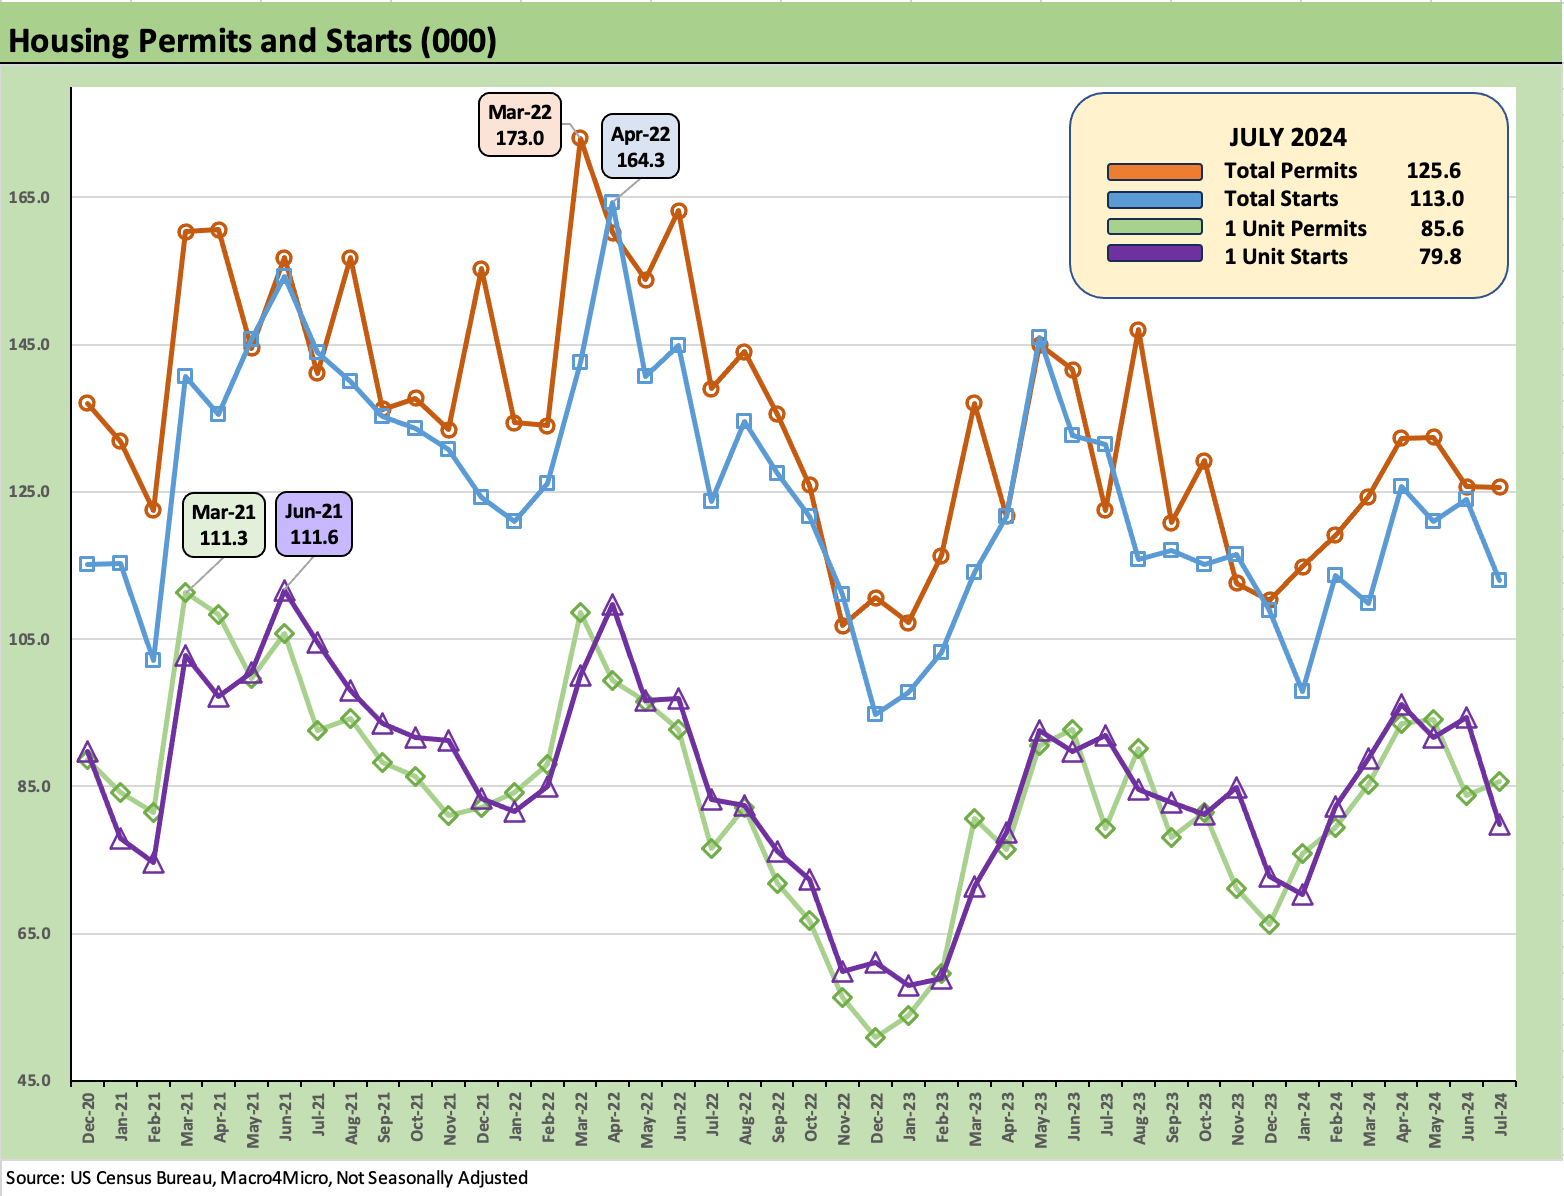
The above chart offers a national view on starts and permits in total and for single family only. We cover the regional starts moves in a separate chart but permits overall were healthier than starts with total permits at -4.0% sequentially and -7.0% YoY. Single family permits nationally were -0.1% MoM and -1.6% YoY. Those permit trends contrast with the starts news in July and highlight that the builders still see very favorable, demographically driven supply-demand dynamics over the intermediate term with the cyclical uncertainty and UST curve being the major wildcards.
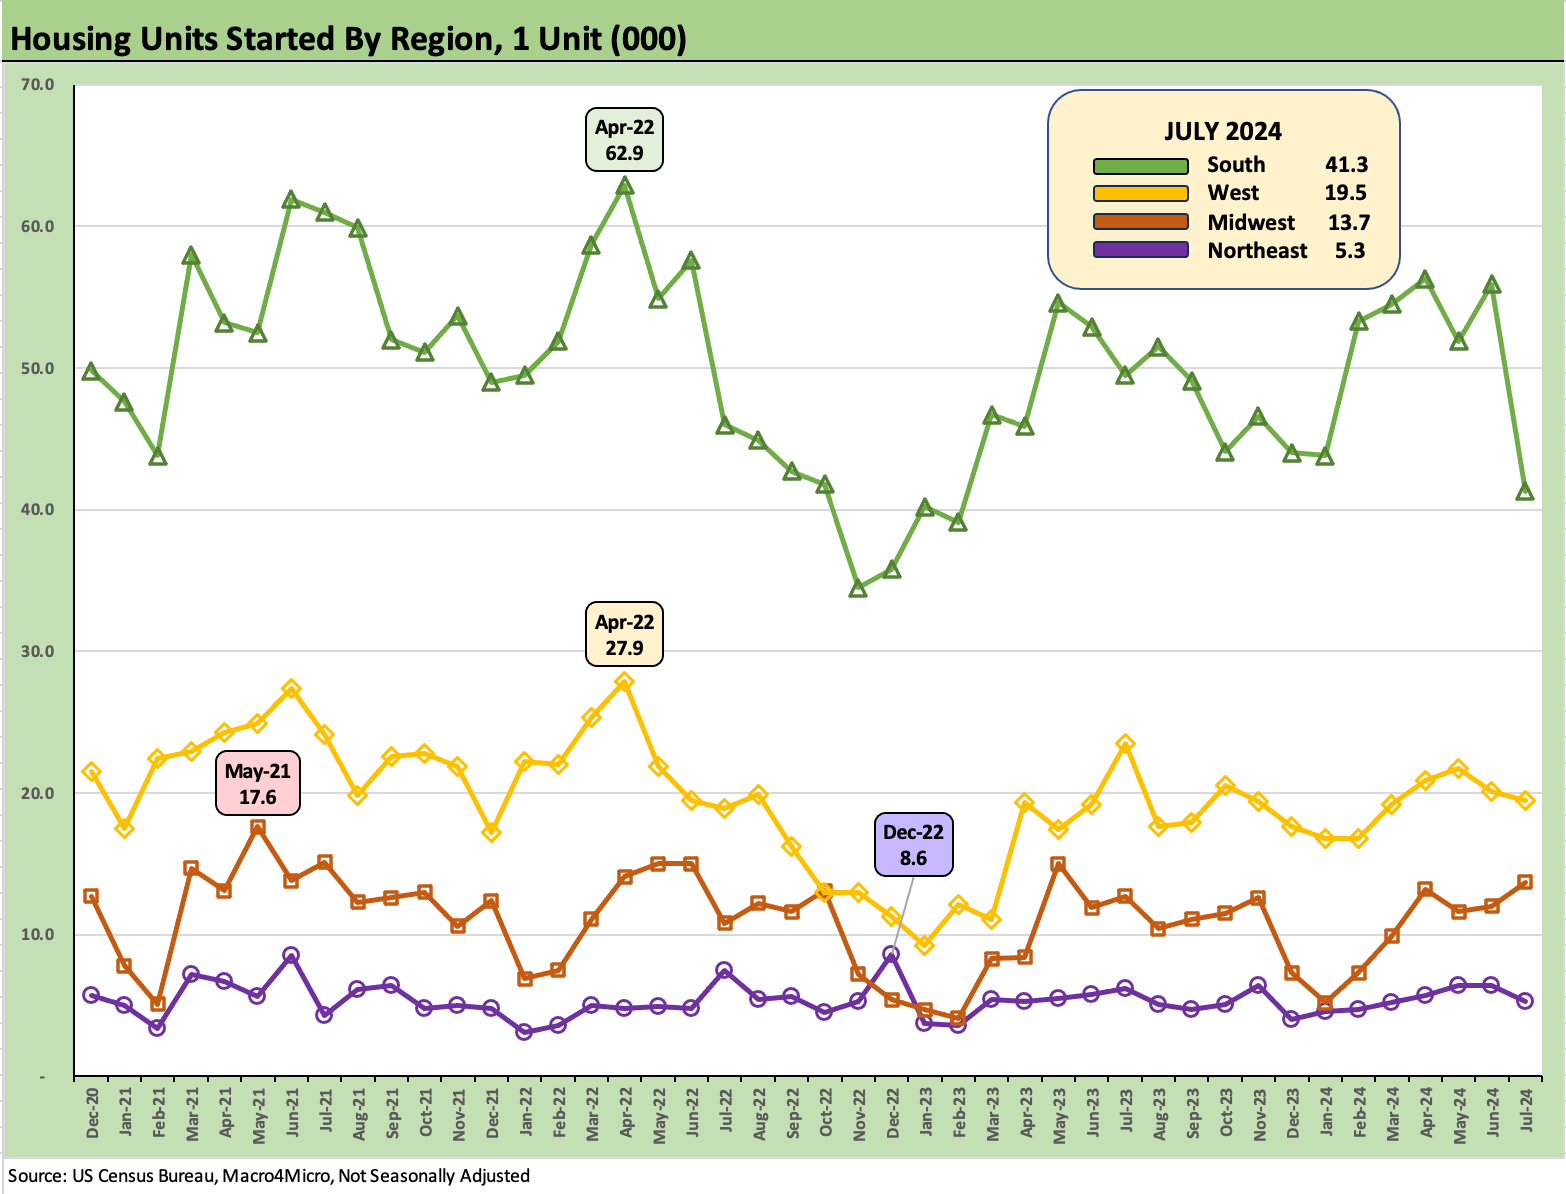
The above plots the not seasonally adjusted (NSA) single family starts by region across the period since early Jan 2021 in a “ZIRP world” with record low mortgage rate averages and high mortgage demand. The NSA version of starts gets closer to the actual activity on the ground.
The chart flags the plunge in the South with fingers pointing at Hurricane Beryl, which had been a Cat 5 hurricane on the way across the Atlantic to eventually pounding the Caribbean and then the Gulf Coast. Those effects rolled into early July, derailing a fair amount of activity as builders and the supplier chains made their plans.
For all the pressures shown in the South this month in starts, single family permits in the South were +1.6% sequentially and -2.8% YoY. The West also saw muted moves in single family permits with -1.5% MoM and -1.0% YoY. The Midwest and Northeast were also modestly lower sequentially with only the Northeast higher YoY.
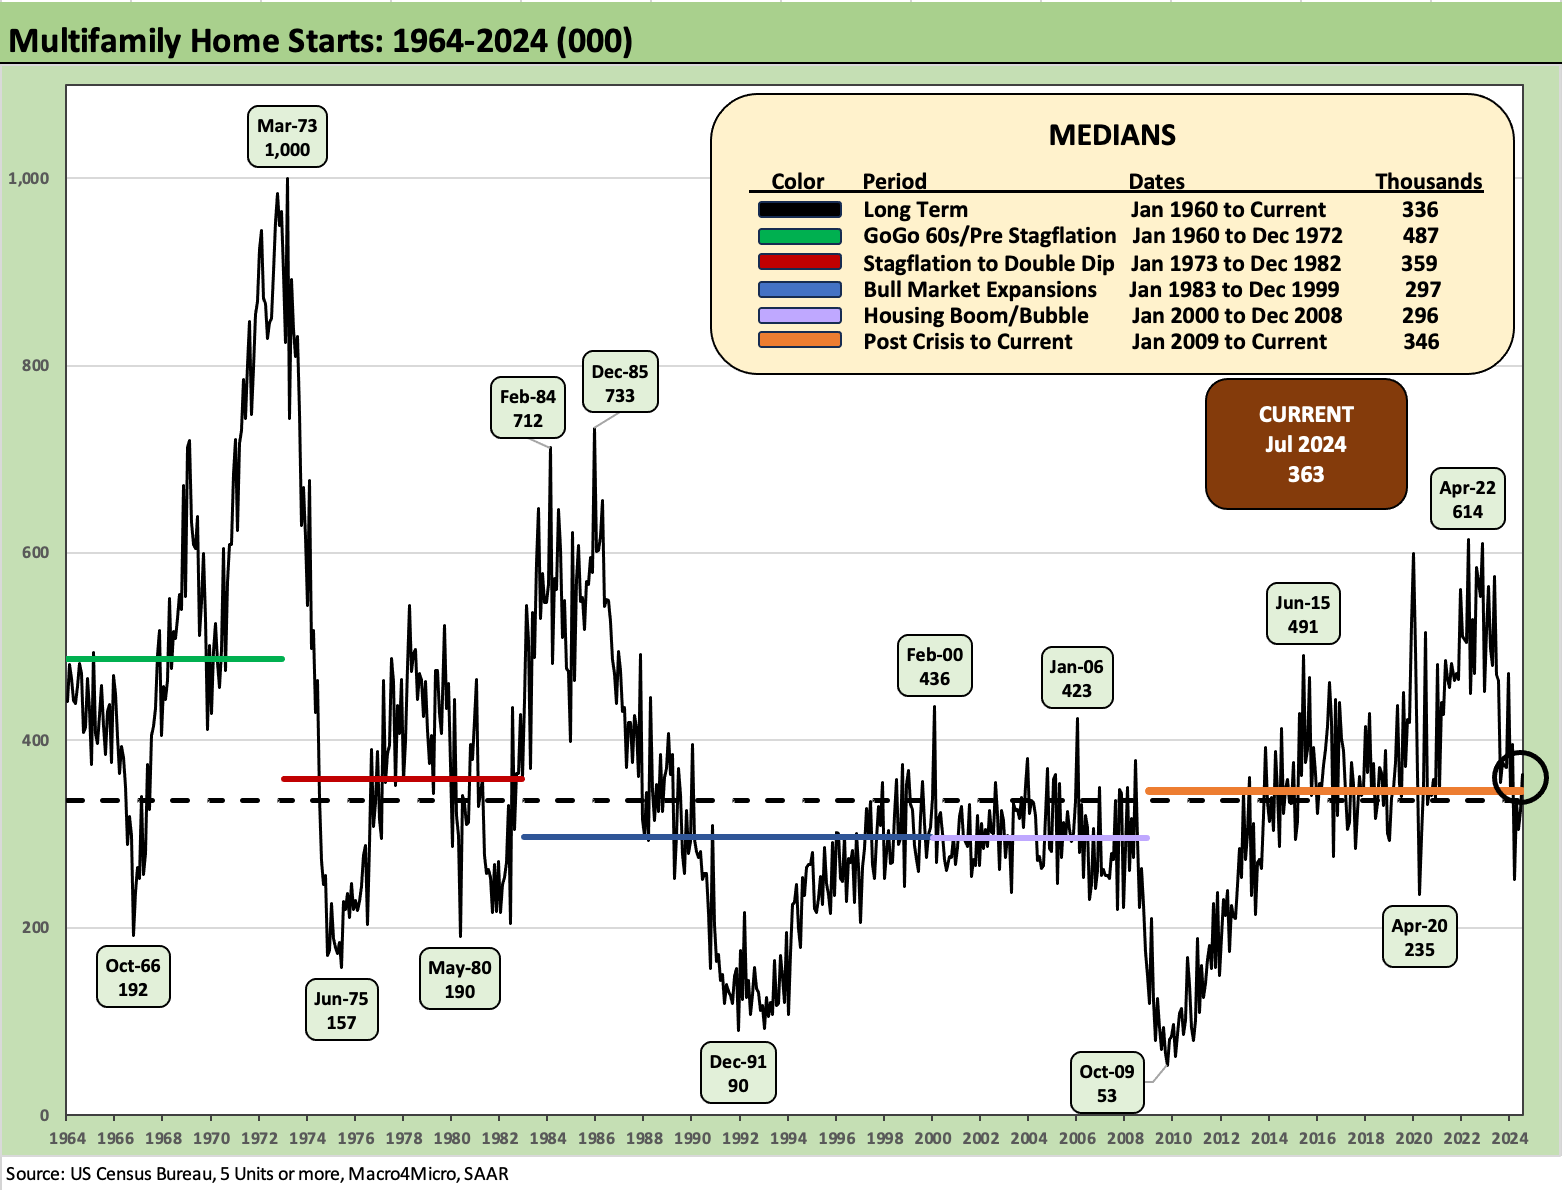
Multifamily starts rose by +11.7% MoM to 363K but were -21.8% YoY as the multifamily sector continues its fade off the April 2022 peak that came just as the Fed tightening cycle was kicking into gear. On a NSA basis, the YTD multifamily starts are down by -35.1%.
The +363K in multifamily starts for July is modestly above the long-term median of 336K but a material multiple above the lows of late 2009 at almost 7x and 1.5x the COVID low of April 2020.
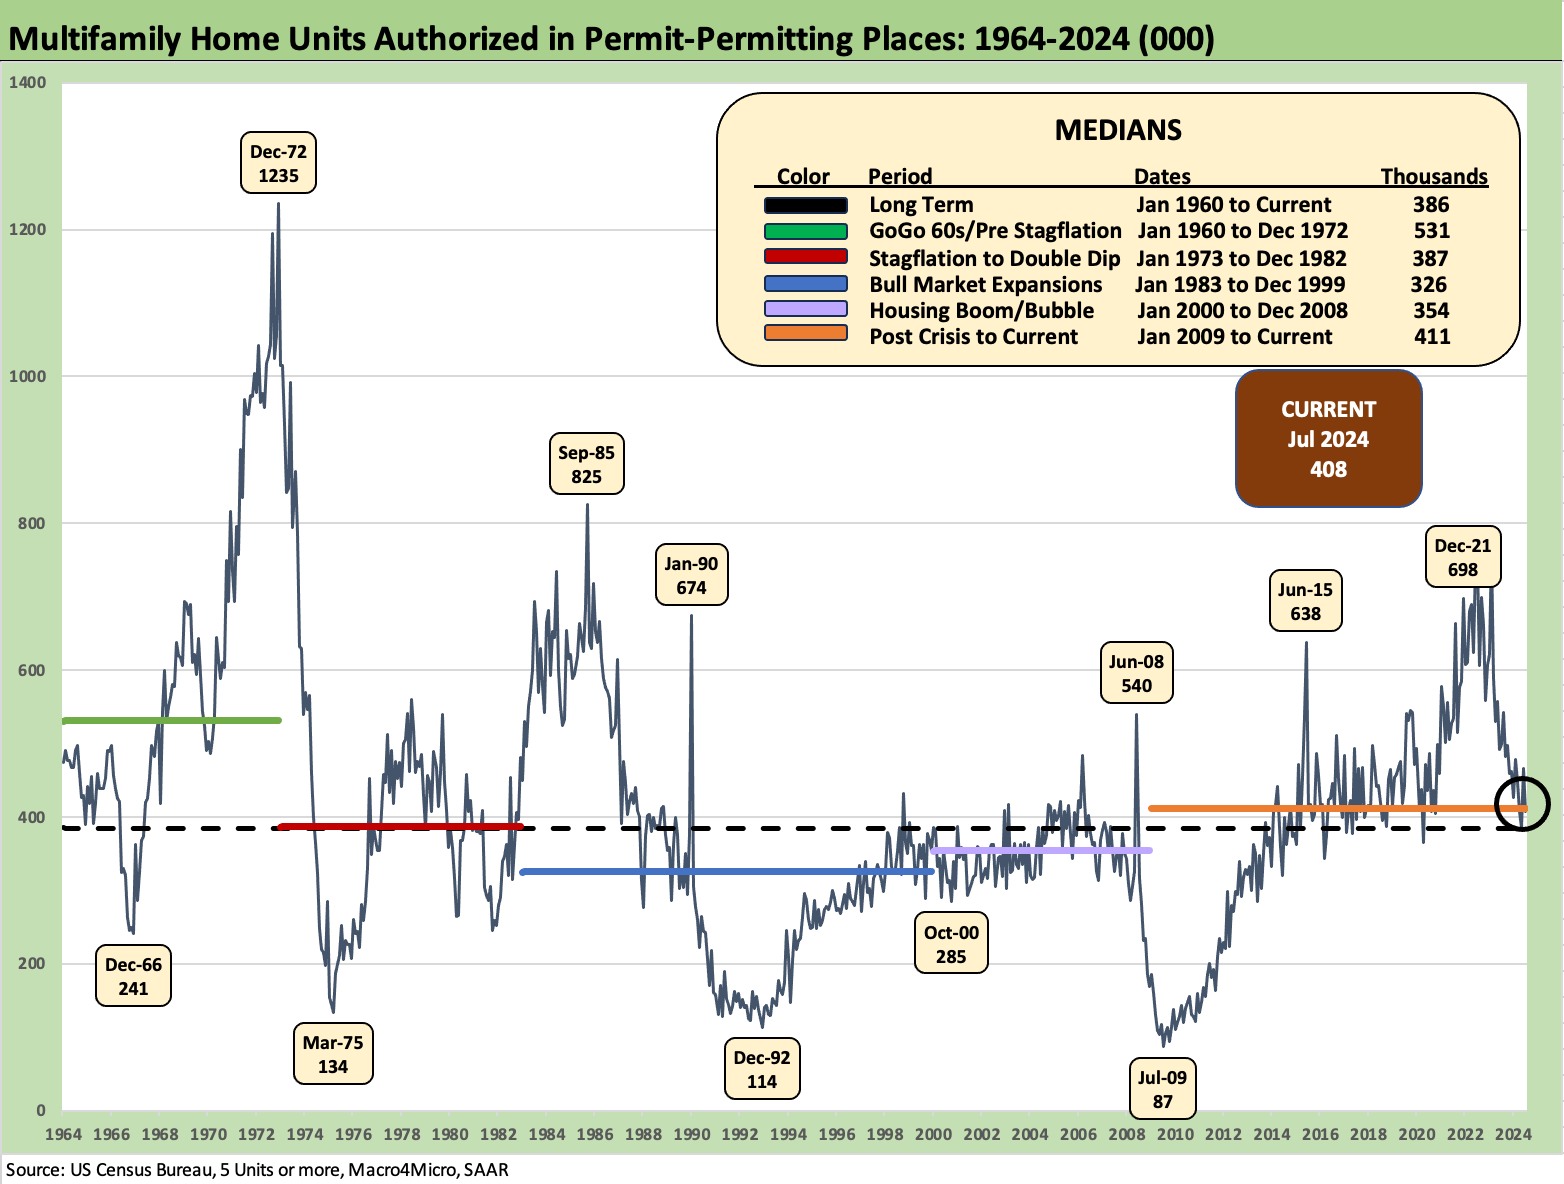
Multifamily permits show sustained weakness at -12.4% MoM to 408K and -18.2% YoY. On a NSA basis, the YTD run rate is -23.5%.
See also:
Credit Crib Note: PulteGroup (PHM) 8-11-24
Credit Crib Note: D.R. Horton (DHI) 8-8-24
New Homes Sales June 2024: Half Time? Waiting for Mortgage Trends 7-24-24
Existing Home Sales June 2024: Supply Up, Prices Up, Volumes Down 7-23-24
Housing Starts June 2024: Still All About the Deliveries 7-17-24
Homebuilder Equities: “Morning After” on Rate Optimism 7-12-24
Homebuilders: Equity Performance and Size Rankings 7-11-24
Credit Crib Note: KB Home 7-9-24
Lennar: Key Metrics Still Tell a Positive Macro Story 6-20-24
Credit Crib Note: NVR, Inc. 5-28-24