
Housing Starts June 2024: Still All About the Deliveries
June saw another slow month for housing starts, but the numbers predate the July chaos and excitement around CPI and FOMC easing handicapping.


Maybe? "Will FOMC give new directions?"
Home starts for June remain caught up in the broader theme of builders prudently managing their working capital across peak selling season and watching their cadence of starts vs. deliveries and the status of their spec inventory.
The debate has changed since these June starts numbers with the CPI excitement and FOMC expectations of multiple cuts starting in Sept.
The transmission mechanism to more affordable monthly mortgage payments and how builder pricing strategies and sales incentives (fees, mortgage buydowns, etc.) will trend still runs through longer dated UST (notably 10Y UST) and not fed funds (even if the FOMC starts the ball rolling).
We update the running stock returns for the sustained wild rally in homebuilder equities since the CPI release as this week stays the course in the impressive builder rebound.
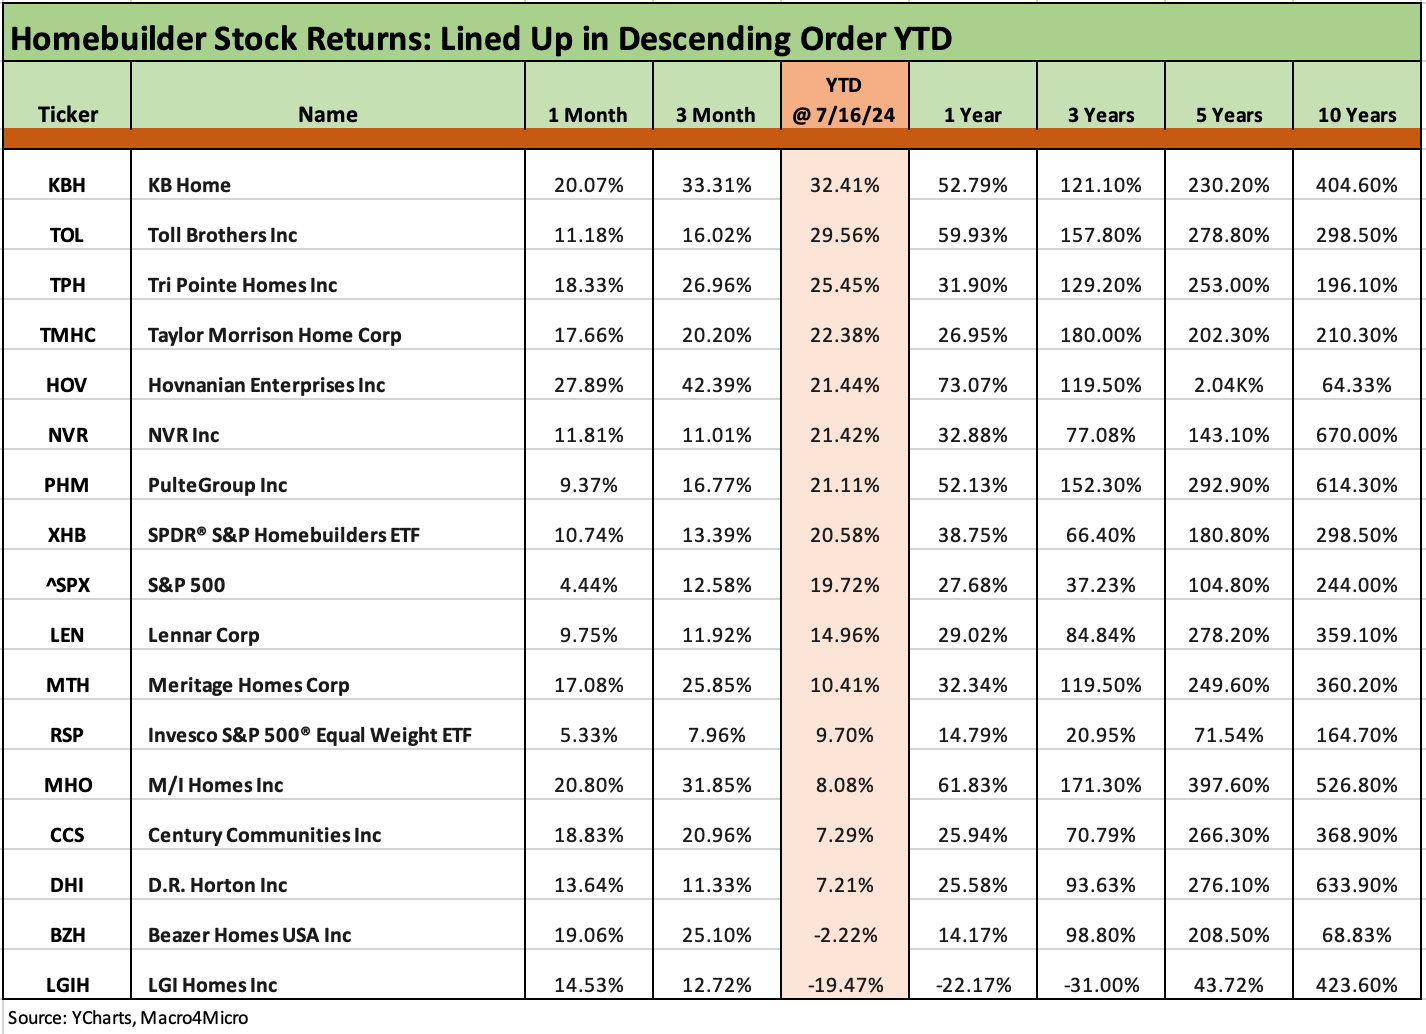
The above chart updates the homebuilder rally story that kicked in after the CPI numbers sent forward looking pricing strategies for builder equities into a frenzied rebound (see Homebuilder Equities: “Morning After” on Rate Optimism 7-12-24, Homebuilders: Equity Performance and Size Rankings 7-11-24).
We line the builders up in descending order of YTD returns, but the focus for this exercise is to check out the rolling 1-month numbers. We covered the story in the related links herein, but the builders are seeing a mad dash higher this week that continued yesterday with more than a few high single-digit moves continuing the rebound. The builder equity market has been quieter so far today with some in the red by late morning (as we go to print, the worst one I see is under -1.7%.
The builders are very impressive in their financial resilience in a rising or declining market, but the ability of 25 bps cuts in the fall to get the 10Y materially lower and 30Y mortgages under 6% with a recovery backdrop being built in seems like some very starry-eyed optimism. The headlines around sector rotation into Small Caps and Midcaps are making for a good story with a builder sector that is heavy in Small Caps and a few “big boys” in the mix. We detail relative market caps in the recent commentaries.
Regardless of the rate debate, that 1-month rally in homebuilder equities (+10.7% on the Homebuilders ETF, XHB) was more than double the S&P 500 at last night’s close and around 2x the equal weight S&P 500 ETF (RSP). For single names, we see some high teens and 20% handle moves such as KB Homes (see Credit Crib Note: KB Home 7-9-24) and some of the smaller players (M/I Homes). The riskier Small Cap leveraged builders also ran higher (Beazer, Hovnanian).

The above chart updates the current starts number for single-family vs. various long-term histories and medians for select time periods. The current 980K is below all the medians on the list except the post-crisis median from Jan 2009 to current (776K since the housing crisis peak). For the “three quarter full” crowd who see a very favorable demand profile for housing based on demographics and sustained high rates of employment, those various medians drive the upside scenarios and the ability of the builders to see very strong intermediate term performance.
The mortgage rate backdrop and cyclical scenarios in the broader economy will need to play out. Those expansion vs. contraction and PCE debates will continue nonstop on the way to the election. The crosscurrents of rapid easing, tariffs, trade battles and the inherent dislocations and high systemic costs such as we saw in 2018 and 2019 mean the policy debates will stay hot. The FOMC governance topic (shorthand for “fire Powell” and the White House dictates FOMC policy) is another issue already on the screen this week with the GOP convention. There is no shortage of soft and often speculative risk factors going on in housing.
The headline SAAR starts numbers weighed in at +3.0% for total starts and -4.4% YoY while single family was -2.2% sequentially and +5.4% YoY. The regional mix on single family starts is heavily driven by the massive South market, which was up +0.5% and +5.5% YoY. The #2 market, the West, was -10.2% sequentially for single family and +5.0% YoY. The smaller Midwest market at #3 was +0.9% sequentially on single family and flat YoY. The very small Northeast market was -2.9% sequentially on single family and +15.5% YoY.

The above chart updates the time series (not seasonally adjusted or “NSA”) for starts and permits. We break out total and single family timelines. “NSA” gets you closer to the actual activity in the trenches. For NSA YTD starts, total starts were -3.1% and single family was +16.1%. Permits YTD NSA were -1.0% for total and for single family was +14.0%.
On an NSA basis, total starts were up modestly and single-family flat. Both total permits and single family permits were down sequentially. On a SAAR basis, total permits were +3.4% sequentially and -3.1% YoY. Single family SAAR permits were -2.3% sequentially and -1.3% YoY.
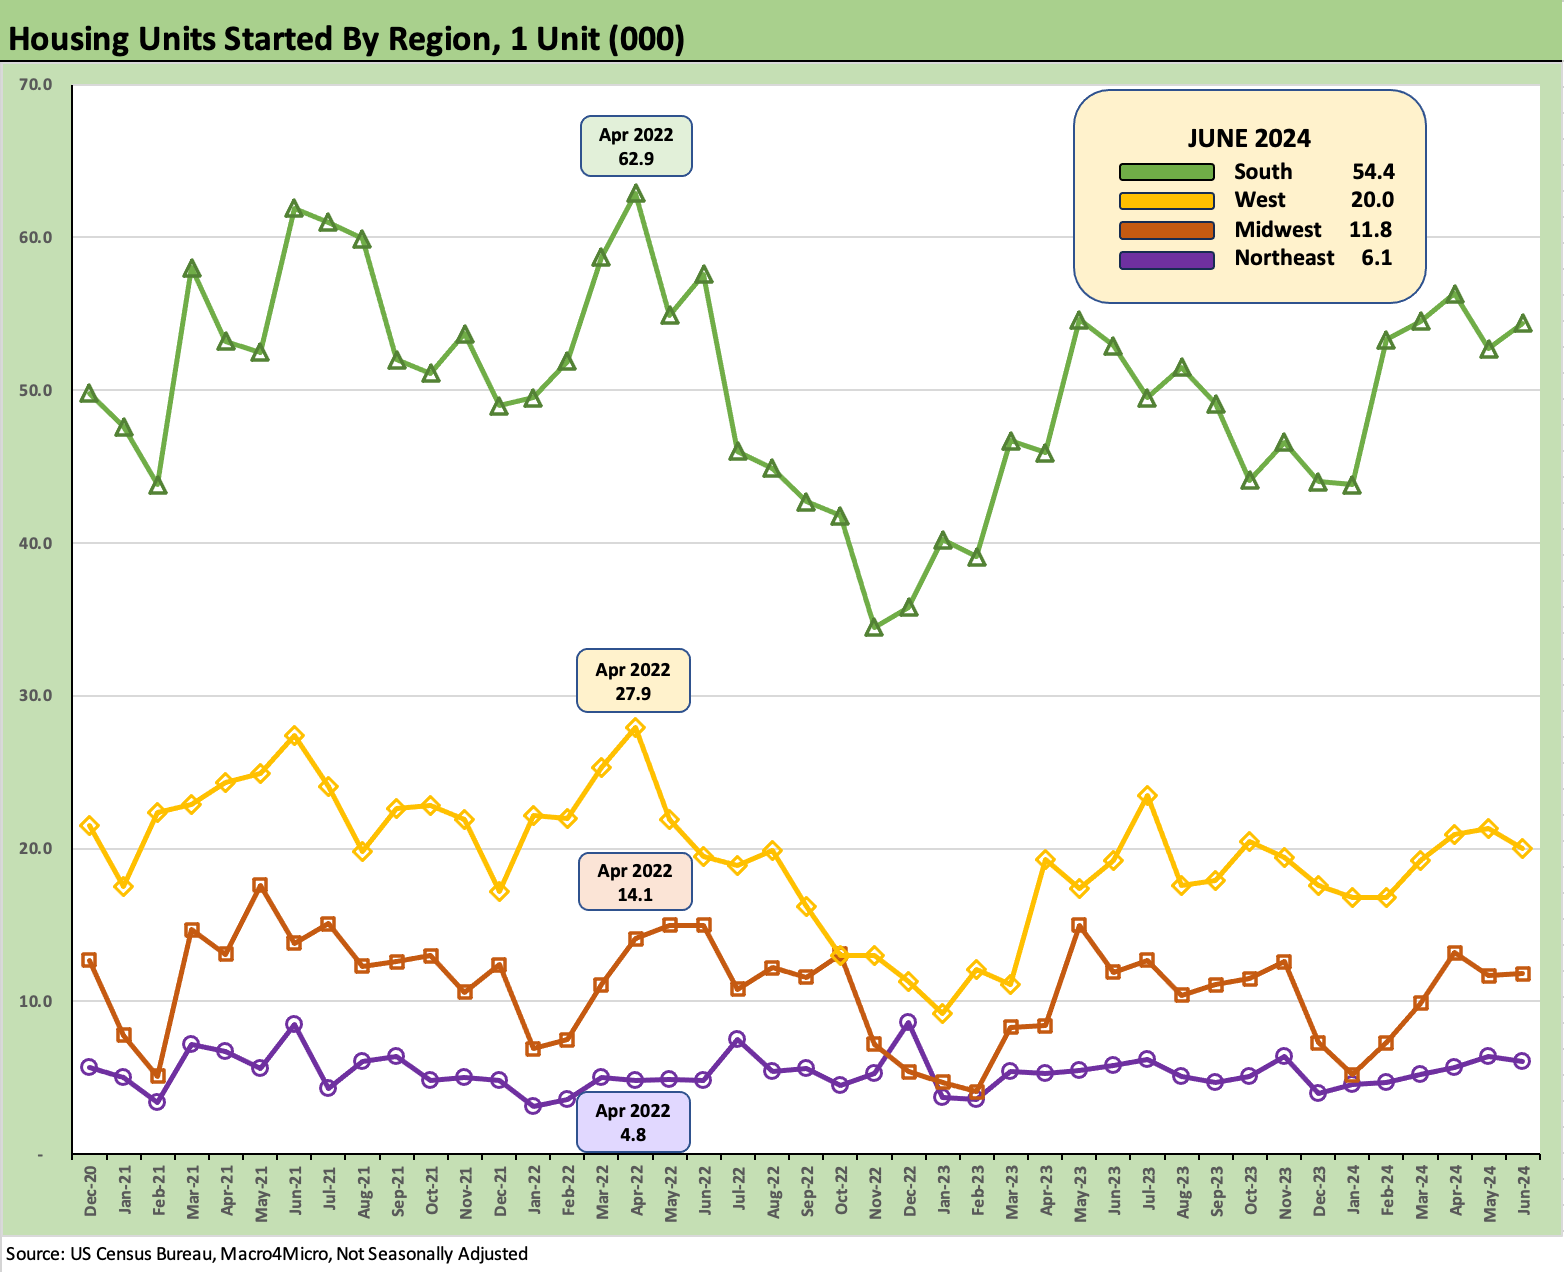
The above chart updates the Not Seasonally Adjusted starts activity by region. The important South region was up modestly in total and single family NSA starts. The West at #2 in size was slightly down in both. The YTD starts (NSA) for the South is down -3.5% for total but +12.7% for single family. The West is up +0.7% for total NSA starts but +30.4% for single family. The swing factor in NSA starts is the Multifamily decline with total 5+ units at -36.3% for YTD NSA starts.
Wrapping up the regional starts mix, we see the Midwest at -3.4% total NSA starts YTD and +12.6% for single family. The Northeast YTD NSA starts is -9.9% total and +12.0% single family.
The numbers to date roll into the equity valuation debate around the sustainability of growth. That just got new legs with the CPI release and FOMC chatter. The credit story from the BB tier and higher in the major BBB tier players remains rock solid under most any rational scenario to play out the rest of 2024. We will see what outlier economic policies might create for 2025 scenarios subject to the election and if anyone sweeps the White House, Senate and House.

The above chart updates Multifamily starts. As mentioned in a prior chart, NSA YTD starts for 5+ units were -36.3% YTD. On a SAAR basis for June, we see +22.0% sequentially but -23.4% YoY.
At the current run rate of +360K as of June 2024, Multifamily is modestly above the long-term median of 337K but well below the 1960s boom that rolled into the early 1970s on a combination of urbanization and the baby boom employment trends. The peak in this Multifamily cycle did not match the early 1970s peak or the mid-1980s peak.

Multifamily permits were off on an NSA basis and down by -24.8% YTD while SAAR permits for Multifamily on the month of June were more muted YoY at -6.5%. The sequential SAAR move was +19.2%. There is still a lot of drill-down that needs to be done by region and property type on Multifamily and across issuers. That is something for another day.
See also:
Footnotes & Flashbacks: State of Yields 7-14-24
Footnotes & Flashbacks: Asset Returns 7-13-24
Consumer Sentiment: Still Feeling the Heat 7-12-24
Homebuilder Equities: “Morning After” on Rate Optimism 7-12-24
Homebuilders: Equity Performance and Size Rankings 7-11-24
CPI June 2024: Good News is Good News 7-11-24
Footnotes & Flashbacks: Credit Markets 7-8-24
The B vs. CCC Battle: Tough Neighborhood, Rough Players 7-7-24
Payroll June 2024: The Race Gets Confusing 7-5-24
JOLTS May 2024: The Jobs Oasis Still Has Water 7-2-24
Footnotes & Flashbacks: Credit Markets 7-1-24
State Unemployment: A Sum-of-the-Parts BS Detector 6-30-24
The Debate: The China Deficit and Who Pays the Tariff? 6-29-24
Housing:
Credit Crib Note: KB Home 7-9-24
New Home Sales: Pumping the Brakes 6-26-24
Existing Home Sales May 2024: Weary Climb 6-21-24
Housing Starts May 2024: Starts vs. Deliveries Balancing Act 6-20-24
Lennar: Key Metrics Still Tell a Positive Macro Story 6-20-24
Credit Crib Note: NVR, Inc. 5-28-24
New Home Sales April 2024: Spring Not Springing Enough 5-23-24
Toll Brothers: A Rising Tide Lifts Big Boats 5-23-24
Credit Crib Note: Taylor Morrison 5-20-24