
Mini Market Lookback: The Upside of Volatility
A week of econ crosscurrents trims some recent setbacks as the market awaits specific policy language and hard facts.


“External” Revenue Service Jedi Mind Trick: “The selling country pays tariffs…”
Very strong bank earnings reports and a manageable CPI number that came in below expectations offered the market relief on the UST and equity side of the ledger while Retail Sales, Industrial Production, and Housing Starts did not change the debate meaningfully (see CPI Dec 2024: Mixed = Relief These Days 1-15-25).
Equities rallied impressively and the UST yields eased even if the 10Y UST is still around 100 bps above the Sept lows. The FOMC oddsmakers are leaning toward a longer wait for easing in 2025.
The easy conclusion on the economy is that the new/old President will be inheriting a very strong economy coming off back-to-back 3% handle GDP growth quarters and the best 2-year returns in the S&P 500 since the late 1990s. The 4Q24 advance GDP report is due Jan 30 with Personal Income & Outlays/PCE inflation on Jan 31.
The nominee checklist and legislative deckchair decisions will color views on the direction of tariffs (high and broad) and deportation aggression (also high) as well as Russia-Ukraine policy with the recent anti-Ukraine replacement on the Intel Committee (oil supply wildcard?). One way or the other, the policy facts will be here soon.
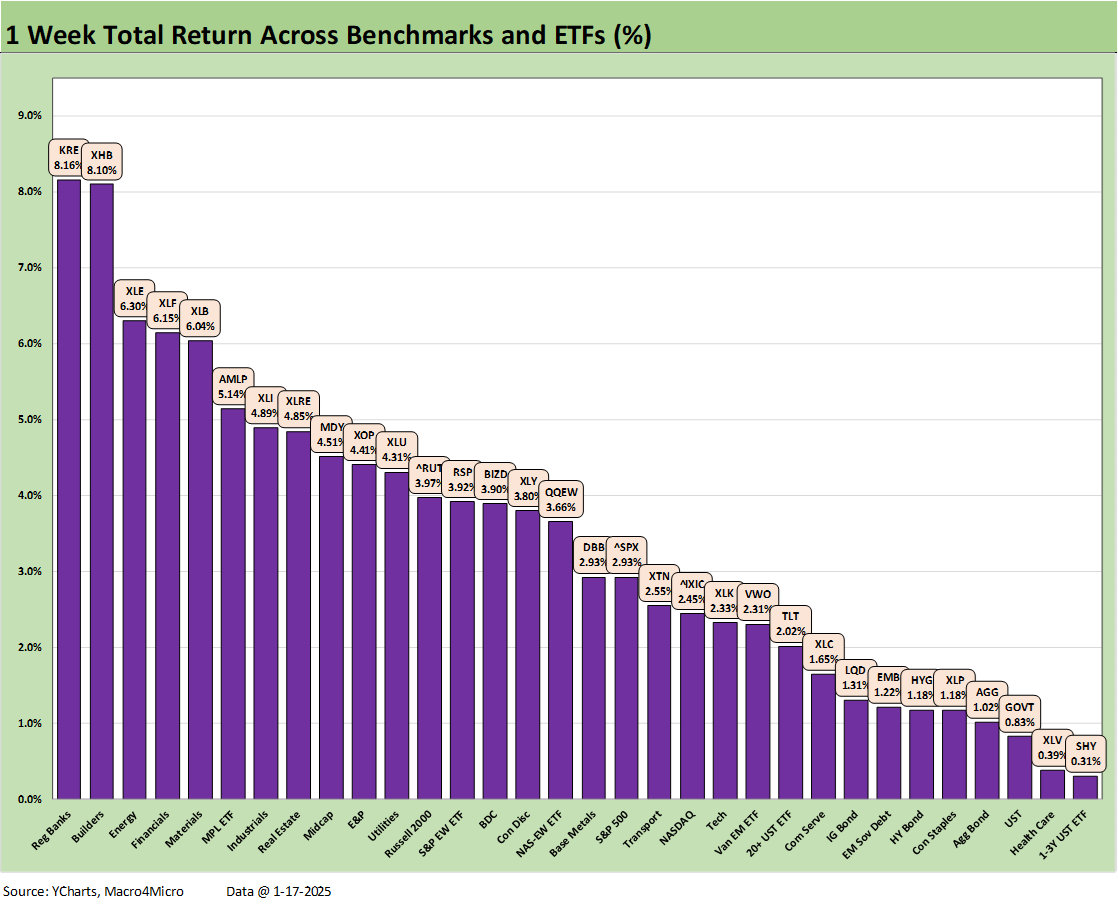
The above chart shows a very positive week across the 32 benchmarks and ETFs we track. There is not a lot of mystery to the performance with all of them positive. Fundamental risk and duration were both rewarded this week. Equities rallied and HY spreads compressed. In light of recent weeks, the above chart is a reminder that volatility cuts both ways at a time when the biggest X-factors still lie ahead and notably around inflation, tariffs and labor disruptions.
The S&P 500 saw all 11 sectors positive with big winners in Financials, Energy, Materials, Industrials and Real Estate. The above chart shows Regional Banks (KRE) at #1, Homebuilders (XHB) at #2 after a rough stretch and a more distant #3 with Energy (XLE), Financials (XLF) at #4, and Materials (XLB) at #5. Rounding out the top quartile was Midstream Energy (AMLP), Industrials (XLI), and Real Estate (XLRE). No tech-centric benchmarks or ETFs made the top tier this week. That mix shows some healthy breadth which has been missing for a while.
From the macro side, the constructive but mixed CPI report brought some relief (see CPI Dec 2024: Mixed = Relief These Days 1-15-25). Retail sales were not overheated but were very constructive on the state of the consumer (see Retail Sales Dec 2024: A Steady Finish 1-16-25). Meanwhile, Industrial Production was also better while still generating below average capacity utilization (see Industrial Production Dec 2024: Capacity Utilization 1-17-25).
When equities are running, bond returns can only move so quickly on the UST shifts with 6 of the 7 bond ETFs in the bottom quartile but all positive. The long duration 20+Y UST ETF (TLT) made it into the low end of the third quartile.
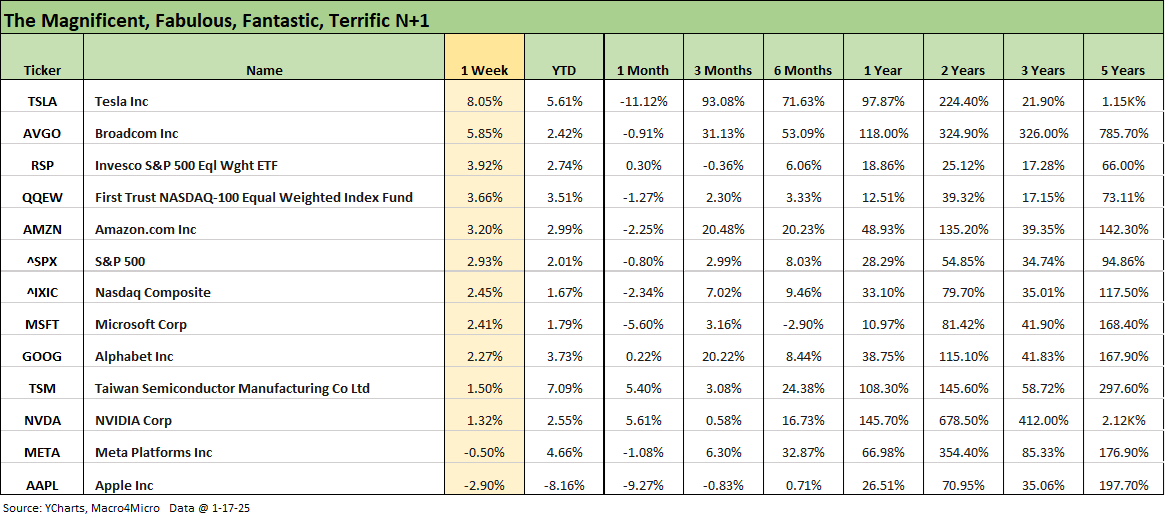
The above chart updates the tech bellwether return chart for the week. We line them up in descending order of returns for the week. Tesla was rocking once again at +8.0% as it recovers some of the 1-month selloff after a blisteringly strong 3-months at +93% and +71.6% over a 6-month run. Looking back over 1 year, only NVIDIA, Broadcom and Taiwan Semi are ahead of Tesla.
For the week, only 2 of the Mag 7 beat the S&P 500 with Tesla and Amazon ahead. We see that 2 of 7 Mag 7 names were in the red with Apple and Meta.
The “External” Revenue Service seeks mass hypnosis…
The world of policy and politics and how it all flows into economics is always an important wildcard in how to frame every line item in the GDP accounts. There is often a need to downplay the angles on it at the risk of alienating customers whether it be Trump fans or those married to formulaic Progressive theme music and their very predictable lyrics. We now more than ever live in a “You lie and I’ll swear to it” world. On that note, Trump came up with another tariff mind trick this past week with this gem on social media:
"I am today announcing that I will create the EXTERNAL REVENUE SERVICE to collect our Tariffs, Duties, and all Revenue that come from Foreign sources. We will begin charging those that make money off of us with Trade, and they will start paying, FINALLY, their fair share. January 20, 2025, will be the birthday of the External Revenue Service.”
As noted above, Trump announced his creation of the “External Revenue Service” to collect a list of items from the selling countries including tariffs. The fact that the importer pays (“buyer pays” …seller does not) is on the short list of things Team Trump cannot state. Saying “buyer pays” is verboten. The reality is that if you can convince a core MAGA audience you won an election that you lost by 7 million votes, you can certainly sell the angle that you collected billions and billions from China et al.
Trump is also selling the idea that purchase decisions made by US companies to maximize profits is in fact the trade partners “ripping us off.” That means US companies are ripping us off? Who is “us?” The shareholders? Workers? US retailers? US manufacturers? The dealers selling imported vehicles? The auto finance companies that lend in those purchases? The list goes on…. The themes are what counts in politics.
At sea level, tariffs will change the economics of the purchasing and supplier chain decisions, and companies will adapt with a range of responses that we will all need to watch closely in 2025:
Domestic manufacturers can raise prices for profit: With tariffs lifting all domestic boats, the US operators can just raise prices. That was notable during Trump 1.0 with steel (one example). With Canada a major supplier of many natural resources across oil, metals/mining and downstream steel products, the raw materials cost pressure will feed decisions on cost recovery (raise prices or eat the margin erosion).
Raise prices on cost recovery of higher supplier chain costs: This one cannot be more obvious. The supplier chain costs from any major trade partner (Mexico, Canada, China, EU) will need to be “recovered or eaten” on the revenue line (price) or in the expense line (cost of sales). It is hard to confuse the obvious.
There is a lot more than the simple price and cost dynamics of tariffs that we have discussed in other commentaries, but the dialogue breaks down even with these simple cause-and-effect facts of life. Trump has outlawed the facts of “a lost election” and “buyer pays.”
Among the other variables to conclude is predicting retaliation strategies from tariffs to quotas and taxes on exports of critical materials by trade partners to “make it hurt” in the US. Those “export taxes” are being debated in Canada right now in the area of natural resources from Canada. A wide range of Canadian natural resources are major import lines in the US (see Tariff: Target Updates – Canada 11-26-24). In other words, even if they don’t face tariffs by the US, Canada can counter to hurt US costs. A wide range of metals, inorganic chemicals, and even the Canadian crudes (discounted and attractive as they are to US refiners) all are potential tools for Canada to use. Provinces such as Alberta are of course opposed to that idea.
Handicappers typically think about retaliatory tariffs and neglect the massive risks associated with targeted supply restrictions or “exit taxes” that raise costs and generate what can be severe supply-demand imbalances. The biggest threats are natural resources from Canada and pharma inputs from China. The potential for supply-demand imbalance in light vehicles is another obvious one that would impact pricing strategies at the OEM and dealer level. That would in turn flow into used vehicle pricing. It is not a theory since US consumers just went through this after the pandemic.
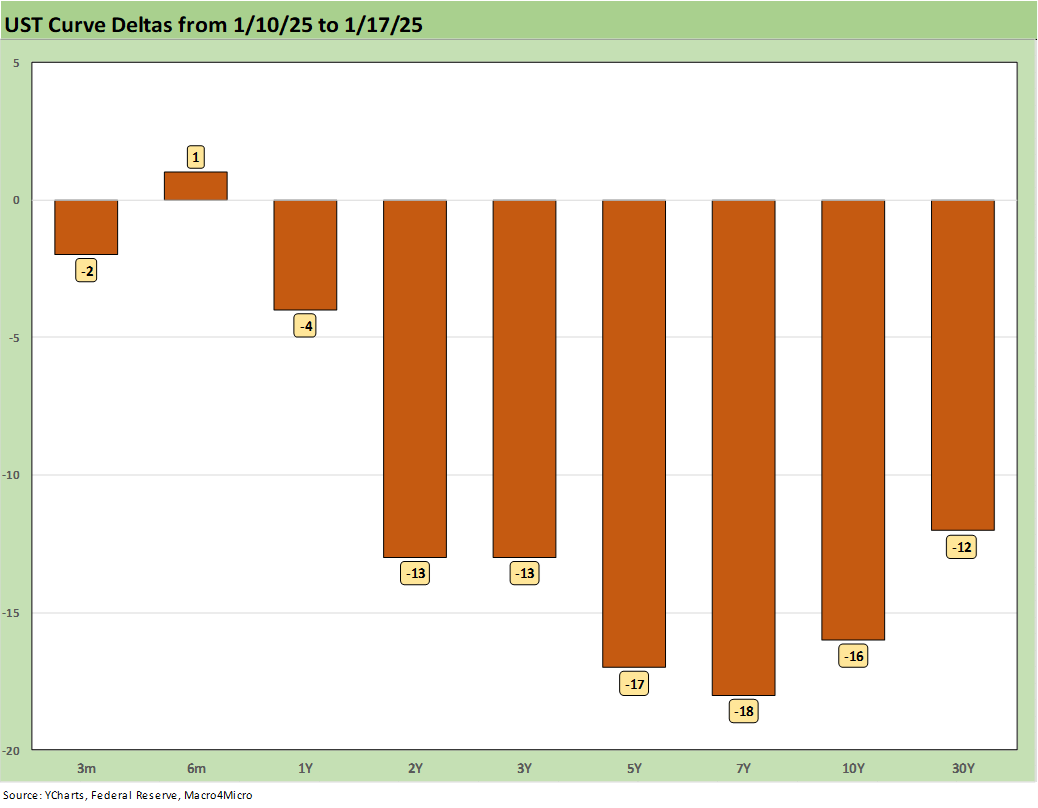
The UST delta rebound is clear enough in the chart. The week saw duration winning and CPI offering a perfectly good excuse to rally as the market awaits tariff specifics from the US side and a sense of the retaliation actions from trade partners. We also await more labor supply chatter as the “criminals only” deportation optimists get gut-checked and the scale of the deportation gets better visibility. The market also will need to ponder debt ceiling risks (as of now) and then consider the projected deficit and a UST supply that will get downright Homeric in scale.
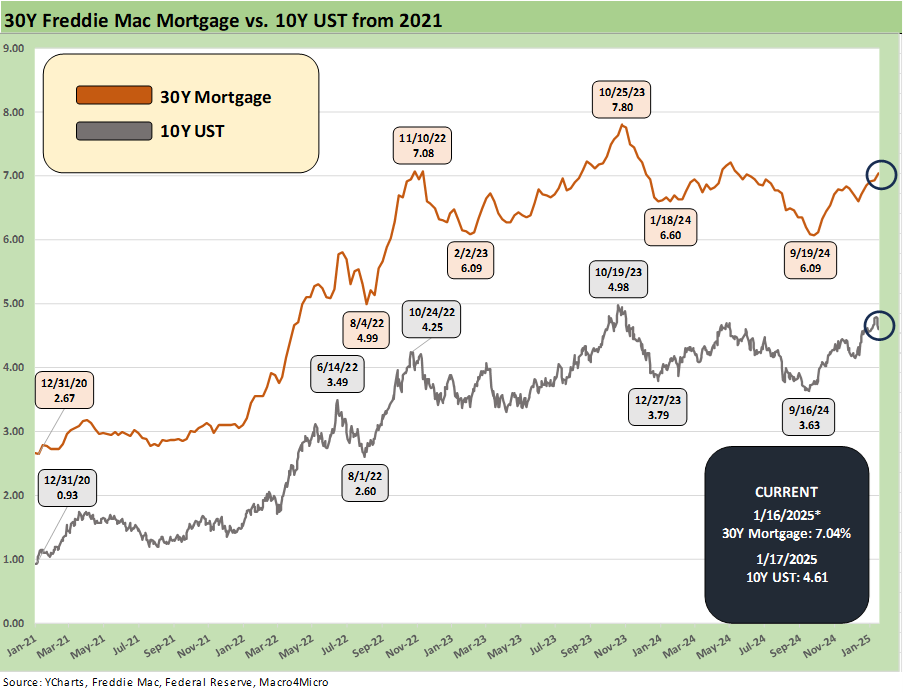
In the 10Y UST vs. Freddie Mac 30Y chart, we see the 10Y rally on the week while the Freddie Mac benchmark (priced on Thursday at noon) finally moved back above the 7.0% line. While the 10Y UST posted up a favorable week for bonds, it remains almost 100 bps off the Sept lows. We will look at more angles on the UST curve when we post our State of Yields Footnotes publication.
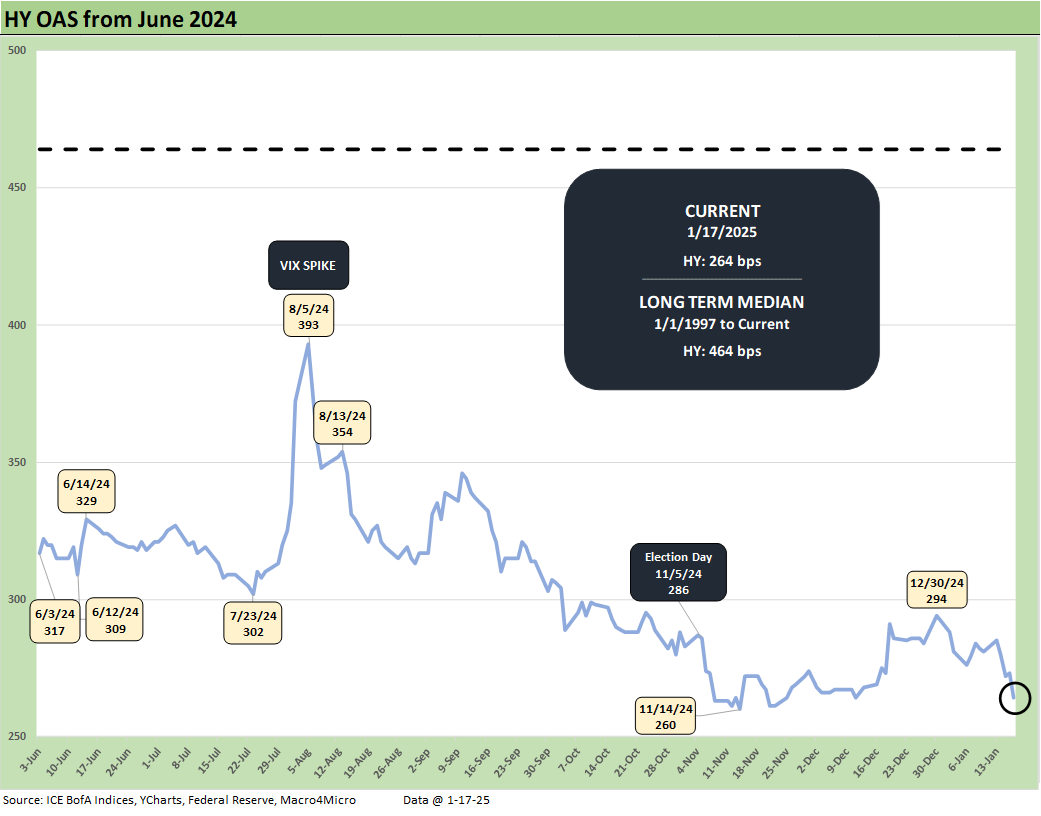
The HY market had no reason to sell off from its June 2007-type spread levels with good macro numbers and very strong and reassuring bank earnings and market color with the likelihood of another good week that lies ahead in bank and finance reporting. The week saw a -17 bps compression in HY spreads to +264 bps from +281 bps last week. Quality spreads tightened from the bottom up. The BB tier was -12 bps, B tier -21 bps and CCC tier -25 bps.
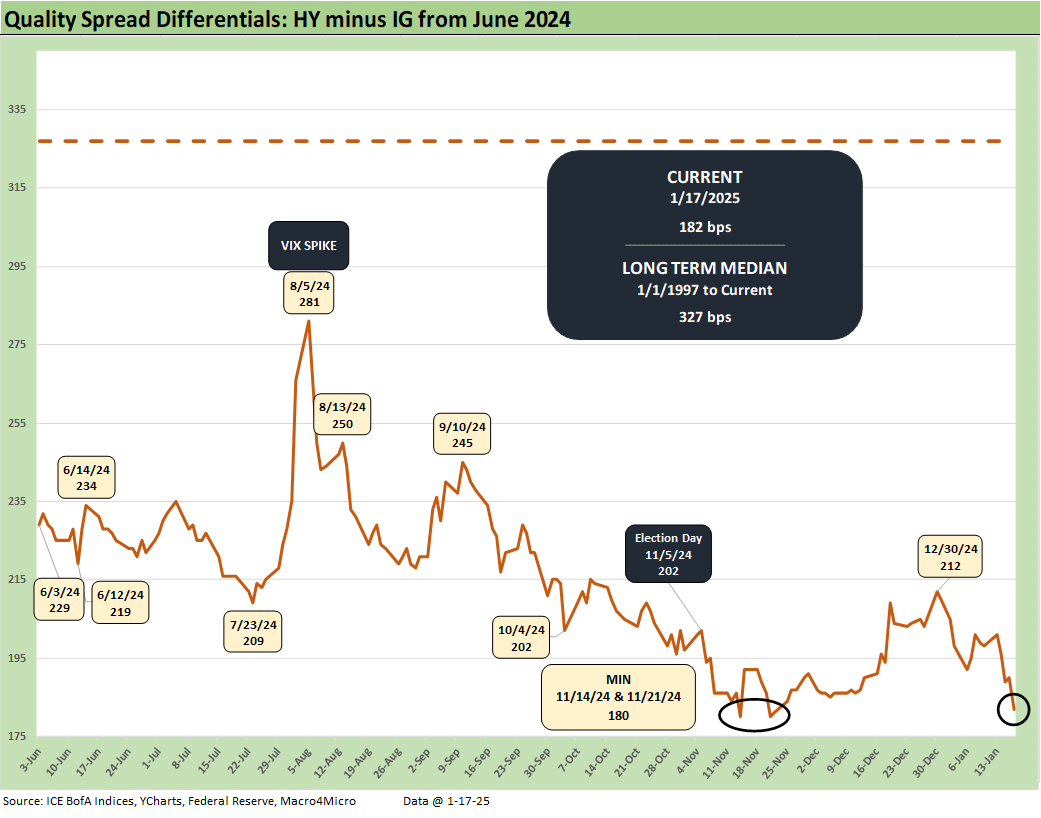
HY OAS minus IG OAS spreads compressed on the week from +198 bps to +182 bps, which is well inside the median of around +327 bps. The +182 is just slightly above the +180 lows of Nov 2024.
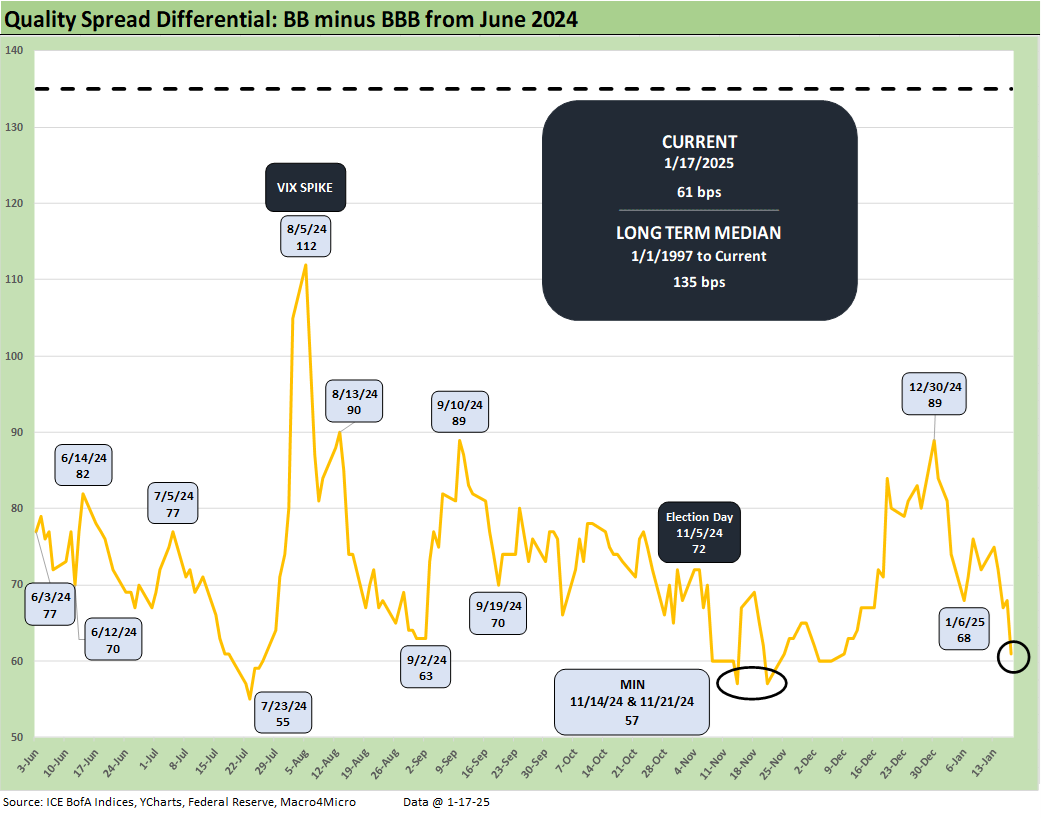
The “BB OAS minus BBB OAS” quality spread compression narrowed to +61 bps on the week from +72 bps last week as IG posted minimal moves and the BBB tier only -1 bps tighter. The BB vs. BBB differential is still above the Nov lows of +57 bps.
See also:
Housing Starts Dec 2024: Good Numbers, Multifamily Ricochet 1-17-25
Industrial Production Dec 2024: Capacity Utilization 1-17-25
Retail Sales Dec 2024: A Steady Finish 1-16-25
CPI Dec 2024: Mixed = Relief These Days 1-15-25
KB Home 4Q24: Strong Finish Despite Mortgage Rates 1-14-25
United Rentals: Bigger Meal, Same Recipe 1-14-25
Footnotes & Flashback: Credit Markets 1-13-25
Footnotes & Flashbacks: State of Yields 1-12-25
Footnotes & Flashbacks: Asset Returns 1-12-25
Mini Market Lookback: Sloppy Start 1-11-25
Payroll Dec 2024: Back to Good is Bad? 1-10-25
US-Canada: Tariffs Now More than a Negotiating Tactic 1-9-25
Payroll % Additions: Carter vs. Trump vs. Biden…just for fun 1-8-25
JOLTS: A Strong Handoff 1-7-25
Annual GDP Growth: Jimmy Carter v. Trump v. Biden…just for fun 1-6-25
Mini Market Lookback: Mixed Start, Deep Breaths 1-5-25
Footnotes & Flashbacks: Credit Markets 2024 1-3-25
Footnotes & Flashbacks: Asset Returns for 2024 1-2-25
HY and IG Returns since 1997 Final Score for 2024 1-2-25
Spread Walk 2024 Final Score 1-2-25
Footnotes & Flashbacks: Asset Returns for 2024 1-2-25
Credit Returns: 2024 Monthly Return Quilt Final Score 1-2-25
Annual and Monthly Asset Return Quilt 2024 Final Score 1-2-25
HY and IG Returns since 1997: Four Bubbles and Too Many Funerals 12-31-24
Mini Market Lookback: Last American Hero? Who wins? 12-29-24
Spread Walk: Pace vs. Direction 12-28-24
Annual and Monthly Asset Return Quilt 12-27-24
Credit Returns: 2024 Monthly Return Quilt 12-26-24
Tariff links:
Trade: Oct 2024 Flows, Tariff Countdown 12-5-24
Mexico: Tariffs as the Economic Alamo 11-26-24
Tariff: Target Updates – Canada 11-26-24
Tariffs: The EU Meets the New World…Again…Maybe 10-29-24
Trump, Trade, and Tariffs: Northern Exposure, Canada Risk 10-25-24
Trump at Economic Club of Chicago: Thoughts on Autos 10-17-24
Facts Matter: China Syndrome on Trade 9-10-24
Trade Flows: More Clarity Needed to Handicap Major Trade Risks 6-12-24
Trade Flows 2023: Trade Partners, Imports/Exports, and Deficits in a Troubled World 2-10-24
Trade Flows: Deficits, Tariffs, and China Risk 10-11-23