
Market Commentary: Asset Returns 11-30-25
We update the asset return performance across debt and equity benchmarks and ETFs.


The finish is sometimes the hardest part.
A great week for stocks does not change the reality of a weak November as the market wrestled with the confusion around FOMC easing and how the FOMC will be setting its bar for payroll and inflation.
The Oct payroll and CPI will not be released, but this coming week will see Personal Income and Outlays from the BEA. No 3Q25 GDP data will be available until Dec 23 when the market can get some more moving parts. We did not see good news in the recent PPI information. The August to Sept MoM trends were not inflation friendly.
The return mix YTD sets up some interesting year end drama on whether the total return on the S&P 500 and NASDAQ can match or beat the performance in 2024. For now, it looks like 2024 will win the head-to-head return comps.
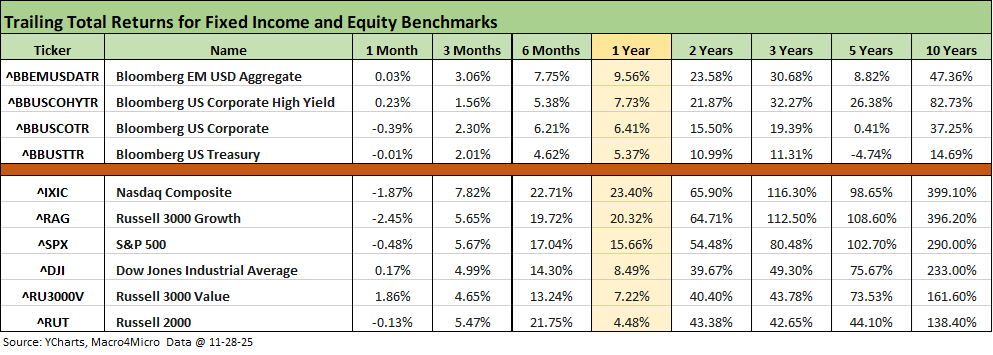
The above table updates the headline debt and equity benchmarks we monitor. The 1-month numbers offer a reminder of the rolling 30-day mediocrity for both fixed income and equity benchmarks. We see 2 of 4 debt line items negative with small numbers on both sides of the zero line.
The equity return for the rolling 30 days (not the calendar month) shows 4 of 6 in the red with NASDAQ and Russell 3000 Growth the worst of the pack. We see the Russell 2000 fade, but the small cap benchmark is still boasting solid 3-month returns and a very impressive 6-months. At this point, the Russell 2000 small cap benchmark has a better chance of 2025 beating the 2024 performance than we see with the large caps.
The rolling return visual
In the next section, we get into the details of the 32 ETFs and benchmarks for a mix of trailing periods. Below we offer a condensed 4-chart view for an easy visual on how the mix of positive vs. negative returns shape up. This is a useful exercise we do each week looking for signals across industry groups and asset classes.
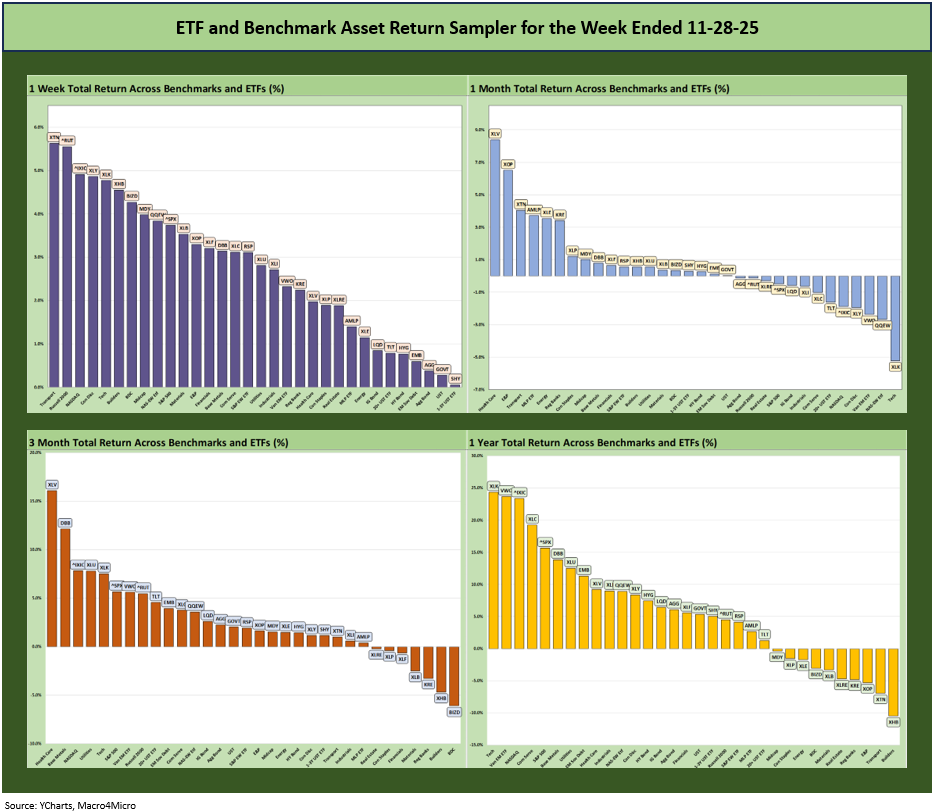
We see a great week to end a soft month as tech was bounced around and bond ETFs held in well enough to stay positive over 3 months, over the YTD period (we post YTD below), and for the LTM period. Equities still boast very strong positive vs. negative symmetry for this past week with the 1-month period mixed. The 3-month and YTD scoresheet heavily favor positive returns while the LTM period is also weighted toward the positive side.
The total return results will need a very favorable December to get the S&P 500 and NASDAQ close to last year’s total return numbers as we discuss below (see Footnotes & Flashbacks: Asset Returns for 2024 1-2-25). “Record highs” or “near record highs” does not mean “higher total returns than 2024 and 2023.” So far, only the Russell 2000 small cap index looks likely to beat 2024. We have a full month to go, so “it ain’t over yet.”
The Magnificent 7 heavy ETFs…
Some of the benchmarks and industry ETFs we include have issuer concentration elements that leave them wagged by a few names. When looking across some of the bellwether industry and subsector ETFs in the rankings, it is good to keep in mind which narrow ETFs (vs. broad market benchmarks) get wagged more by the “Magnificent 7” including Consumer Discretionary (XLY) with Amazon and Tesla, Tech (XLK) with Microsoft, Apple, and NVIDIA, and Communications Services (XLC) with Alphabet and Meta.
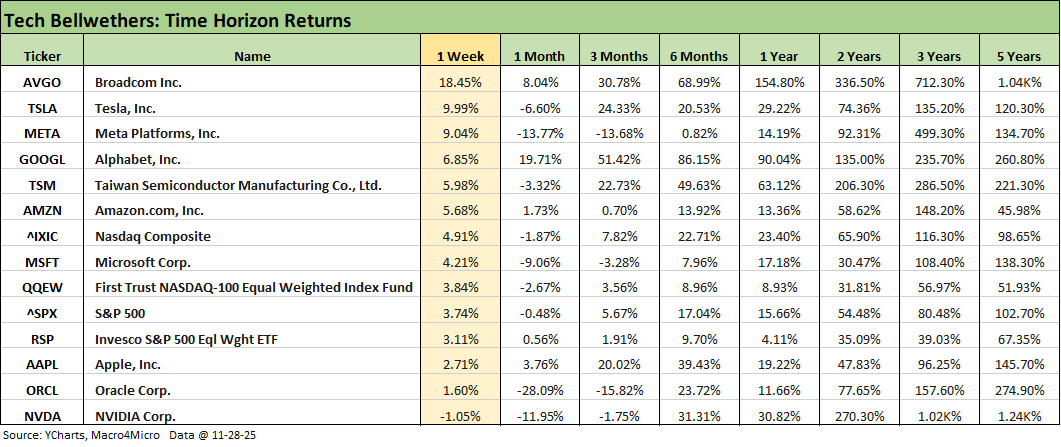
We already looked at the tech bellwether numbers in our Mini Market Lookback: Back into the June 2007 Zone (11-29-25). The big 1-week rally is brought back to earth by the trailing 1-month performance, which shows a lot of red and some major beatdowns such as Oracle at -28.1%, Meta at -13.8% NVIDIA at -11.9%, and Microsoft at -9.1%.
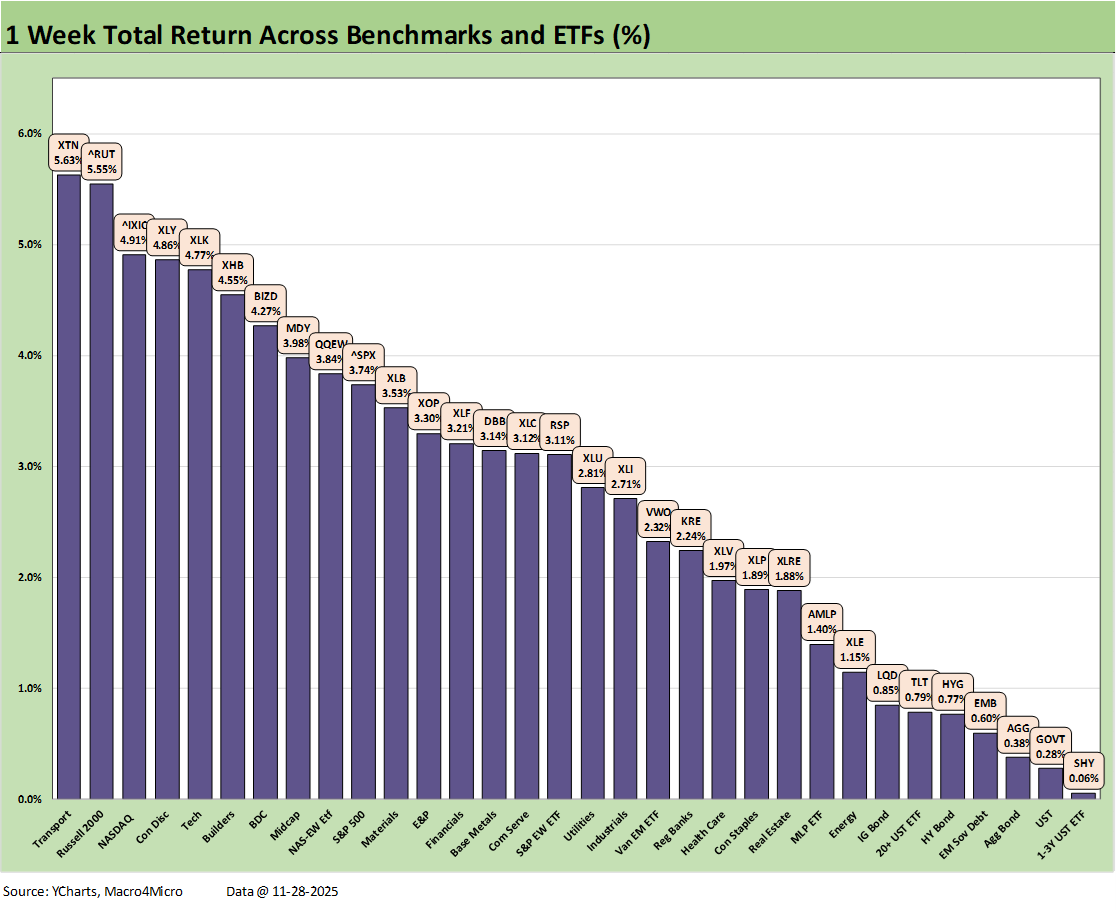
We already looked at the weekly returns for the 32 benchmarks and ETFs we monitor in our Mini Market Lookback: Back into the June 2007 Zone (11-29-25). There is not much room for confusion in the above chart with all 32 posting positive returns for the week and the bottom 7 all being bond ETFs with a small UST curve rally and tighter spreads.
We see the small cap Russel 2000 in the top 5 with the NASDAQ and Midcaps in the top quartile. Despite all 11 S&P 500 sectors in the green for this week, the SPX missed the top quartile. Some notable recent laggards such as BDCs (BIZD) and Homebuilders (XHB) moved into the top quartile on the equity bounce.
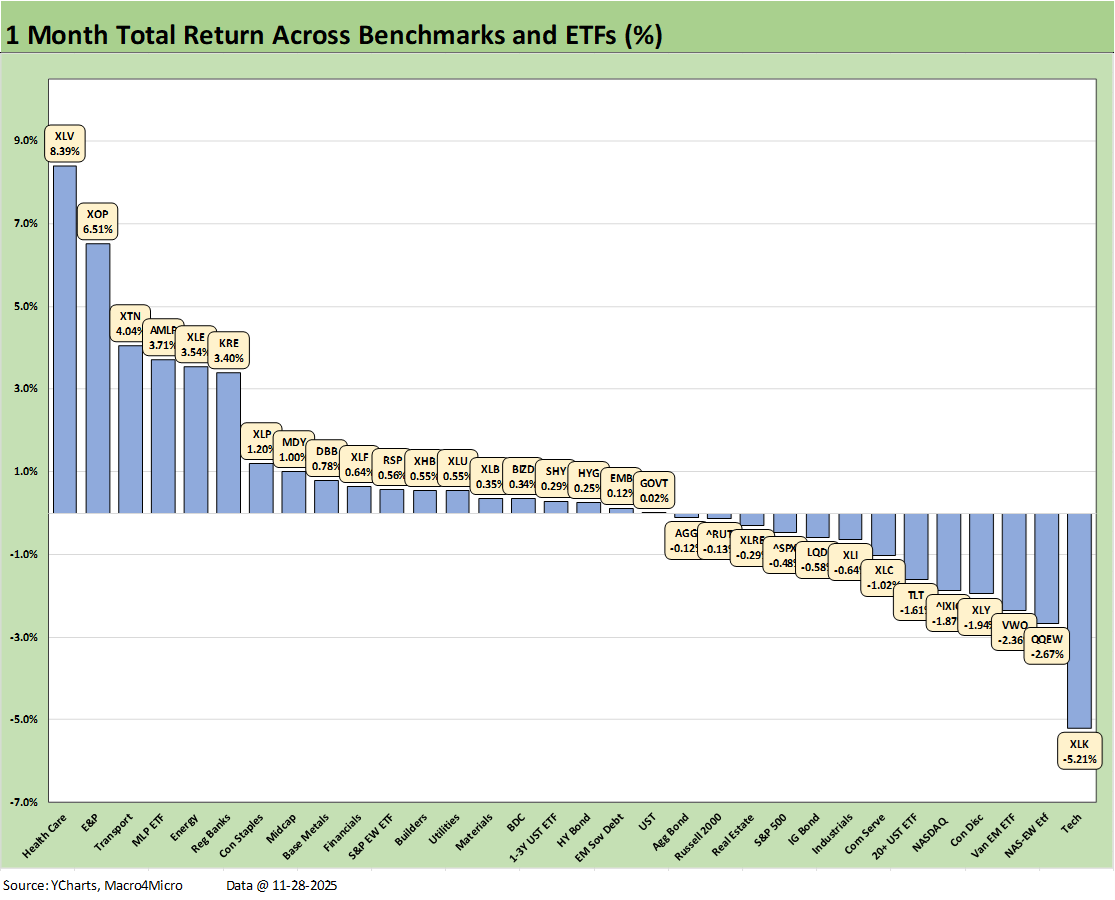
The 1-month score was 19-13 with tech pain in evidence. We see the Tech ETF (XLK) in last place with the 2nd to last place held by the Equal Weight NASDAQ 100 (QQEW) with the NASDAQ also in the bottom 5. The bottom quartile includes tech heavy Communications Services (XLC).
The small cap Russell 2000 is in the red along with the S&P 500, NASDAQ, and QQEW. Midcaps (MDY) turned in a meager +1.0% but that earned it a spot in the top quartile.
The winners are led by Health Care (XLV), which has benefited from a blazing performance in pharma. The 3 energy ETFs were also in the top quartile with E&P (XOP), Midstream Energy (AMLP) and the diversified Energy ETF (XLE) in the top 5. Healthy energy returns come despite some potential oil weakness tied to Russian supply under a miraculous scenario that sees Putin make concessions.
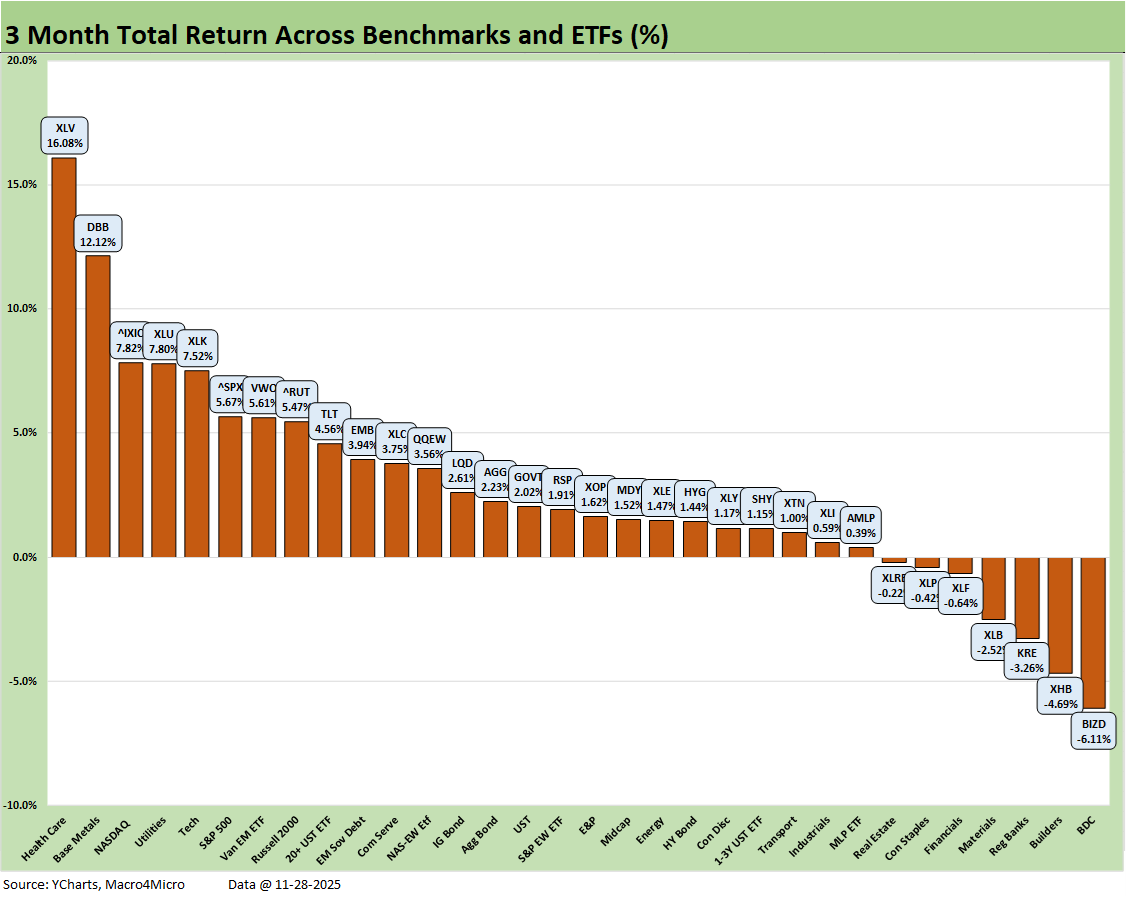
The 3-month returns weighed in at a score of 25-7 as earnings season, the shutdown, macro data scarcity, and FOMC uncertainty made for a short list of challenges. The weaker performance of BDCs has been covered along the way in various publications, but a reporting season of detailed BDC earnings calls has helped push back on the “cockroach theory” even while raising concerns around theoretical “marks” and loan carrying values. Such concerns are pretty much standard.
The UST curve anxiety and pace and scale of easing shows up in the weakness for Homebuilders (XHB), Regional Banks (KRE), Financials (XLF), Real Estate (XLRE), and the dividend-driven Consumer Staples (XLP).
The big winner over 3 months was Healthcare (XLV) with the pharma rallies. Base Metals (DBB) was at #2. We see the 3 major benchmarks in the top quartile with NASDAQ, the S&P 500, and Russell 2000 small caps. With that backdrop, the market was about more than the Mag 7. Utilities (XLU) and EM Equities (VOW) also were in the top tier.
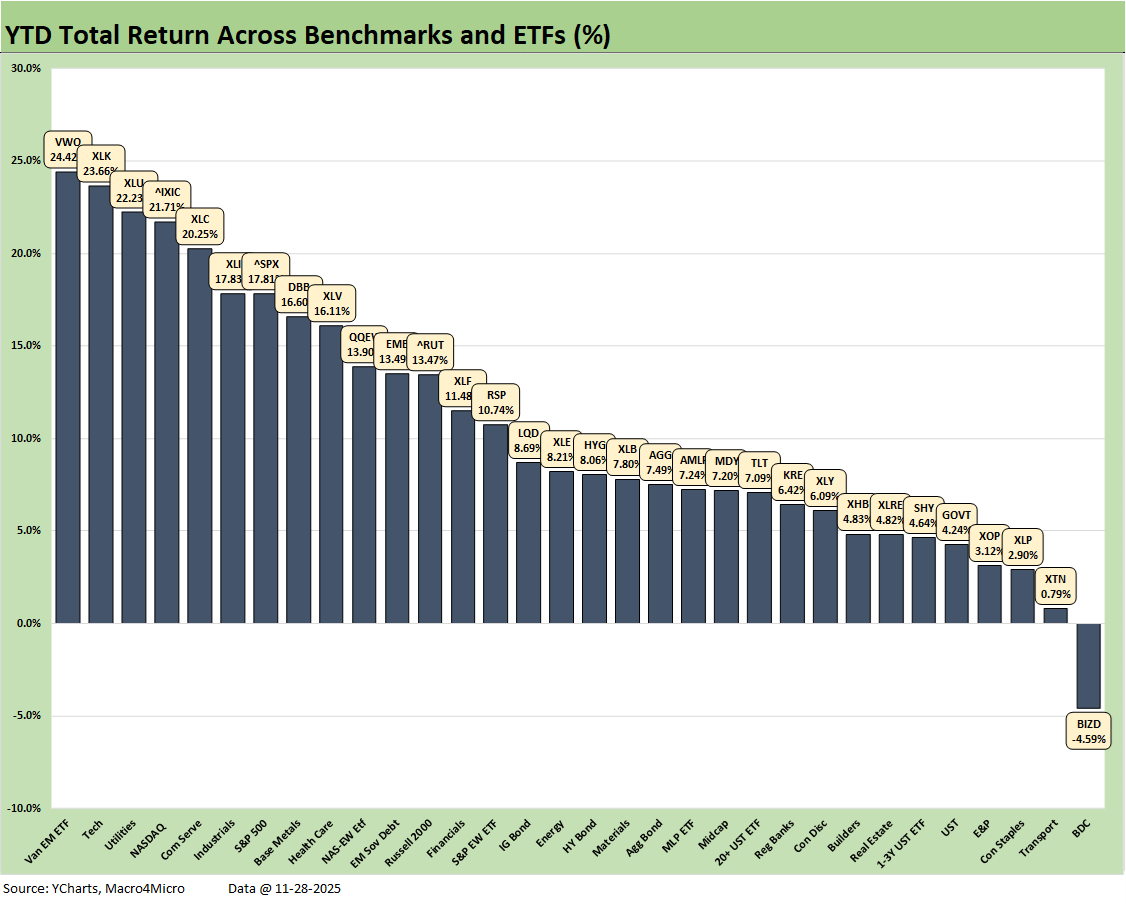
The year 2025 heads into the final month of the year with a very strong mix of positive vs. negative returns across the 32 benchmarks and ETFs. At a score of 31-1, only the BDC ETF (BIZD) is in the red. The bond ETFs are spread around the 2nd, 3rd, and bottom quartile with GOVT and SHY in the bottom tier. The IG corporates ETF (LQD) is running ahead of HYG on the back of the UST and duration returns.
At #1, EM Equities was able to ride the currency effects of the weak dollar while Tech (XLK) was at #2, NASDAQ at #4, Communications Services (XLC) at #5 were in the top 5 with Utilities (XLU).
For December, a fun finish line drama will be whether the S&P 500 (+17.8% YTD) and NASDAQ (+21.7% YTD) will be able to beat the +25.0% total return on the S&P 500 in 2024 or the +29.6% for NASDAQ in 2024. As detailed above, they need a very strong finish to beat last year. Trump dubbed 2024 a “dead” year and dead economy as he called 2025 the greatest first year “in Presidential history.” This could get interesting.
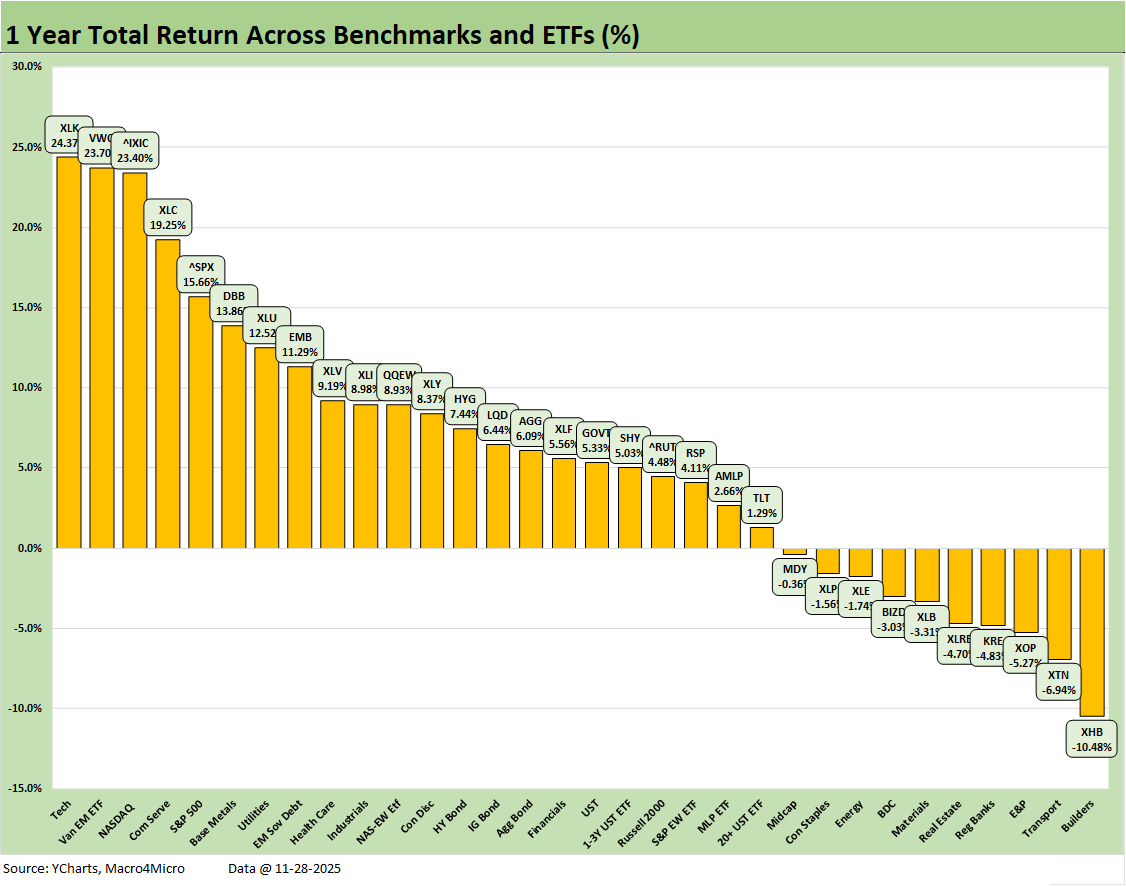
The LTM score was 22-10 with a Hi-Lo range of almost 35 points from Tech (XLK) at #1 to Homebuilders (XHB) in last place at #32 at -10.5%. We see 4 of the top 5 with a heavy tech influence from #1 to #5 with NASDAQ, XLK, XLC and the S&P 500.
As already covered, the S&P 500 will need to finish 2025 in impressive fashion to match the 2024 and 2023 S&P 500 returns. The year 2024 was Part Two of the best 2-year run in the S&P 500 since the late 1990s, so that sets a high bar for the Trump stock market (see Footnotes & Flashbacks: Asset Returns for 2024 1-2-25). This year will likely not clear that bar.
The bond ETFs were all positive with EM Sovereigns (EMB) in the top quartile. We see 3 in the second quartile with HYG, LQD, and AGG. In the third quartile, we see GOVT plus the “duration barbell” of SHY and TLT.
See also:
Mini Market Lookback: Back into the June 2007 Zone 11-29-25
Durable Goods Sep 2025: Quiet Broadening of Core Capex 11-26-25
Retail Sales September 2025: Foot off the Gas 11-25-25
The Curve: Flying Blind? 11-24-25
Mini Market Lookback: FOMC Countdown 11-23-25
Employment Sept 2025: In Data We Trust 11-20-25
Payrolls Sep25: Into the Weeds 11-20-25
Credit Markets: Show Me the Data 11-17-25
Mini Market Lookback: Tariff Policy Shift Tells an Obvious Story 11-15-25
Retail Gasoline Prices: Biblical Power to Control Global Commodities 11-13-25
Simplifying the Affordability Question 11-11-25
Mini Market Lookback: All that Glitters… 11-8-25
Mini Market Lookback: Not Quite Magnificent Week 11-1-25
Synchrony: Credit Card Bellwether 10-30-25
Existing Home Sales Sept 2025: Staying in a Tight Range 10-26-25
Mini Market Lookback: Absence of Bad News Reigns 10-25-25
CPI September 2025: Headline Up, Core Down 10-24-25
General Motors Update: Same Ride, Smooth Enough 10-23-25
Mini Market Lookback: Healthy Banks, Mixed Economy, Poor Governance 10-18-25
Mini Market Lookback: Event Risk Revisited 10-11-25
Credit Profile: General Motors and GM Financial 10-9-25
Mini Market Lookback: Chess? Checkers? Set the game table on fire? 10-4-25
JOLTS Aug 2025: Tough math when “total unemployed > job openings” 9-30-25
Mini Market Lookback: Market Compartmentalization, Political Chaos 9-27-25
PCE August 2025: Very Slow Fuse 9-26-25