
Market Commentary: Asset Returns 9-28-25
We saw setbacks in equities and duration this week and a sudden dose of caution on the pace of easing.


Shutdown risk sets stage for Federal payroll gutting. Then what?
Equities broadly weakened and bonds were under pressure with politics set to converge with economic events this coming week. If OMB head Vought (of Project 2025 fame) follows through on the threat of mass layoffs, shutdowns will generate multiplier effects direct and indirect from payrolls to goods and services (Mini Market Lookback: Market Compartmentalization, Political Chaos 9-27-25).
The reactions to the recent easing of -25 bps and ensuing macro releases and Fed leader speeches have kept many on edge about UST steepening risk as even more tariffs get announced. Based on the final 2Q25 GDP numbers and this past week’s income and outlays, the consumer sector remains at least stable and 3Q25 earnings reports are likely to bring in decent numbers in coming weeks (see PCE August 2025: Very Slow Fuse 9-26-25, 2Q25 GDP Final Estimate: Big Upward Revision 9-25-25).
When you hear major GOP and Trump supporters, such as Ken Griffin of Citadel, challenging the White House on tariffs and Fed independence, the warnings are clear enough on the reality of tariff risk. More of the same could start to derail the false story that “the tariff inflation debate is over” when it will clearly go on for months and quarters. The investment themes and the “trillions and trillions” of incoming investment story lines used to promote tariffs will only play out over years – and decades.
The pending shutdown is a wildcard, and the potential delays of economic releases ahead of key payroll data and a fresh invasion of a major city in a blue state (Portland, OR), and an all-hands-on deck cattle call of the brass by Hegseth means the week ahead brings more drama than last week. This week also will bring more direct impact to economic risks than simply arguing about the 1st Amendment last week.
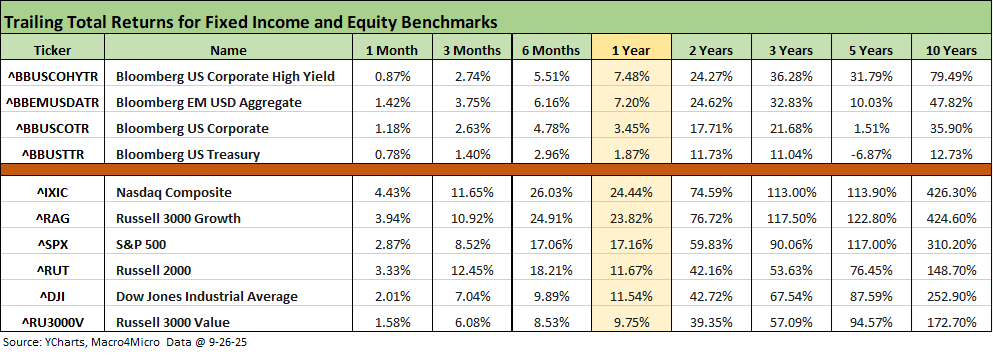
The above table frames the equity and fixed income benchmarks we update each week. Even with a soft week for equities and bonds, we still see the same pattern shown in recent periods. We see all positive numbers except the trailing 5-year returns for UST as the inflation spike and tightening cycle took that timeline return down to -6.87%. The rolling 3-months and 6-months have been impressive periods for equities with decent numbers generated by bonds with the bull steepener and credit spread compression in 2025.
The fear rolling into the fall includes worry over payroll pressures (a shutdown will not help), stubborn inflation metrics, a wave of additional tariffs tied to national security (Section 232), and the potential for SCOTUS to overrule the appeals court on IEEPA.
SCOTUS pushing back on Trump’s sustained expansion of executive power and his ambitions for a free hand for just about anything (troops into cities, line-item erasures of legislated budgets, etc.) might only coincide with Sasquatch riding down the Potomac on the back of the Loch Ness Monster. Basically, the odds for IEEPA to get scuttled by this mix of black robes is quite low. We will find out in November.
The wave of tariffs ahead also come against the backdrop of weaker payrolls and slowing PCE growth vs. 2024 in the GDP lines as well as weak fixed asset investment (see 2Q25 GDP Final Estimate: Big Upward Revision 9-25-25). The distortion of import swings and inventory investment make the headline GDP numbers less than useful. We focus on PCE (68% of GDP) and Gross Private Domestic Investment (GPDI at 18% of GDP). Good luck trying to get the White House to narrowly discuss those GDP lines (especially Kevin Hassett).
The rolling return visual
In the next section, we get into the details of the 32 ETFs and benchmarks for a mix of trailing periods. Below we offer a condensed 4-chart view for an easy visual on how the mix of positive vs. negative returns shape up. This is a useful exercise we do each week looking for signals across industry groups and asset classes.
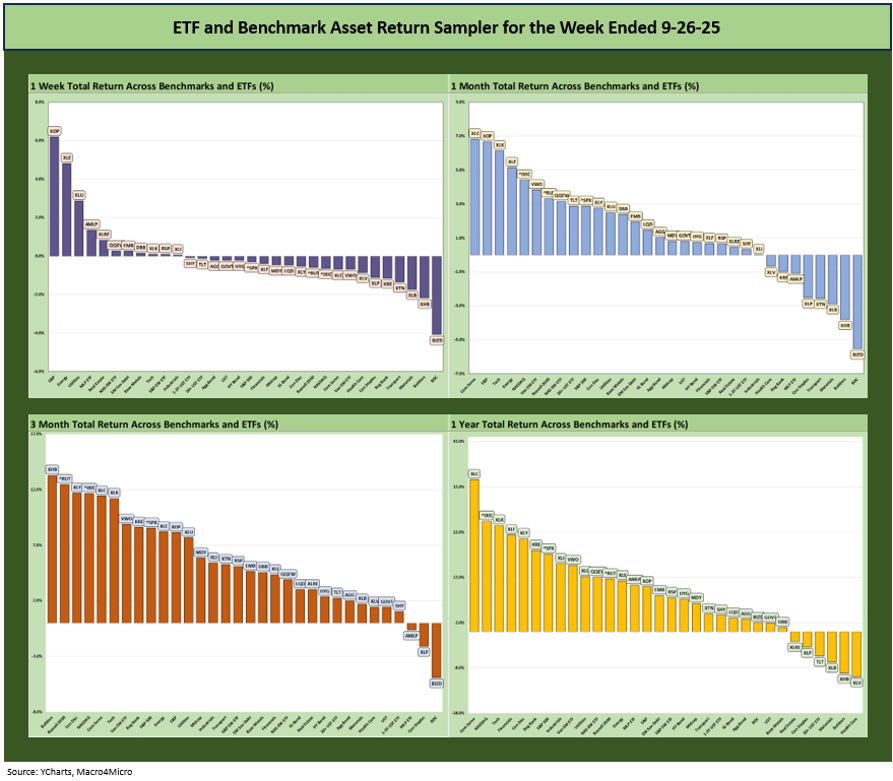
The past two weeks have seen the symmetry of the weekly returns moving in the wrong direction but the rolling 3 and 6 months, YTD (shown below) and LTM periods remain very positive with a solid set of numbers in 2025 trying to match the numbers posted in 2024 and 2023 in the S&P 500.
The Magnificent 7 heavy ETFs…
Some of the benchmarks and industry ETFs we include have issuer concentration elements that leave them wagged by a few names. When looking across some of the bellwether industry and subsector ETFs in the rankings, it is good to keep in mind which narrow ETFs (vs. broad market benchmarks) get wagged more by the “Magnificent 7” including Consumer Discretionary (XLY) with Amazon and Tesla, Tech (XLK) with Microsoft, Apple, and NVIDIA, and Communications Services (XLC) with Alphabet and Meta.
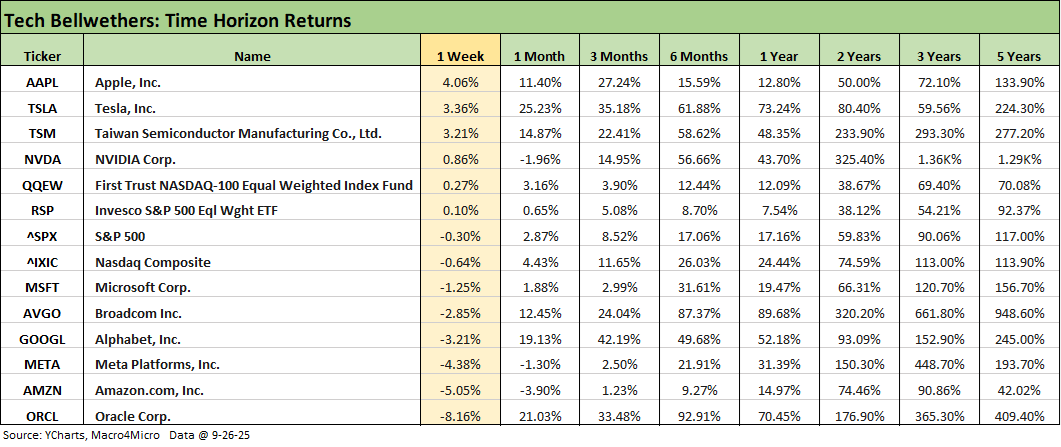
We already looked at the tech bellwethers in our Mini Market Lookback: Market Compartmentalization, Political Chaos (9-27-25). The Hi-Lo ranges were high this week with Oracle on the bottom and Apple on top. The AI investment themes will keep facing nerves on valuation since this does generate compare-and-contrast with the late 1990s TMT bubble. An important distinction is that the financial health and asset protection of the new wave of high flyers dwarfs some of the TMT bubble names of 1999 when NASDAQ posted a +86% return.
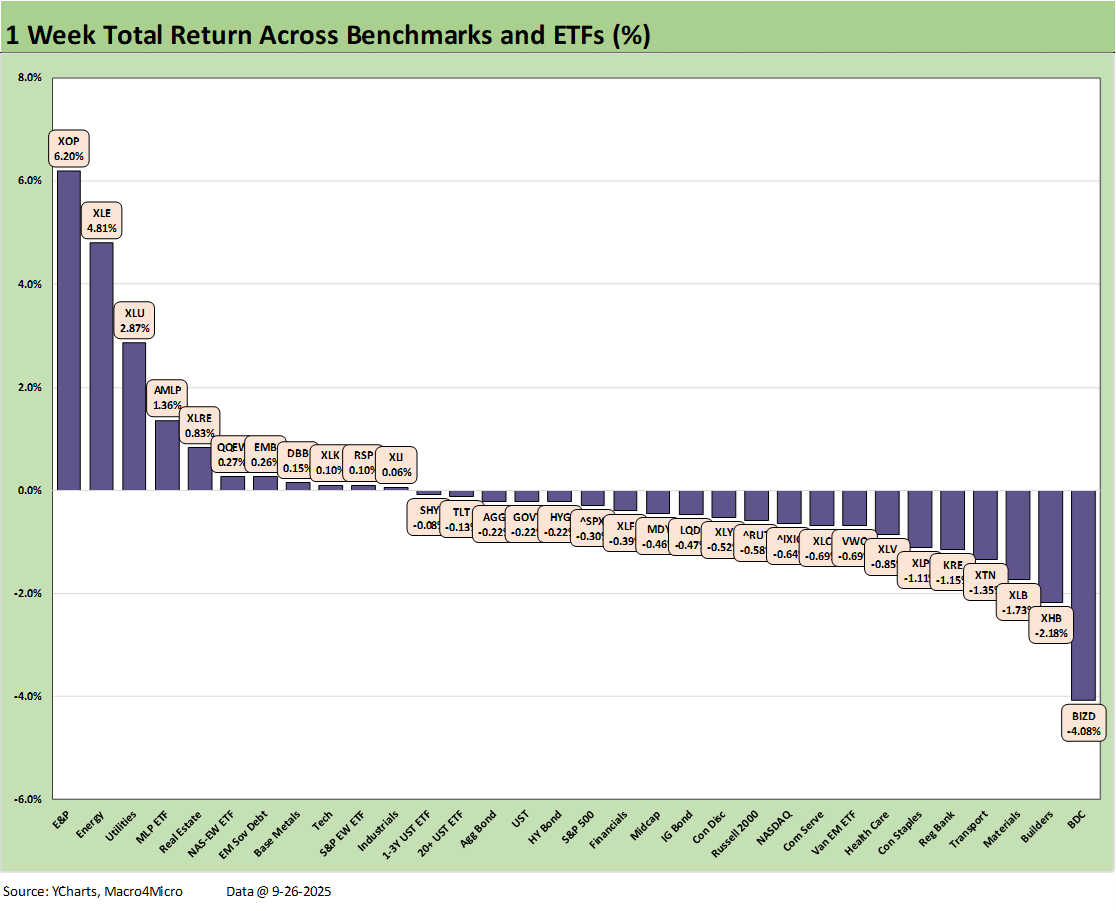
We already looked at the tech bellwethers in our Mini Market Lookback: Market Compartmentalization, Political Chaos (9-27-25). Energy mounted a comeback this week with E&P (XOP), diversified Energy (XLE), and Midstream (AMLP) in 3 of the top 4 slots with the Utilities ETF (XLU) at #3. The outlier on the low end was the BDC ETF (BIZD) as the recent auto headlines (Tricolor, First Brands) highlighted some credit stress that raised alarms and set off the usual “What’s next?” speculation.
The recurring weakness in oil has helped the headline CPI numbers along the way in 2025, and the hope for the consumer is that such favorable supply-demand balances can be sustained on the basis of supply and not weaker demand (implying a weaker global economy). The fears of an oil glut hit the screen all the time, but Russian supply as a wildcard (Ukraine strikes, India’s role, Trump pressuring EU, etc.) and poor economics for drilling in the US at current prices always keeps the debate alive.
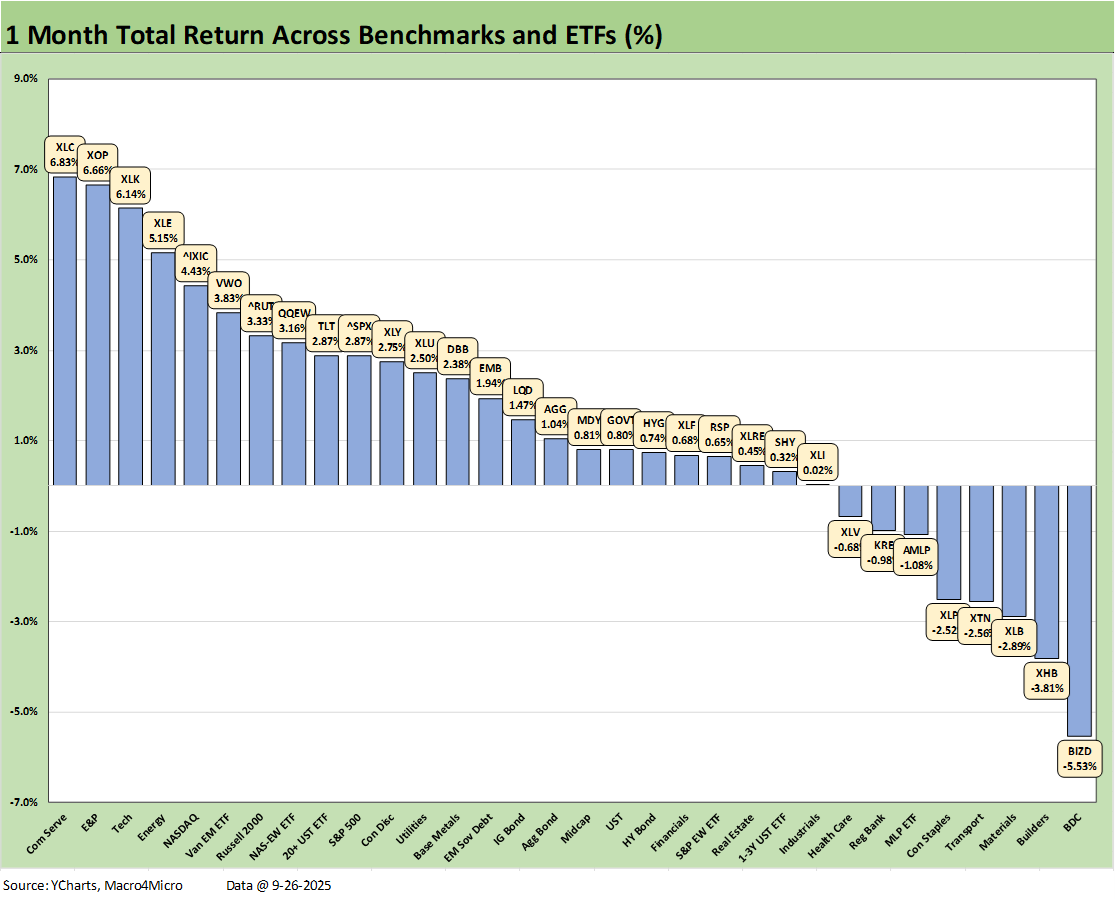
The 1-month total return time horizon weighs in at 24-8 with a strong tech-centric presence in the top quartile with the Communication Services ETF (XLC) at #1, the Tech ETF (XLK) at #3, NASDAQ at #5, and the Equal Weight NASDAQ 100 ETF (QQEW) at #8. The oil and gas chain of ETFs can be notoriously volatile, and we see XOP and XLE both push into the top 5 this week.
The small cap Russell 2000 has been making a push in recent weeks and worked its way into the top quartile for 1-month and the #2 ranking over 3-months (next chart) and into the second quartile YTD after being mired in the bottom quartile at earlier points in the year.
Even though bond ETFs are coming off a tough week, we see TLT just miss the top quartile for the month with 4 of the 7 bond ETFs in the second quartile and 3 bond ETFs in the third quartile. The bottom of the list shows a weak month for the BDC ETF (BIZD) and Homebuilder ETF (XHB). The cyclical Materials ETF (XLB), Transports (XTN), and the defensive and rate-sensitive Consumer Staples ETF (XLP) also were in the bottom quartile.
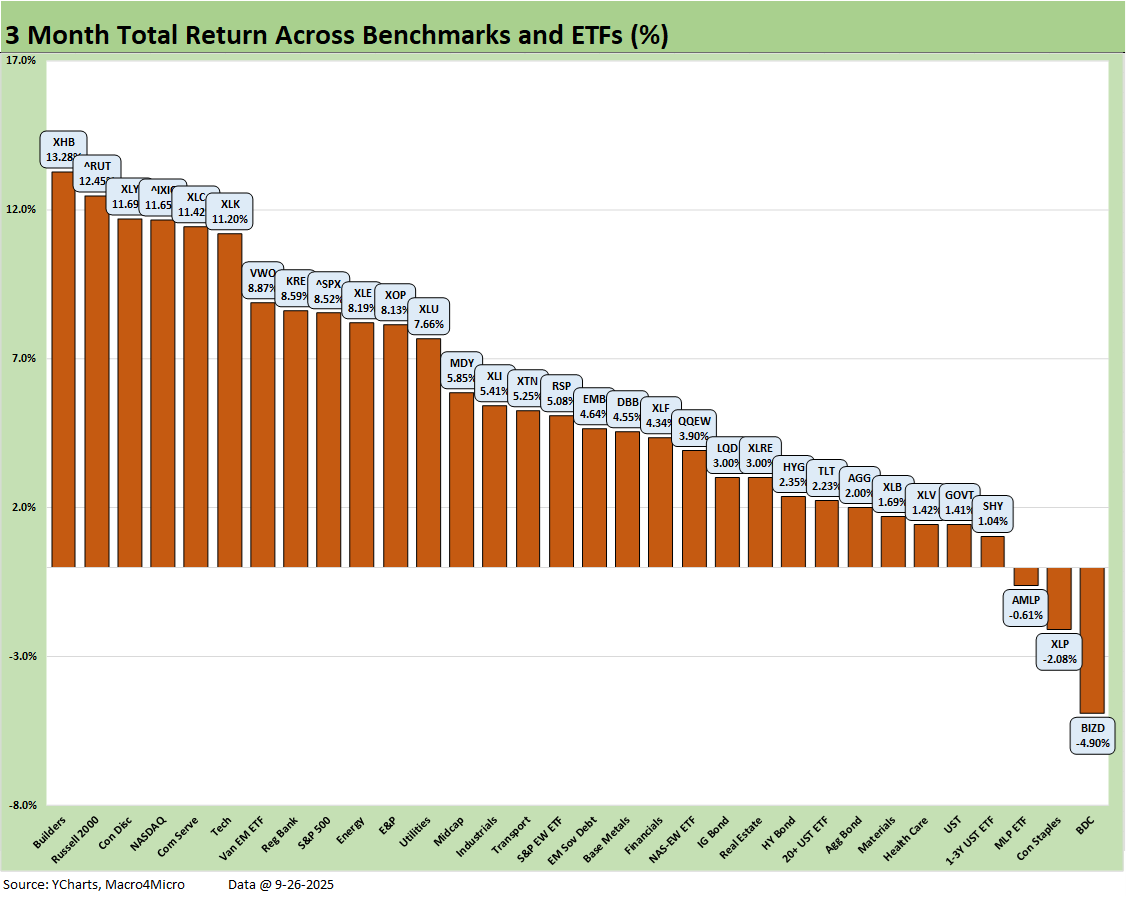
The 3-month run shows a score of 29-3 with a very strong period for equities as we are 6 months past the April Liberation Day chaos. In the meantime, a good 2Q25 earnings season is now under the market’s belt with one FOMC easing action.
Trade conflicts were scarce as the EU resistance (resolve?) melted away, China went into truce mode (still ongoing), Mexico got a reprieve, Canada is a protracted work in progress, and legal action against IEEPA had a temporary victory. The Japan and South Korea details have shown some inconsistencies in what each side represents, but the main point is that imminent clashes and disruptions have been avoided.
The top quartile above shows Homebuilders (XHB) back on top with small cap Russell 2000 at #2 with Consumer Discretionary (XLY) at #3. That is a reassuring mix and underscores this market is not just about the “Mag 7 plus” story that dominates large cap indexes. That said, the tech names play a leading role in the large cap benchmarks. In the above chart, we see NASDAQ, Communications Services (XLC), and Tech (XLK) in the top quartile with Consumer Discretionary (XLY,) which includes Amazon and Tesla.
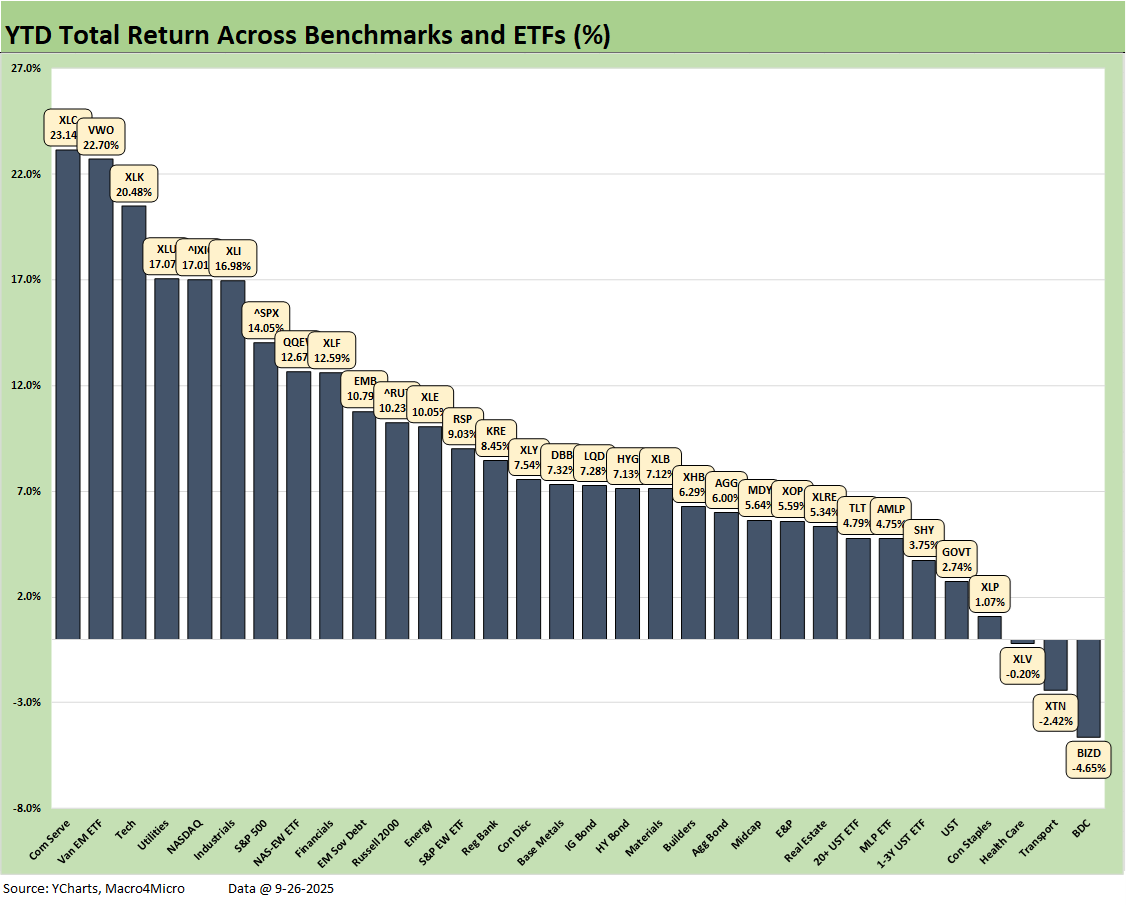
The YTD returns are holding in at 29-3 or the same as the 3-month score. For YTD, only BDCs (BIZD), Transports (XTN), and Health Care (XLV) are in negative range. In the top quartile, we see Communications Services (XLC) at #1, Tech (XLK) at #3, NASDAQ at #5, the “Mag 7 plus” heavy S&P 500 at #7, and the Equal Weight NASDAQ 100 (QQEW) at #8. Utilities (XLU) squeezed into the Top 5. EM Equities (VWO) was at #2 and Industrials (XLI) at #6 to add a dash of diversity – but not much.
We see bond ETFs spread across the 2nd, 3rd, and bottom quartile. The short duration UST ETF (SHY) and long duration UST (TLT) both are in the bottom quartile with GOVT. Credit performed better with EM Sovereigns in the 2nd quartile, and Corporates (LQD), HY (HYG), and AGG in the third quartile.
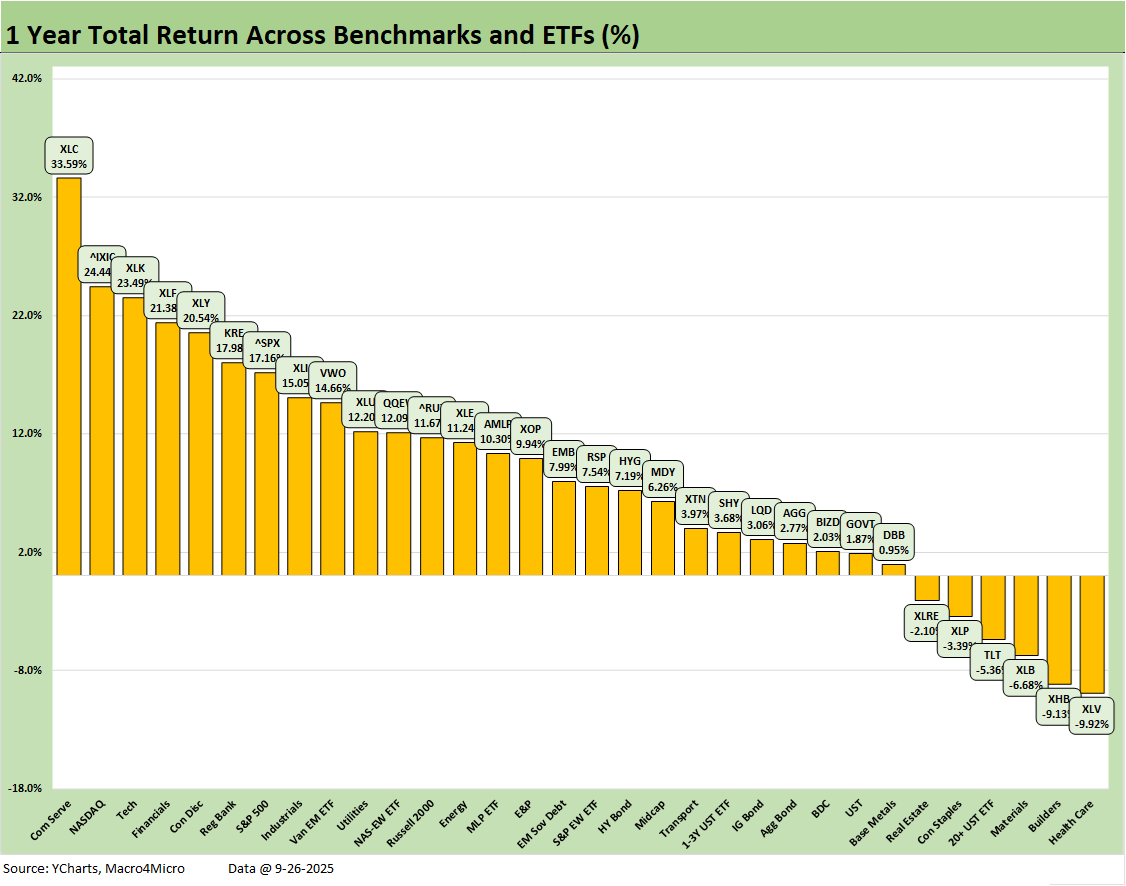
The 1-year returns stood at 26-6 this week after 25-7 last week after 28-4 the prior week. The Health Care ETF (XLV) was once again on the bottom at -9.9%. Homebuilders (XHB) are next to last at -9.1% given a full year after the sharp sell-off that started in 4Q24 before the recent rally. We see the cyclical Materials ETF (XLB) at -6.7% and the long duration UST ETF (TLT) at -5.4%. The interest rate sensitive Consumer Staples ETF (-3.4%) and Real Estate ETF (XLRE) round out the ETFs in the red zone.
Communications Services (XLC) holds down #1 at +33.6% and keeps pulling away from the pack, with NASDAQ at #2 with +24.4%, the Tech ETF (XLK) at #3 at +23.3%, Financials (XLF) at #4 with +21.4%, and Mag 7 heavy Consumer Discretionary (XLY) at #5 with +20.5%. The top quartile is clearly more tech heavy including the S&P 500 with its tech concentration, but we do see diversification with the presence of Financials (XLF), Regional Banks (KRE), and Industrials (XLI) in the top quartile.
The S&P 500 at a run rate stands at 17.2% over 1-year (14.1% YTD 2025), so the S&P 500 will need to finish 2025 in impressive fashion to move from 14.1% to 25% for the year to match the 2024 and 2023 S&P 500 returns. That will take almost 11 points of return to get to 25%. It is doable, but it needs good news.
The year 2024 was Part Two of the best 2-year run in the S&P 500 since the late 1990s, so that sets a high bar (see Footnotes & Flashbacks: Asset Returns for 2024 1-2-25). The S&P 500 return of +25% for 2024 (26% 2023) will be very hard to match in 2025-2026. Trump says the US was a dead country 9 months ago, but that raised the stakes on hitting those marks while selling that story line.
The S&P 500 will need a very strong finish in 4Q25 to match those “dead” years of 2024 and 2023. The current economy is also lagging on key GDP lines and is well behind the PCE line of GDP in 2024, which is 68% of GDP. The investment numbers in the GDP lines also do not match up with the “trillions in foreign investment” story line. Those still need to show up in the numbers.
See also:
Mini Market Lookback: Market Compartmentalization, Political Chaos 9-27-25
PCE August 2025: Very Slow Fuse 9-26-25
Durable Goods Aug 2025: Core Demand Stays Steady 9-25-25
2Q25 GDP Final Estimate: Big Upward Revision 9-25-25
New Homes Sales Aug 2025: Surprise Bounce, Revisions Ahead? 9-25-25
Credit Markets: IG Spreads Back in the Clinton Zone 9-22-25
The Curve: FOMC Takes the Slow Road 9-21-25
Market Commentary: Asset Returns 9-21-25
Mini Market Lookback: Easy Street 9-20-25
FOMC: Curve Scenarios Take Wing, Steepen for Now 9-17-25
Home Starts August 2025: Bad News for Starts 9-17-25
Industrial Production Aug 2025: Capacity Utilization 9-16-25
Retail Sales Aug 2025: Resilience with Fraying Edges 9-16-25
Credit Markets: Quality Spread Compression Continues 9-14-25
The Curve: FOMC Balancing Act 9-14-25
Footnotes & Flashbacks: Asset Returns 9-14-25
Mini Market Lookback: Ugly Week in America, Mild in Markets 9-13-25
CPI August 2025: Slow Burn or Fleeting Adjustment? 9-11-25
PPI Aug 2025: For my next trick… 9-10-25
Mini Market Lookback: Job Trends Worst Since COVID 9-6-25
Payrolls Aug 2025: Into the Weeds 9-5-25
Employment August 2025: Payroll Flight 9-5-25
JOLTS July 2025: Job Market Softening, Not Retrenching 9-3-25