Footnotes & Flashbacks: State of Yields 1-19-25
The recent UST rally is the undercard to the coming bouts against tariff price impacts, deportation disruptions, and UST supply.
I see the sun. The rest will be fine. Maybe.
The 1-week bull flattener after constructive CPI numbers is a warm-up for the coming trade and supply chain challenges and how those get apportioned across corporate sector expenses, end user prices, and what actions trade partners are willing to take to fight back (and on what scale) as they assess their domestic political risks.
The murky conceptual spin around tariffs, deportation, currency doubletalk (the dollar is strong and will offset tariffs, but the dollar will also be weak and support exports even in the face of retaliation, etc.) would get you in trouble on an econ test in college, but the Senate is not big on probing such issues in nominee Q&A.
We update the 3M to 5Y UST slope as the discussion around the rush from cash to extend duration or take more fundamental risk remains a debate with the unpredictable moving parts ahead.
The above chart updates the weekly UST migration chart we use from the Carter inversion of 1978 on through some key cyclical dates for the credit markets and broader economy. We focus more on the pre-crisis, pre-ZIRP years for less FOMC-driven distortions but include the peak post-crisis date of 10-19-23 for the UST curve. That was when the 10Y UST hit a peak just under 5%. We detail the actual UST yields in the box, but the visual tells a story of how extremely low current UST rates are in historical context.
The big UST call for 2025 is whether the 10Y and 30Y UST will move back toward the 10-19-23 peak or flatten out more. The daily debate on fed funds and the timing of the next ease will lead the headlines. However, for the broader market in growth stocks, mortgages, and a raft of key industries and asset classes (real estate, income stocks, etc.) the steepening risk looms large.
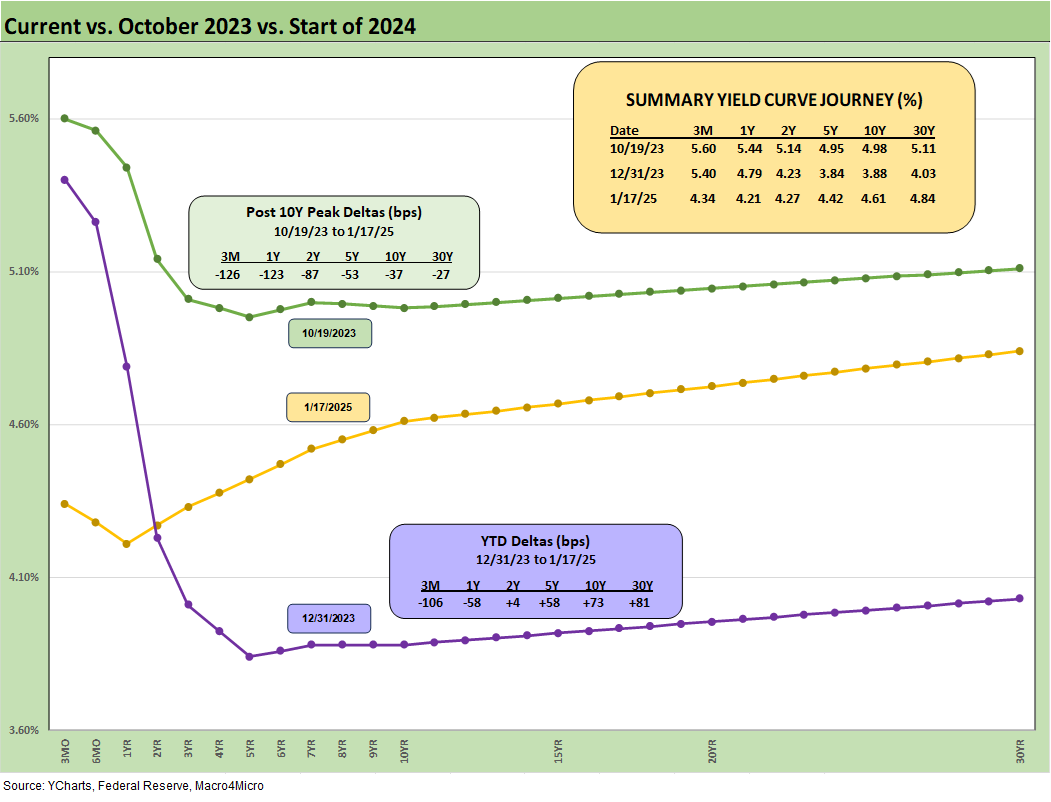
We will keep updating the running UST shifts from the 10-19-23 peak and from the start of 2024 as a reminder of how far the UST has moved over that time frame in some very surprising ways. That is notably the case vs. the consensus expectations in Dec 2023 and how the UST battered duration in 2024. Having a lot of confidence around how tariffs and mass deportation will lead to very predictable results takes an awful lot of confidence.
Asset managers have much at stake while the folks in Washington will make up some new stories and blame anyone but themselves and their policies. We cannot even get the words “buyer pays” out of a trade policy architect or any minions. Facts on trade are now part of the loyalty test, and the Democrats do not box them in during hearings with precise targeted questions.
We are bearish on how the tariffs, deportation and explosion in the budget deficits and UST supply will play out for the UST curve in terms of steepening risk as the year rolls on.
The above chart updates the UST curve migration from 2021 across the tightening cycle and now into the easing cycle with the unfolding bear steepener captured visually at the top of the chart. We include a memory jogger boxes with the tightening timing and magnitude of the moves and now the easing history.
We have covered these histories in detail in numerous past commentaries. We stick to the theme that recent history shows us that longer rates do not have to follow the fed funds move lower (you could get an argument on that not long ago) and that paying attention to normalized slopes and UST supply remains a key exercise as the FOMC eases.
The 1-week deltas shows the bullish reversal from the earlier UST beatdowns with the flattening igniting off the CPI release (see CPI Dec 2024: Mixed = Relief These Days 1-15-25).
We add a new chart this week tracking the UST deltas off the Sept 2024 easing by the FOMC and how that has since turned into a nasty bear steepener from the lows. The visuals and the deltas tell the story.
The above chart updates the scale of the declines on the front end since the end of 2023 and the steepening and higher rates out past 2Y to 30Y. That was definitely not the consensus back in Dec 2023 even after the monster UST rally of Nov-Dec 2023.
The UST deltas since the peak 10Y date of 10-19-23 is broken out above. At some point, we will shift away from this chart on the “old news” rule. That said, watching where the 10Y and 30Y stand in that context is interesting in framing how UST buyers feel about inflation and supply.
The peak 10Y number is obviously important considering we had hit the 8% area 30Y mortgages during fall of 2023 after the earlier peak of the tightening cycle. We have seen 30Y mortgages run around 100 bps higher since Sept 2024, so it is too early to get overconfident with so many tectonic policy effects ahead.
The above chart updates the recent UST shifts and 30Y mortgage moves. We plot the history of the 10Y UST and Freddie Mac 30Y mortgage in Mini Market Lookback: The Upside of Volatility (1-18-25) that shows the fall 2023 peaks. The chart also frames the recent UST and 30Y mortgage rates in the context of the housing bubble by including the Freddie Mac benchmarks and UST curves during the peak homebuilding year of 2005 and mid 2006 when the UST curve shifted higher and nervousness was starting to make its way into the RMBS markets on subprime quality.
One interesting takeaway is that the UST curve is materially lower today than mid 2006 but current mortgage rates are higher. Freddie moved back across the 7.0% line this week and followed some other mortgage surveys that were already there.
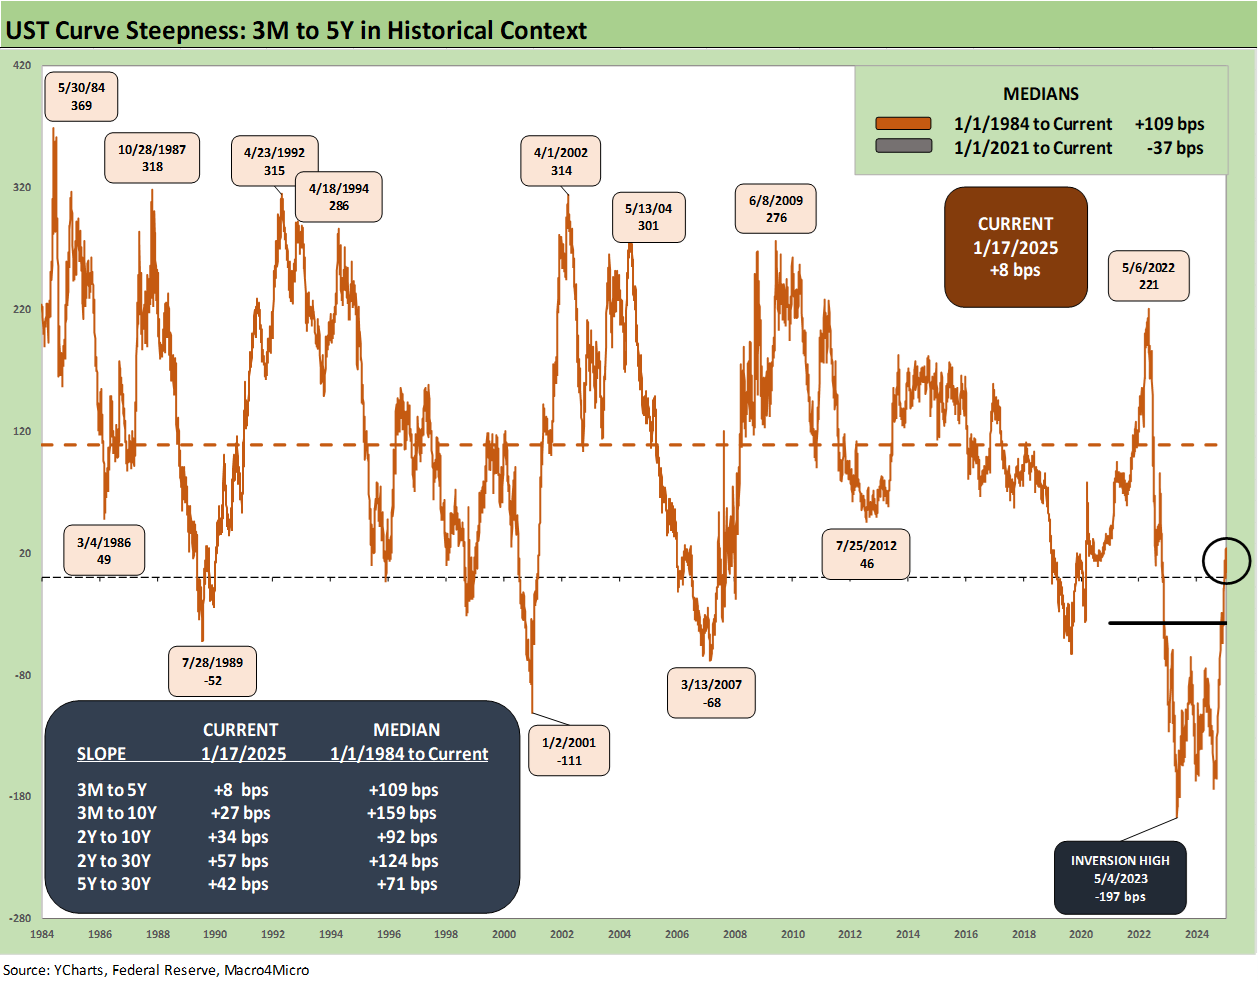
We update the long-term history for the 3M to 5Y UST slope which is now back in upward sloping mode at +8 bps with the easing moves since the fall and the adverse move in the 5Y UST of +100 bps as detailed above in an earlier chart.
Extending duration has been an expensive move this year, and the potential is there for cash equivalents to hang around the 4% handle for a while with a low term premium. The considerable curve slope uncertainty says, “you don’t have to rush.”
The long-term median as noted above for 3M to 5Y is +109 bps. The last Fed forecast moved the consensus for 2025 fed funds higher by +50 bps than in the Sept 2024 forecast. That in turn rattled the markets (see Fed Day: Now That’s a Knife 12-18-24). The backdrop also leaves a lot of uncharted territory to work through in the weeks and months ahead.
The above slope history on 3M to 5Y UST shortens the timeline to begin in early 2021 before ZIRP ended. We see the wild ride across the inflation/tightening/easing period with a peak slope of +221 bps in May 2022 to a peak inversion of -197 in May 2023 and now back up to a positive slope on the combination of easing on the front and a bear steepener out beyond 2Y UST.
We wrap this week’s State of Yields with the running UST deltas since the beginning of March 2022, which is the month ZIRP ended (effective 3-17-22). As one would expect, the current curve is clearly much higher than those early days and closer to the 10-19-23 peak than the pre-tightening period. The UST curve is below the highs of Oct 2023 but upward sloping vs. inverted.
See also:
Footnotes & Flashbacks: Asset Returns 1-19-25
Mini Market Lookback: The Upside of Volatility 1-18-25
Housing Starts Dec 2024: Good Numbers, Multifamily Ricochet 1-17-25
Industrial Production Dec 2024: Capacity Utilization 1-17-25
Retail Sales Dec 2024: A Steady Finish 1-16-25
CPI Dec 2024: Mixed = Relief These Days 1-15-25
KB Home 4Q24: Strong Finish Despite Mortgage Rates 1-14-25
United Rentals: Bigger Meal, Same Recipe 1-14-25
Footnotes & Flashback: Credit Markets 1-13-25
Footnotes & Flashbacks: State of Yields 1-12-25
Footnotes & Flashbacks: Asset Returns 1-12-25
Mini Market Lookback: Sloppy Start 1-11-25
Payroll Dec 2024: Back to Good is Bad? 1-10-25
US-Canada: Tariffs Now More than a Negotiating Tactic 1-9-25
Payroll % Additions: Carter vs. Trump vs. Biden…just for fun 1-8-25
JOLTS: A Strong Handoff 1-7-25
Annual GDP Growth: Jimmy Carter v. Trump v. Biden…just for fun 1-6-25
Mini Market Lookback: Mixed Start, Deep Breaths 1-5-25
Footnotes & Flashbacks: Credit Markets 2024 1-3-25
Footnotes & Flashbacks: Asset Returns for 2024 1-2-25
HY and IG Returns since 1997 Final Score for 2024 1-2-25
Spread Walk 2024 Final Score 1-2-25
Footnotes & Flashbacks: Asset Returns for 2024 1-2-25
Credit Returns: 2024 Monthly Return Quilt Final Score 1-2-25
Annual and Monthly Asset Return Quilt 2024 Final Score 1-2-25
HY and IG Returns since 1997: Four Bubbles and Too Many Funerals 12-31-24
Mini Market Lookback: Last American Hero? Who wins? 12-29-24
Spread Walk: Pace vs. Direction 12-28-24
Annual and Monthly Asset Return Quilt 12-27-24
Credit Returns: 2024 Monthly Return Quilt 12-26-24


