
Footnotes & Flashbacks: Asset Returns 1-19-25
A banner week in equities and debt after a rough stretch does not change the need to “solve for X” in tariffs, retaliation, and deportation.


It’s still about the landing…more twists ahead….
The week brought a shutout favoring good news at 32-0 in positive returns across the benchmarks and ETFs we watch.
Critical variables should get more visibility this week on tariffs with some signals on the scale of deportations with any commentary that follows the headline coverage of a (rumored) plan for large scale ICE raids in Chicago and possibly San Diego.
For the week, the breadth of favorable equity returns was impressive across industrials, energy and rate-sensitive sectors with the tech-centric and Mag 7 wagged ETFs and benchmarks not the main event in the top tier. The “rotation” debate gets revisited.
Macro variables abound and a fresh round of debt-ceiling clashes will give UST supply watchers much to ponder on reading legislative risks ahead.
Among life’s strange ironies, Inauguration Day this year falls on MLK Day at a time when there is a lot of political strife in the country and more than a few memories of racial tension and protests during Trump 1.0 (see Martin Luther King Jr.—MLK was a Fact, Not a Theory 1-15-24). Jan 6 included a lot of Confederate flags and the usual White Supremacists and even Nazi sympathizers as the Auschwitz T-Shirt made a statement (see 2024 Must be a Year when Facts Matter: The Significance of Jan 6 1-6-24). In good times or bad, partisan unity or “political war,” the beat goes on in the markets.
With a new team taking the helm in the White House and Senate and the House holding the line with GOP control, politics and economics will converge in a way not seen in a long time (arguably since the New Deal). There are not a lot of direct comps in the modern capital markets era for the array of changes that could unfold across economic policy and global trade.
While it can be easily argued about, we would start the “modern capital markets era” at the end of the 1970s with Volcker, stagflation and waves of deregulation and disintermediation in banking, the soaring scale of securities markets, and the evolution of asset management (notably mutual funds) that followed and seemed to go nonstop into the 1990s.
As Trump gets ready to roll into the White House on Monday, we look at the last week of pre-Trump/Biden era asset returns below.
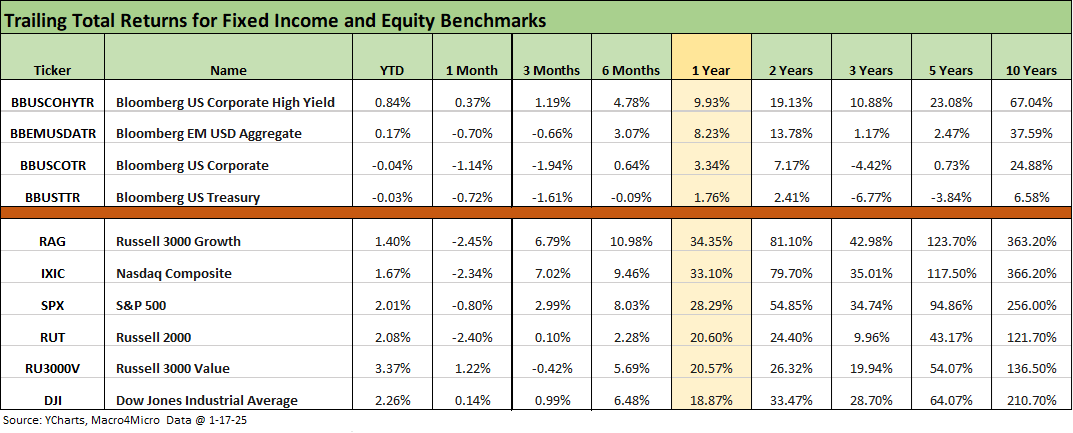
In the above chart, we update our high-level equity and debt benchmark returns across time horizons above. We line them up in descending order of total returns for the trailing 1-year period.
The chart is notably different than last week and glaringly so in equities with the YTD equity return column all positive vs. all negative last week. The 1-month equity return mix is 4 out of 6 in negative range vs. all negative last week. Looking back 1 year, the equity mix above shows 5 out of 6 above 20% vs. 3 out of 6 last week. That winds down a very positive LTM period for Biden’s exit with returns that have not seen in back-to-back years since Clinton. Looking back 2 years, we see the Russell 3000 Growth index at a +80% handle with NASDAQ just behind it.
The debt returns are trying to climb out of the duration hit taken in 2024 and YTD 2025, and we see 2 lines back in positive range YTD again with only 1 line positive for 1-month. Those were all negative last week. Bonds are slowly regrouping from the UST curve bear steepener with credit spreads tighter in HY this past week (see Mini Market Lookback: The Upside of Volatility 1-18-25).
Looking back across the LTM period, HY has the bragging rights of total returns just shy of the long-term nominal return on equities. HY factors in less duration exposure, higher coupons and spread compression.
Meanwhile, IG Corporates are showing the wear and tear of duration (see HY and IG Returns since 1997: Four Bubbles and Too Many Funerals 12-31-24, Annual and Monthly Asset Return Quilt 12-27-24). IG spreads are also in line with past credit cycle peaks.
The rolling return visual
In the next section, we get into the details of the 32 ETFs and benchmarks for a mix of the trailing periods. Below we offer a condensed 4-chart view for an easy visual on how the mix of positive vs. negative returns shape up. This is a useful exercise we do each week looking for signals across industry groups and asset classes. We also have a YTD version that we include in the broader commentary on the time horizons further below.
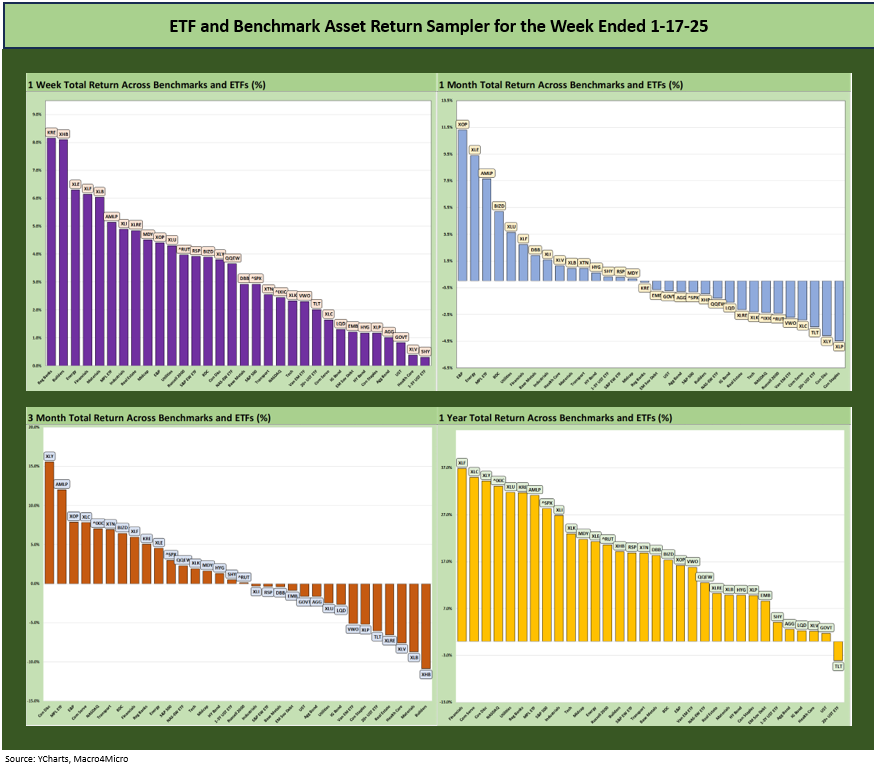
The symmetry of returns improved notably this week, but 1-month and 3-months are still a decidedly mixed bag as we review below. The 1-year horizon is overwhelmingly positive except for the long duration UST ETF at 31-1.
The Magnificent 7 heavy ETFs…
Some of the benchmarks and industry ETFs we include have issuer concentration elements that leave them wagged by a few names. When looking across some of the bellwether industry and subsector ETFs in the rankings, it is good to keep in mind which narrow ETFs (vs. broad market benchmarks) get wagged more by the “Magnificent 7” including Consumer Discretionary (XLY) with Amazon and Tesla, Tech (XLK) with Microsoft, Apple, and NVIDIA, and Communications Services (XLC) with Alphabet and Meta.
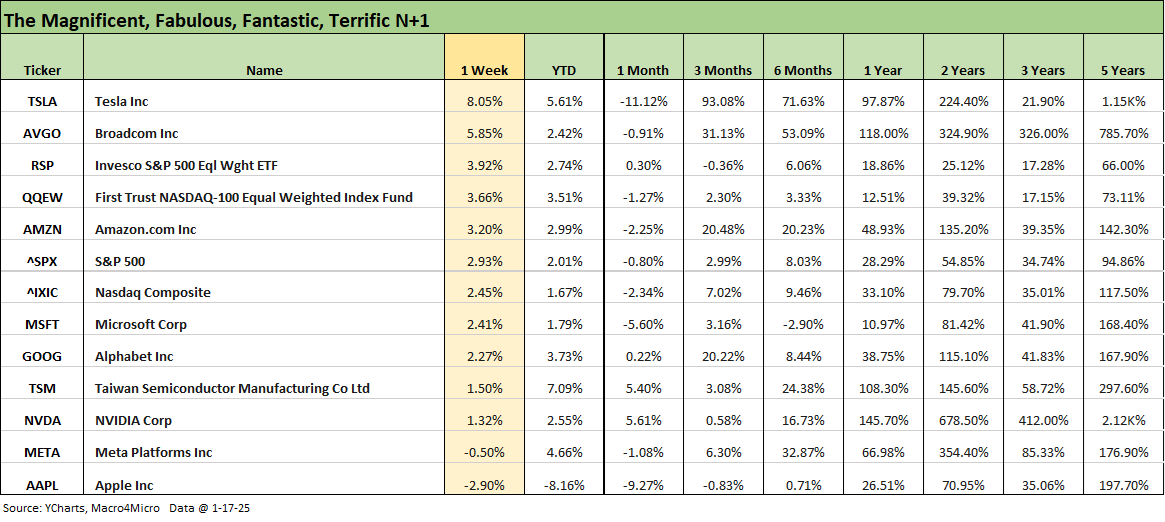
The above chart updates the tech bellwether running returns lined up in descending order of weekly returns. We looked at these numbers in detail in our weekly Mini Market Lookback: The Upside of Volatility (1-18-25).
Tech was not the main event this past week with only 2 Mag 7 names beating the S&P 500 and only 1 Mag 7 name beating the Equal Weight S&P 500 ETF (RSP), which outperformed the cap-weighted S&P 500 with its heavy Mag 7 influence. Breadth and the rebound in interest rate sensitive industries, energy, and financials were the main events as highlighted in the 1-week return details further below.
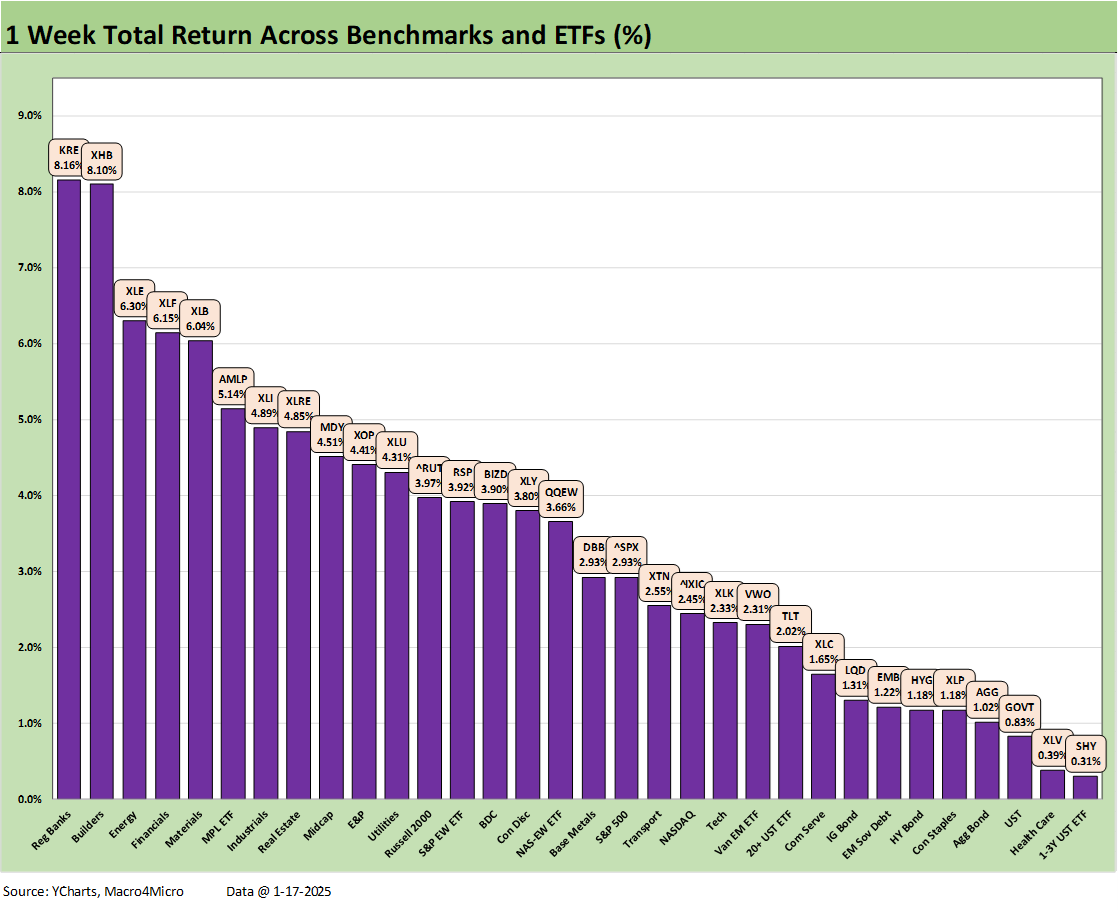
The 1-week return mix across the 32 benchmarks and ETFs we track came in at 32-0. We discuss the trends in detail in our Mini Market Lookback: The Upside of Volatility (1-18-25). Financials, homebuilders, energy, materials, industrials, and real estate rallied off the CPI news and constructive economic releases across retail sales, industrial production, and housing starts among others.
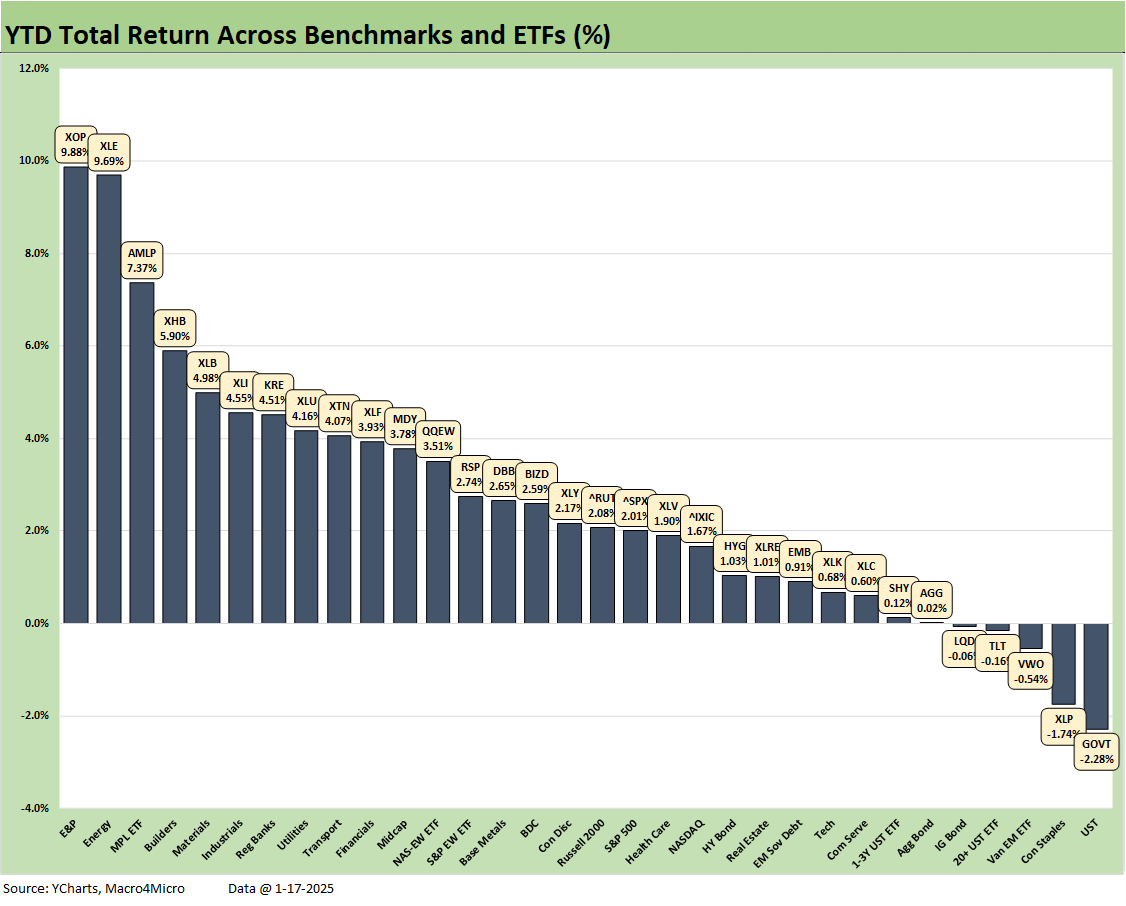
The YTD performance posted a score of 27-5 with 3 negative returns from bond ETFs (GOVT, TLT, LQD), 1 from EM equities (VWO), and 1 from defensive income stocks in Consumer Staples (XLP). For the YTD period, the UST curve has been driving the bus, and there is a lot of scenario-spinning to play out around inflation and the scale of the budget deficit.
The YTD returns show energy-related ETFs holding down the top 3 position with E&P (XOP) at #1, the broad Energy ETF (XLE) at #2, and the income heavy Midstream ETF (AMLP) at #3. The rest of the top quartile shows the big rebound of the past week for Homebuilders (XHB) at #4 with Materials (XLB) just below builders at #5 and Industrials (XLI) at #6 as the words “breadth” and “rotation” reappear. Regional Banks (KRE) rebounded this week, and the very steady Utilities ETF (XLU) rounds out the top quartile.
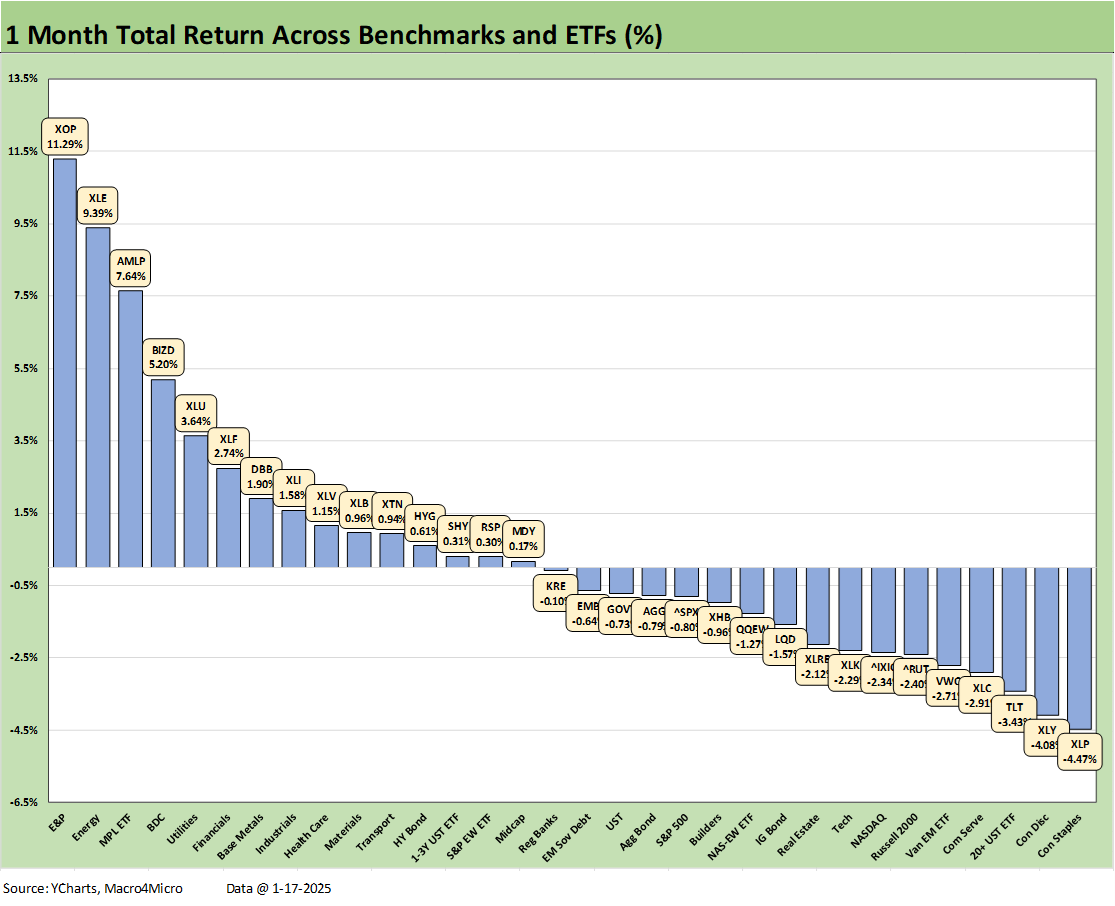
The 1-month return mix weighed in at 15-17 in a more balanced mix of positive vs. negative. Interestingly, the top tier has no tech-centric line items or Mag 7 heavy benchmarks. We see energy related ETFs holding down the top 3 slots with the income heavy BDC ETF (BIZD) at #4 and Utilities (XLU) at #5. The top quartile is rounded out by Financials (XLF), Base Metals (DBB) on some recent China optimism, and finally with the recent Industrial rally pushing XLI into the top tier.
Sitting on the bottom tier is a diverse mix of tech exposure and interest-rate-sensitive lines such as Consumer Staples (XLP) and the long duration UST (TLT) with a smattering of tech heavy names such as the Tech ETF (XLK), NASDAQ (IXIC), and Communications Services (XLC). Small caps (RUT) had fallen off the rotation bandwagon while the EM equities ETF (VWO) was hit by the UST curve.
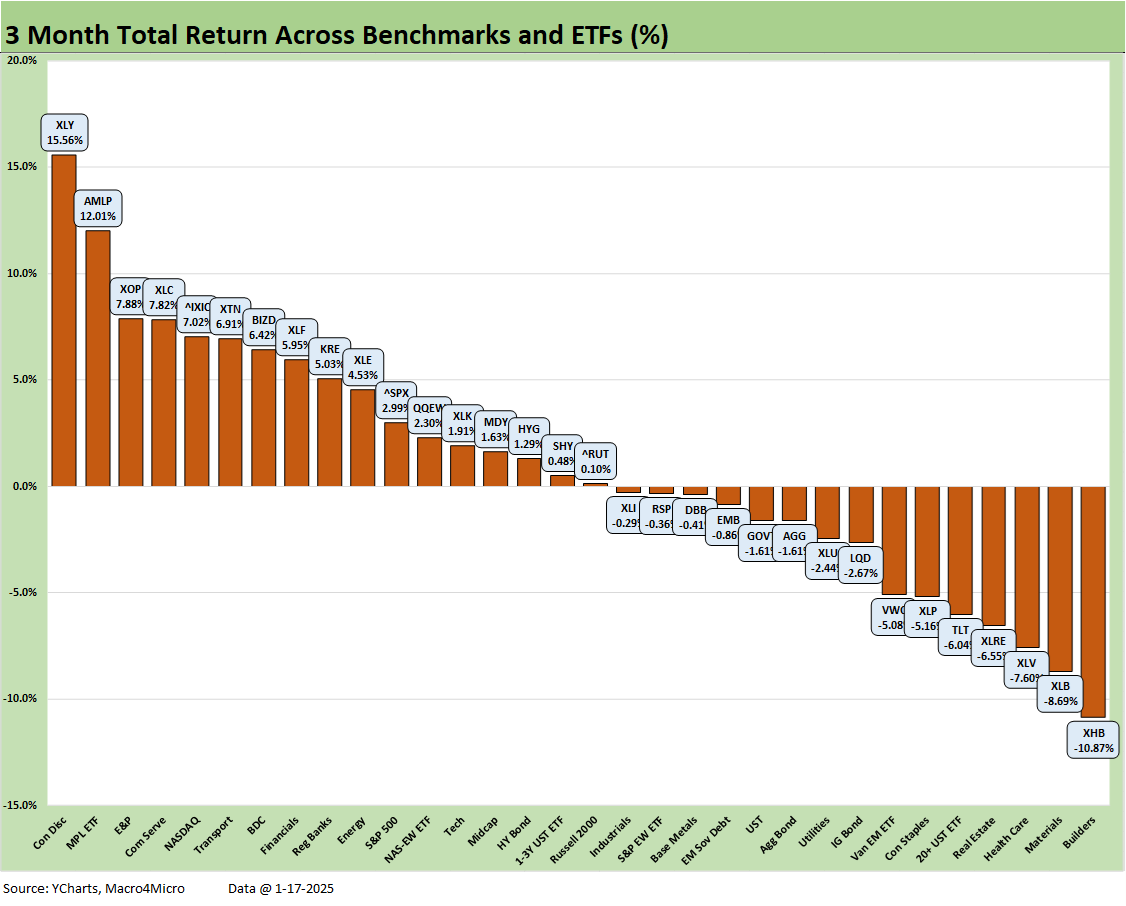
The 3-month mix posted a 17-15 score on positive vs. negative. We see Consumer Discretionary (XLY) at #1 with the amazing TSLA numbers and solid Amazon performance as detailed above in the tech bellwethers table. We see Communications Services (XLC) at #4 and the NASDAQ at #5 in the top 5 despite the later fade in tech.
Midstream Energy (AMLP) at #2 with its high dividend yield (7.2%) pushes through UST volatility while strong fundamentals are also expected to benefit from Trump policies targeting crude oil and LNG export expansion which in turn brings more transportation volume and processing revenues. Midstream is followed by E&P (XOP) at #3 where pure commodity price action is the main event with an assist to expected volume trends.
The resilience of the BDC ETF (BIZD) is notable as a high dividend payout (10.7%) cushions returns. The credit cycle keeps getting extended and riskier credit tiers remain hot for now despite some bearish headlines on the direction of some private credit leveraged deals. The range of BDC returns by issuers has been significantly dispersed across a sector that has been seeing both notable winners and losers at the single name level.
Over on the right, we see some UST curve victims. In some cases, the market has been backpedaling on some ETFs after a period of impressive performance such as in Homebuilders (XHB). Materials (XLB) weakened along with Real Estate (XLRE) as the building cycle comes under a cloud on mortgage rates and income stocks get hit.
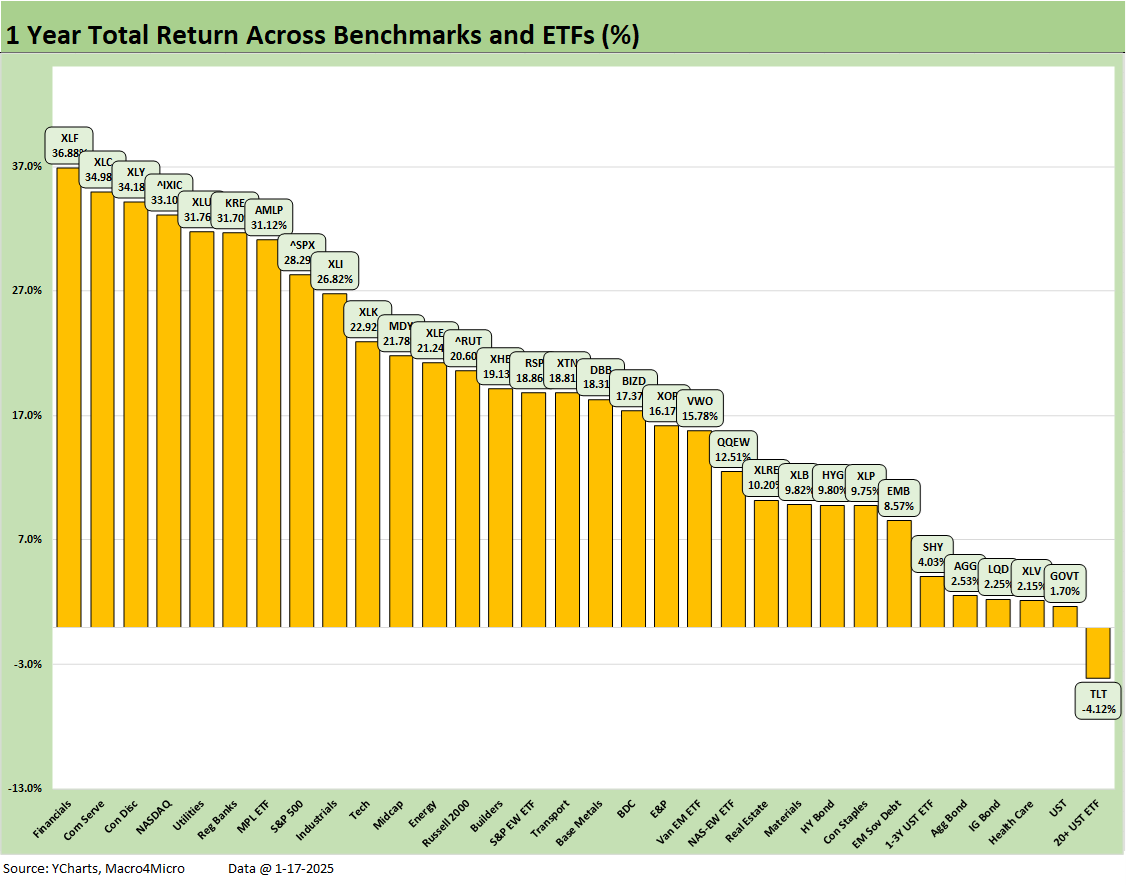
The LTM scoresheet has not seen much change to its score of 31-1 with equities broadly putting up a banner year. We see 2023-2024 earning a place in the history books for back-to-back 20+% years on the S&P 500 for the first time since Clinton in the late 1990s.
We will get 4Q24 GDP later this month. If Biden can score another 3% handle GDP, he will be the only one in the new millennium to get two trifectas of 3 consecutive 3% GDP growth quarters. Trump did it once. Biden had a 4 bagger (4 consecutive 3% GDP quarters) in 2021 even if with a COVID rebound asterisk. The last one to do that was Clinton in 1999 (see Presidential GDP Dance Off: Clinton vs. Trump 7-27-24). I counted 5 distinct 3% GDP trifectas for Clinton and two 4-baggers, so Trump might want to revisit his “best economy since the Big Bang” sales pitch. Reagan’s performance was also much better than Trump’s 1 term (see Presidential GDP Dance Off: Reagan vs. Trump 7-27-24).
For those at home keeping partisan score, only two Presidents since the late 1960s ended their terms (whether 1 term or 2 terms) with no recession at any point in their “reign.” That was Clinton across two terms and Biden across 1 term. Nixon/Ford, Carter in his 1 term, Reagan 2 terms, GHW Bush in his 1 term before Clinton, GW Bush in his 2 terms after Clinton, Obama across his 2 terms, and Trump in his first term all had recession months of varied duration in their terms (see Business Cycles: The Recession Dating Game 10-10-22).
There are always asterisks, qualifiers, and circumstances behind each cyclical backdrop (e.g. inherited recessions, systemic crisis, wars, pandemics, etc.), but using facts is an old habit that seems to fade with the unpleasant times.
See also:
Mini Market Lookback: The Upside of Volatility 1-18-25
Housing Starts Dec 2024: Good Numbers, Multifamily Ricochet 1-17-25
Industrial Production Dec 2024: Capacity Utilization 1-17-25
Retail Sales Dec 2024: A Steady Finish 1-16-25
CPI Dec 2024: Mixed = Relief These Days 1-15-25
KB Home 4Q24: Strong Finish Despite Mortgage Rates 1-14-25
United Rentals: Bigger Meal, Same Recipe 1-14-25
Footnotes & Flashback: Credit Markets 1-13-25
Footnotes & Flashbacks: State of Yields 1-12-25
Footnotes & Flashbacks: Asset Returns 1-12-25
Mini Market Lookback: Sloppy Start 1-11-25
Payroll Dec 2024: Back to Good is Bad? 1-10-25
US-Canada: Tariffs Now More than a Negotiating Tactic 1-9-25
Payroll % Additions: Carter vs. Trump vs. Biden…just for fun 1-8-25
JOLTS: A Strong Handoff 1-7-25
Annual GDP Growth: Jimmy Carter v. Trump v. Biden…just for fun 1-6-25
Mini Market Lookback: Mixed Start, Deep Breaths 1-5-25
Footnotes & Flashbacks: Credit Markets 2024 1-3-25
Footnotes & Flashbacks: Asset Returns for 2024 1-2-25
HY and IG Returns since 1997 Final Score for 2024 1-2-25
Spread Walk 2024 Final Score 1-2-25
Footnotes & Flashbacks: Asset Returns for 2024 1-2-25
Credit Returns: 2024 Monthly Return Quilt Final Score 1-2-25
Annual and Monthly Asset Return Quilt 2024 Final Score 1-2-25
HY and IG Returns since 1997: Four Bubbles and Too Many Funerals 12-31-24
Mini Market Lookback: Last American Hero? Who wins? 12-29-24
Spread Walk: Pace vs. Direction 12-28-24
Annual and Monthly Asset Return Quilt 12-27-24
Credit Returns: 2024 Monthly Return Quilt 12-26-24