
Market Commentary: Asset Returns 10-4-25
A good week for equities and bonds contrasted with a shutdown and too many ticking clocks to more bad news.


Shutdowns usually work out with minor economic impact. Then again…
The week saw the group of 32 benchmarks and ETFs weigh in at 24-8, the UST rallied with the shutdown looking grim, mixed JOLTS, weak labor news (ADP), and negative ISM color among the major risk factors to digest.
The market sentiment compartmentalization trends continue with a shutdown that in substance can only be cured by a small subset of Senate Democrats with the threat of mass layoffs and functional purging. That mass layoff threat appears more about policy desire (Project 2025) than a contingency plan and reaction to the shutdown.
There are plenty of economic data points available to make valuation decisions in debt and equity, but the supply of inputs was materially reduced with the shutdown of so much data across payrolls, GDP (3Q25 is scheduled for 10-30), CPI, PCE, import/export data and more. The 3Q25 earning season is on deck for information (even though Trump is threatening quarterly reporting also for his later purposes).
At some point, the insurance premium mail gets opened, health care costs get transparency on the massive increases, and consumers will react. That comes as Federal layoffs kick into gear with some multiplier effects along with it. ADP showed a major “miss” this past week in payroll trends with negative numbers. Meanwhile, the wave of new and old tariffs will keep working their way into the supplier-to-consumer chain.
All those effects will need to be measured at some point by data providers (BEA, BLS). That is, if the BLS and BEA exist in their current form given the stated goal of Vought et al to consolidate and control that data under the leadership of “like-minded conservatives.” The withdrawal of an utterly unqualified BLS head adds an element of mystery as to what the game plan might be for the BLS and BEA ahead of the 2026 changeover at the Fed.
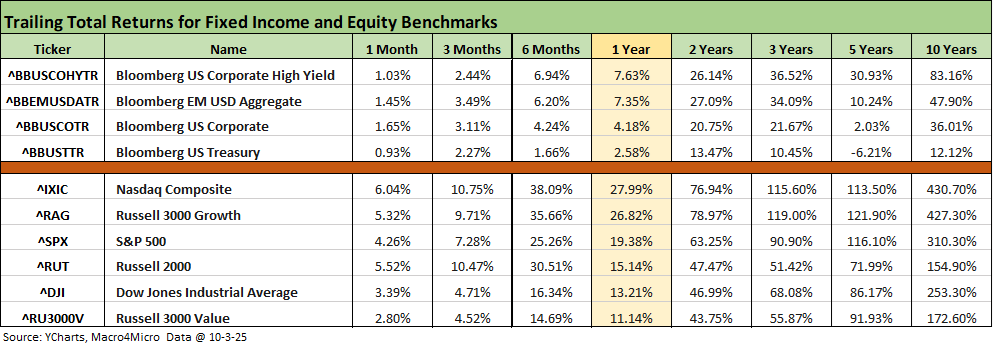
The above table updates the high-level debt and equity asset returns looking back from 1-month to 10 years. The pattern of almost all positive held in again this week with only the trailing 5-year timeline for UST in the red (-6.2%), which reflects the impact of the inflation spike and tightening cycle that brought the end of the ZIRP years and the artificially lower rates that ran from the credit crisis to the COVID period.
Rolling 3-month and 6-month periods in equities were impressive and the same for 1-year and 2-years. Within the fixed income line items, credit has been a winner with spread compression and a YTD bull steepener as we discuss in a range of pieces. We publish the yield curve weekly update later today.
The rolling return visual
In the next section, we get into the details of the 32 ETFs and benchmarks for a mix of trailing periods. Below we offer a condensed 4-chart view for an easy visual on how the mix of positive vs. negative returns shape up. This is a useful exercise we do each week looking for signals across industry groups and asset classes.
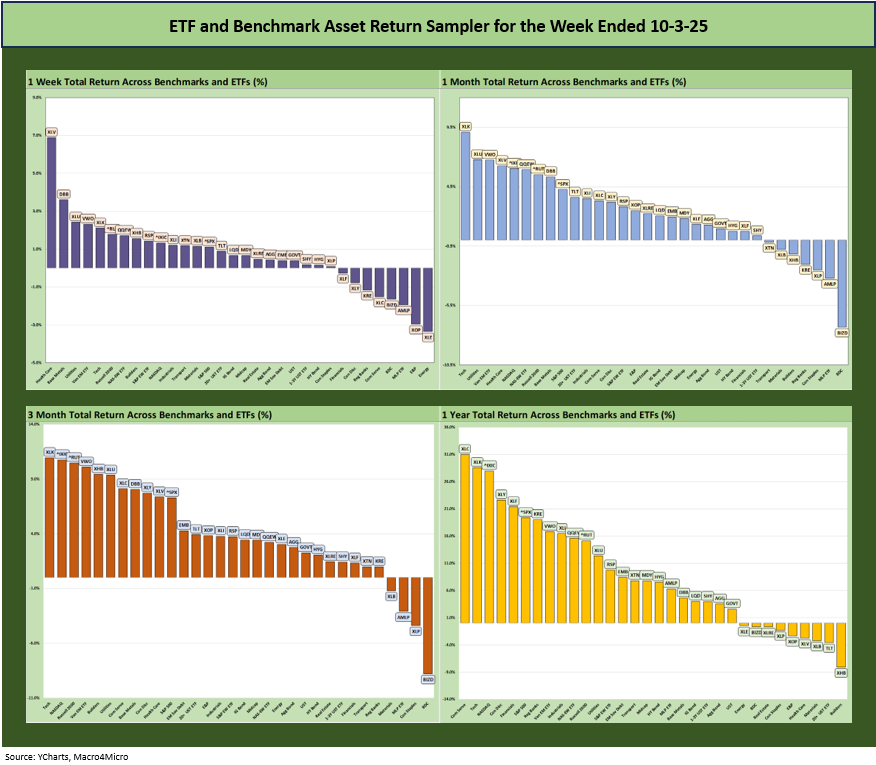
The symmetry of returns across the time horizons detailed above for 1-week, 1-month, 3-months, and LTM are heavily positive. We include a YTD chart further below, and that timeline impresses at a score of 30-2.
The Magnificent 7 heavy ETFs…
Some of the benchmarks and industry ETFs we include have issuer concentration elements that leave them wagged by a few names. When looking across some of the bellwether industry and subsector ETFs in the rankings, it is good to keep in mind which narrow ETFs (vs. broad market benchmarks) get wagged more by the “Magnificent 7” including Consumer Discretionary (XLY) with Amazon and Tesla, Tech (XLK) with Microsoft, Apple, and NVIDIA, and Communications Services (XLC) with Alphabet and Meta.
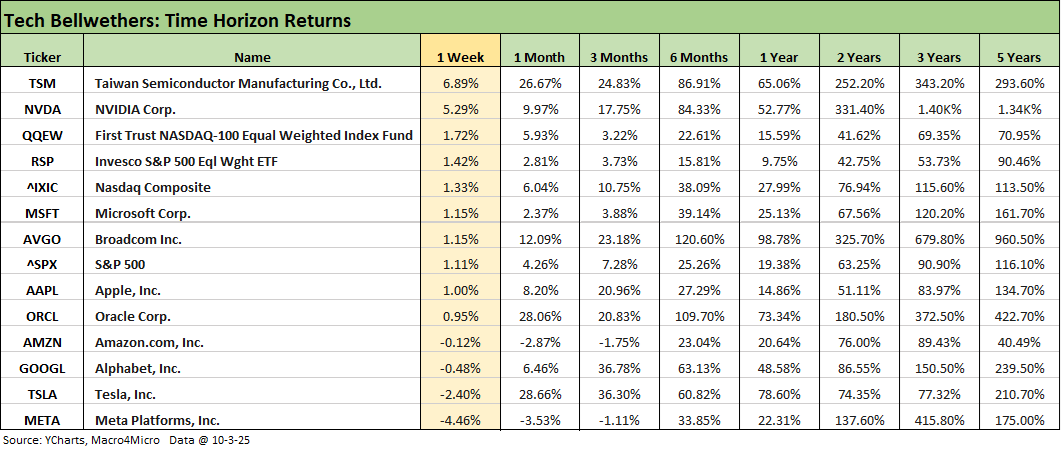
We already addressed the weekly returns for the tech bellwethers in our Mini Market Lookback: Chess? Checkers? Set the game table on fire? (10-4-25.) This chart lines them up in descending order of weekly returns, and the tech bellwethers did not stack up as well for the week vs. the broad markets and equal weight benchmarks (RSP, QQEW). That said, the longer timelines such as 6-months really jump off the page. It is interesting that Meta has struggled in recent periods (1-week to 3-months) and the same for Amazon.
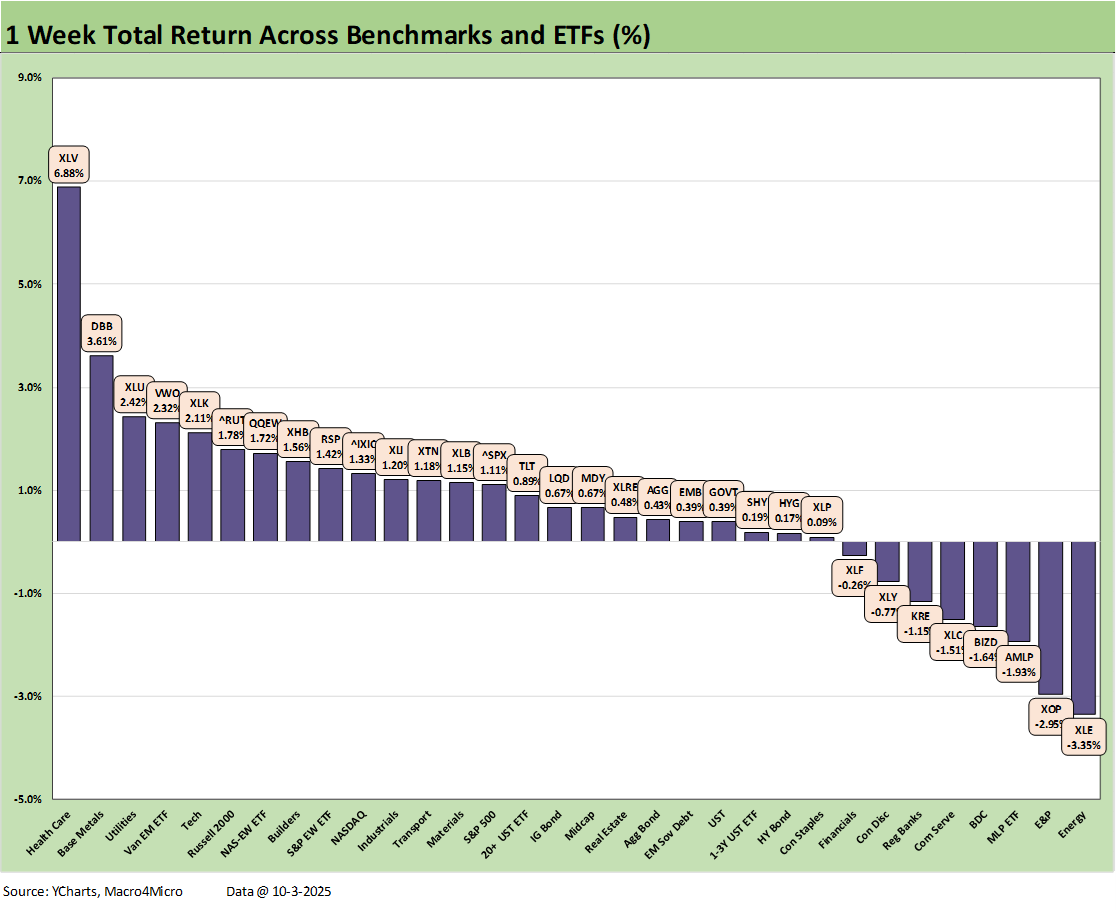
The 1-week return chart for the 32 benchmarks and ETFs weighed in at 24-8. We covered it in detail in our Mini Market Lookback: Chess? Checkers? Set the game table on fire? (10-4-25).
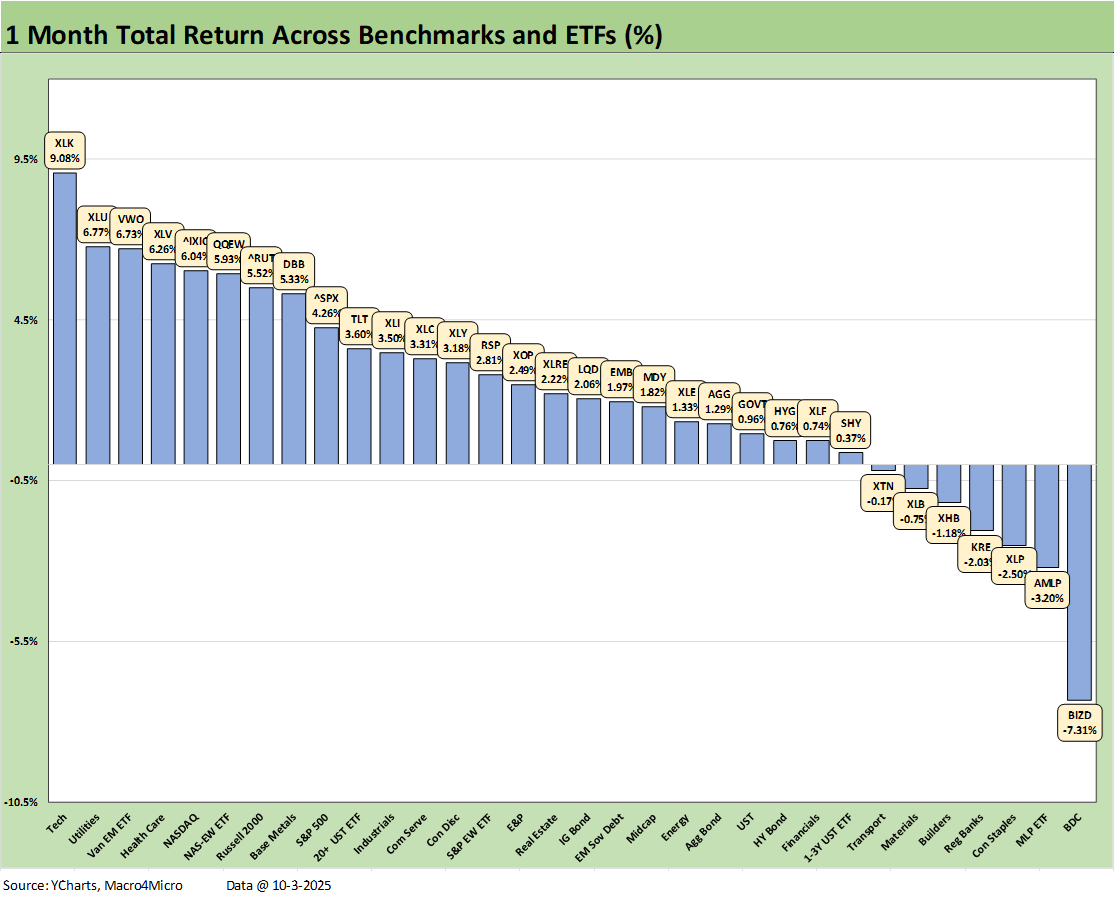
The 1-month time horizon weighed in at 25-7 with all bond ETFs in positive range. For bonds, the long duration UST ETF (TLT) was 2 slots into the second quartile while the short ETF (SHY) was at the top of the bottom quartile.
The top quartile saw the Tech ETF (XLK) on top at +9.1% with a sharp drop to Utilities (XLU) at #2 with EM Equities (VWO) at #3. As we discussed in the Mini Lookback this week, the Health Care ETF (XLV) saw a wave of big rallies (heavily in pharma) with some of the largest holdings posting double digit returns on the week. We see NASDAQ and the Equal Weight NASDAQ 100 (QQEW) in the #5 and #6 position.
The small cap Russell 2000 made the top quartile for the month ahead of the S&P 500, which was at the top of the second quartile with the Equal Weight S&P 500 ETF (RSP) further down in the second quartile. The breadth story has been helped by the small caps performance as the Russell 2000 has been working its way up near the top of the second quartile YTD after being mired in the bottom quartile earlier in the year.
In the bottom tier for the month, we see 7 of the 8 lines in negative range in that low quartile including the BDC ETF (BIZD) on the bottom at -7.3% as the extrapolation effects from First Brands and Tricolor spooks the market and private credit bashing kicks into gear in the financial media. The questions around due diligence quality and the lack of transparency around “what’s under the hood” is hard to refute for the simple reason that the credit exposures are in fact “private.” That makes for very inefficient markets that many funds love to exploit.
The BDCs in the equity markets offer a high-income sector that attracts cash income investors who are comfortable with leverage and credit risk, but the much larger slice of private credit is behind the wall using institutional money across a wide range of structured products as well as old school loans. This will get interesting in the BDC earnings season as they move to reassure.
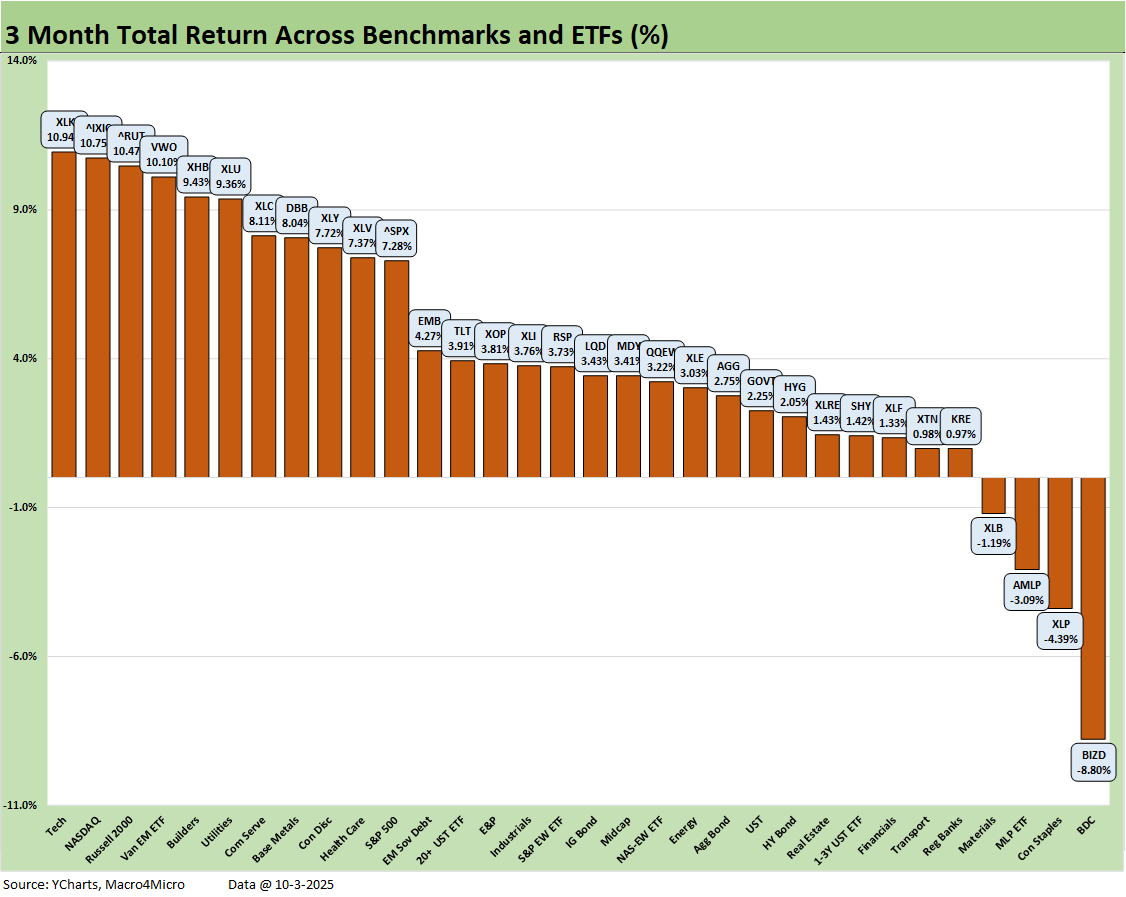
The 3-month time horizon posts a score of 28-4 with BDCs on the bottom again at -8.8% joined in the bottom quartile in the red by another income heavy ETF in the midstream energy AMLP. The more defensive and rate sensitive Consumer Staples ETF (XLP) was negative as was the cyclical Materials ETF (XLB) as those two round out the 4 ETFs in the red.
In the top quartile, we see the Tech ETF (XLK) at #1 followed by NASDAQ at #2 and an impressive quarter for the Russell 2000 at #3, EM Equities (VWO) at #4, and Homebuilders (XHB) making a comeback at #5. Utilities (XLU), Communications Services (XLC), and Base Metals (DBB) round out the top quartile.
The bond ETFs were all positive with EM Sovereign (EMB) leading that group in the 2nd quartile with the long duration UST ETF (TLT) right behind EMB. The bottom performer in the bond group was the short duration UST (SHY) in the top slot of the bottom quartile.
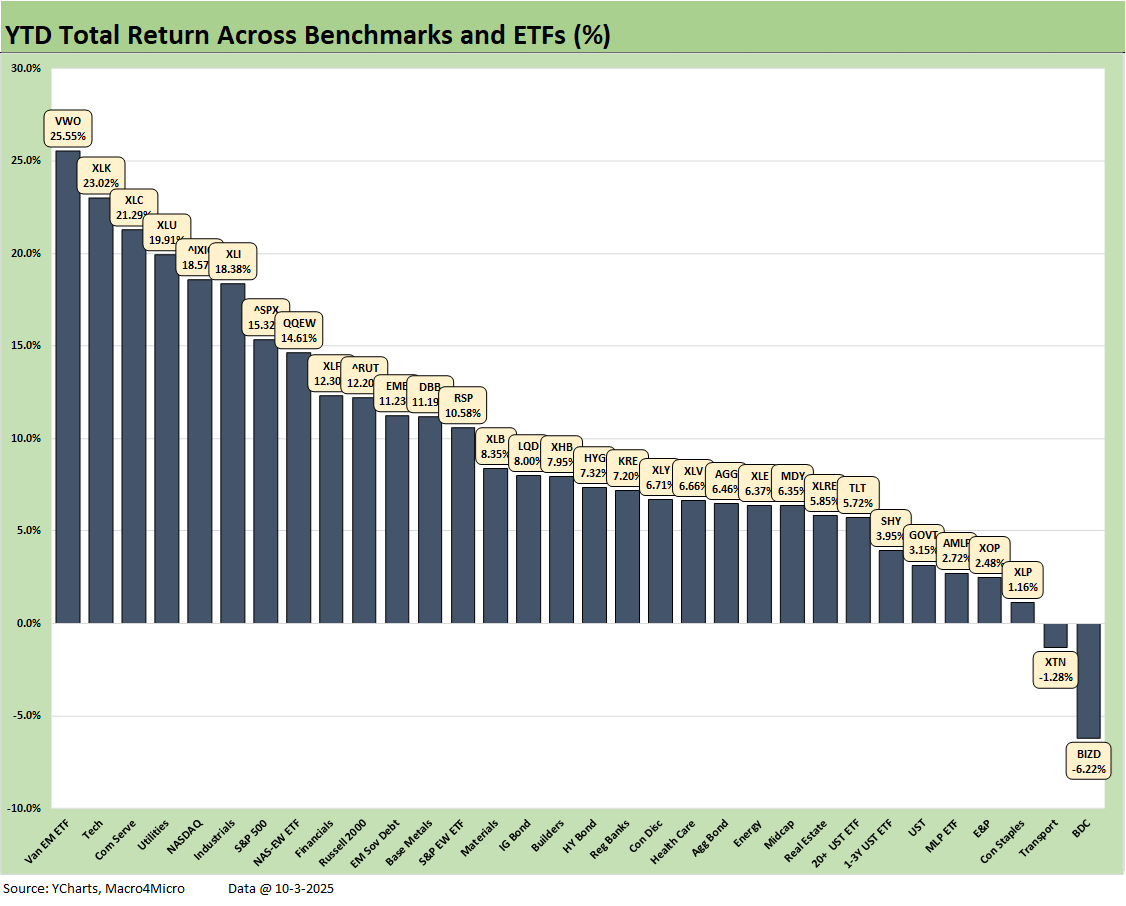
There is not much mystery in the YTD performance with the score at 30-2 despite tariffs, a weak dollar, political chaos (now a shutdown), slower personal consumption expenditures and mixed investment in the GDP accounts. The material disparities around who is spending and who is stretched to the limit even before the heath care premium hikes will be something to monitor.
The inflation pressures along some critical household goods lines go beyond health care. Those details will be obscured for a while after there was plenty of product lines to follow the sequential CPI that refutes the false claim of “tariffs do not impact price.” The tariffs clearly do pressure prices for some products, and the tariff process is just getting warmed up.
The winners YTD show EM Equities (VWO) at #1 despite all the trade noise as the China relationship never went into the protracted meltdown that was feared. Trump learned a lesson around the China “don’t back down” culture after around 75 years of threats (including nuclear), withholding recognition (until the 1970s), and one war (Korea). Currency trends also have favored a range of EM equities with the dollar tanking.
We see Tech (XLK) at #2 and Communications Services (XLC) at #3, Utilities (XLU) at #4, NASDAQ at #5, Industrials (XLI) at #6, the tech-heavy S&P 500 at #7 and Equal Weight NASDAQ 100 (QQEW) at #8. While it is reassuring to see Industrials (XLI) and Financials (XLF) and the Russell 2000 rounding out the top 10, it is hard to get past the reality that tech has done the heavy lifting.
We see bond ETFs all posting positive returns, but with GOVT, SHY, and TLT in the bottom quartile. AGG and HYG are in the 3rd quartile, and IG bonds (LQD) and EM Sovereigns (EMB) are in the 2nd quartile.
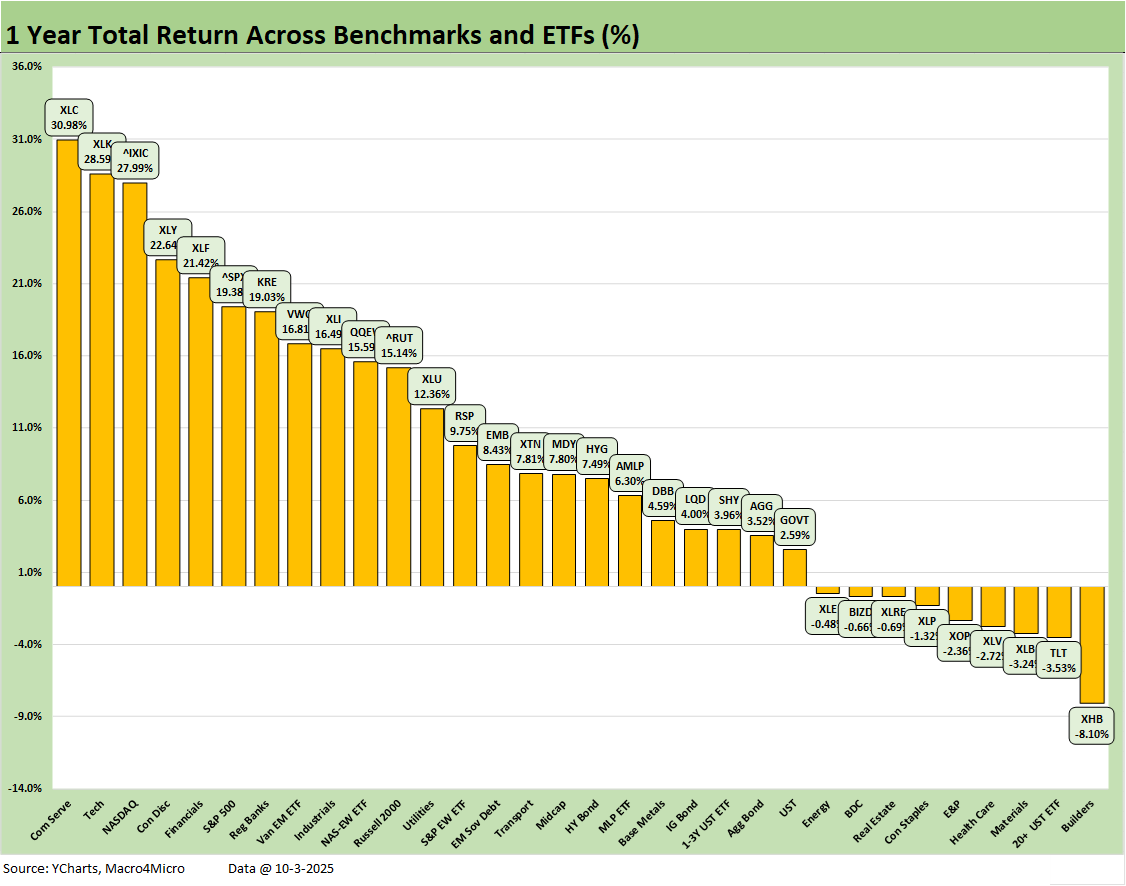
The 1-year returns stood at 23-9 this week. Homebuilders (XHB) sit in last place at -8.1% given a full year after the sharp sell-off that started in 4Q24 before the recent rally. We see the long duration UST ETF (TLT) second to last at -3.5%. The cyclical Materials ETF (XLB) is three off the bottom in a bad cyclical signal.
Health Care (XLV) climbed off the bottom where it stood last week with some very strong pharma rallies this week. Oil was battered this week again, so E&P (XOP) was in the red. BDCs (BIZD), Consumer Staples ETF (XLP) and Real Estate ETF (XLRE) round out the ETFs in the red zone. The broad Energy ETF (XLE) was also in the red at the bottom of the 3rd quartile.
On the leaderboard, Communications Services (XLC) holds down #1 at +31% with Tech (XLK) at #2 closing fast with 28.6% and NASDAQ #3 at 28%. Consumer Discretionary (XLY) and Financials (XLF) round out the top 5. The top quartile is more tech heavy including the S&P 500 with its tech concentration, but we do see some diversification with the presence of Financials (XLF) and Regional Banks (KRE) and EM Equities (VWO) rounding out the top quartile. Industrials (XLI) just missed the top quartile this in this week’s update but is at the top of the second quartile.
The S&P 500 LTM stands at 19.4% over 1-year (15.3% YTD 2025), so the S&P 500 will need to finish 2025 in impressive fashion to move from 15% to 25% for the year to match the 2024 and 2023 S&P 500 returns. It is doable, but it needs good news.
The year 2024 was Part Two of the best 2-year run in the S&P 500 since the late 1990s, so that sets a high bar (see Footnotes & Flashbacks: Asset Returns for 2024 1-2-25). The S&P 500 return of +25% for 2024 (26% 2023) will be very hard to match in 2025-2026. Trump says the US was a dead country over 9 months ago, but that raised the stakes on hitting those marks while selling that story line.
The S&P 500 will need a very strong finish in 4Q25 to match those “dead” years of 2024 and 2023. The current economy is also lagging on key GDP lines and is well behind 2024 along the PCE line of GDP, which is 68% of GDP. The investment numbers in the GDP lines also do not match up with the “trillions in investment story line.” Those investment “promises” still need to show up in the numbers. GPDI has been mixed (negative in 2Q25 final) with Equipment doing well in 2025 (tax bill helps) but Structures are weak. Intellectual Property has been doing well on the tech boom while Residential struggles.
The most important GDP lines that move the needle are lower (PCE Goods and Services) but often get clouded by the month-to-month impact of lower imports that materially distort the headline GDP lines higher. We are unlikely to get the advance 3Q25 GDP numbers later this month (see 2Q25 GDP Final Estimate: Big Upward Revision 9-25-25).
See also:
Mini Market Lookback: Chess? Checkers? Set the game table on fire? 10-4-25
JOLTS Aug 2025: Tough math when “total unemployed > job openings” 9-30-25
Credit Markets: Cone of Silence Ahead? 9-29-25
The Curve: Easing Anxiety at Bat, Tariffs on Deck 9-28-25
Mini Market Lookback: Market Compartmentalization, Political Chaos 9-27-25
PCE August 2025: Very Slow Fuse 9-26-25
Durable Goods Aug 2025: Core Demand Stays Steady 9-25-25
2Q25 GDP Final Estimate: Big Upward Revision 9-25-25
New Homes Sales Aug 2025: Surprise Bounce, Revisions Ahead? 9-25-25
Credit Markets: IG Spreads Back in the Clinton Zone 9-22-25
Mini Market Lookback: Easy Street 9-20-25
FOMC: Curve Scenarios Take Wing, Steepen for Now 9-17-25
Home Starts August 2025: Bad News for Starts 9-17-25
Industrial Production Aug 2025: Capacity Utilization 9-16-25
Retail Sales Aug 2025: Resilience with Fraying Edges 9-16-25
Credit Markets: Quality Spread Compression Continues 9-14-25
Mini Market Lookback: Ugly Week in America, Mild in Markets 9-13-25
CPI August 2025: Slow Burn or Fleeting Adjustment? 9-11-25
PPI Aug 2025: For my next trick… 9-10-25
Mini Market Lookback: Job Trends Worst Since COVID 9-6-25
Payrolls Aug 2025: Into the Weeds 9-5-25