
Footnotes & Flashbacks: Credit Markets 7-22-24
We look at the continued compression wave that now has the BB tier looking like June 2007 as credit risk pricing overall stays very tight.


My fact and concept allergies are driving me crazy…I better change the debate to Fox…
The latest round of spread tightening is getting some credit tier OAS levels back into the rarefied air of June 2007 as numerous cuts of the data hit various lows in OAS and quality spread differentials.
With pricing supposedly forward-looking, the tendency for now is to avoid pricing in bad outcomes and revisit those risks after the election, but Kamala (or whoever is next) just added some new variables.
Handicapping election outcomes and the timing of side-effects (policy and legislation lags) is not easy and especially when some dramatic, disruptive shifts in strategy and policy could have very outsized impacts on the economy.
The shortlist of major economic movers includes trade (painfully large increases in tariffs), an overhaul of monetary decision-making, taxes and unpredictable fiscal behavior (unlimited deficits), murky but de facto threats to kill Obamacare (a consumer sector dagger with no plan in hand), and immigration chaos (mass deportations, labor market fallout, stress with Mexico as the #1 nation for imports).
As we go to print, the market response to the Biden exit is still getting digested and handicapped but overnight the endorsements and “I am not running” news flow has piled up from party luminaries. So, it looks to be Kamala Harris when the political choreography is over. In the end, any change in the depth of insight that also gives better visibility to the facts and not just the platitudes and generalities would be a good thing.
The big moving parts for economic risk…
There are many areas of concern and focus from the Democratic side of the ledger, including women’s bodily autonomy (near top of the list for turnout), the Project 2025 Brownshirt Guide, civil rights rollback, NATO, Ukraine and tacit support of Putin’s plan to reconstitute the Soviet Union by force. I don’t mean to downplay these, but Trump fancies himself an economic guru. He is very vulnerable. Being lectured with specifics in a complex framework of cause-and-effects by a black woman would rattle him. Call him “ignorant” on these topics. That would be downright entertaining and revealing. She is a former prosecutor, and Trump has met his share.
Those topics aside, the hope is that the next candidate (presumably Kamala) gets much more articulate in areas that are major threats to the economy and markets. They cannot just speak in lofty high-brow generalities.
Trump’s greatest weakness is his poor mastery of the facts and very basic concepts that connect the dots to inflation, jobs, and understanding the risks of his policies. My favorite three are health care, trade, and his mass deportation plan and what the effects will be. He peels back no layers and has not studied the challenges. He never does, but he knew Biden could not call him out on it.
Health care: On our short list, the attack on health care (and threat to preexisting conditions) is not getting enough focus down to the granular level. It should be a nonstop focus. Biden whiffed on that topic and did not smoke out Trump on facts and hammer it home. It is a major Trump sensitivity since one of his goals in life (beyond being President for life) is to remove the word “Obamacare” from the legislation Hall of Fame. He loathes Obama. Remember when Obama and Clinton would go toe-to-toe with details? There should be specifics. The lightweights in the current discourse are painful. Trump talks out of both sides of his oversized cheeks on this one. Biden just did too many teleprompter repeats on Medicare and Social Security. Trump needs to be grilled on his nonexistent health care plan. No escape.
Trade: Tariffs, retaliations, the risk of a closed border with Mexico, and budget-breaking bailouts (farm relief) is a huge risk factor for the economy. The dialogue gets swept up in anything but facts. Trump makes false statements on this topic with very high stakes in trade. It was a prime-time convention topic. Little things like “buyer pays” have been beyond Trump and Biden to confront. China trade clashes escalating on tariffs or with the EU (the #1 trade partner as a bloc) would be a massive risk and worse this time. That is especially the case if Trump kills NATO commitments and turns the continent (ex-Hungary) against the US just as China is retaliating.
Mass deportations: Away from the toxic issues of deploying the US Military on US soil, the logistics and war gaming a mass deportation of 15 to 20 million (bigger than the WWII mobilization) is high risk and virtually unmanageable. “Mass Deportation” signs at the GOP Convention were there to see. What’s the plan? Just drop them all in Mexico? Guess what Mexico will say?! That flows into Mexico trade risk (see Trade Flows: More Clarity Needed to Handicap Major Trade Risks 6-11-24 ).
There is a lot to challenge Trump on. The debate cuts both ways, but the most threatening topics and changes to established programs and institutions are generated by Trump. The big Trump initiatives all can be tied to the #1 problem of the last 2 years (inflation). The main events are health care (medical inflation and household cash flow pain will come from killing the ACA), trade (tariffs mean inflation), and how mass deportations flow into the labor market (wage inflation risk on labor supply). These are all GOP ideas, not Democrats’.
The GOP can beat up the Democrats on taxes (as always). Many do not appreciate the small business pain in some estate taxes such as death as a “realization event” for illiquid small business stock. That would crush families. Farms are off the hook as always (as they should be). Energy policy is a mess. And more. Overall, the threats are mostly the Trumpian tectonic proposed changes that affect so many areas of US economic health. This is a guy who is 0 for 2 in popular votes saying he represents “the people.” The “people” will suffer even more under some of his crazy policy proposals.
We cannot have candidates who are economically ignorant and inarticulate on their party policies and the specific factual and conceptual frameworks.
From my own position as a voter, I am not sure Kamala Harris is that person, but there is hope, and she is not looking to be dictator, did not reject elections (a disqualifier for any true patriotic American), did not have the Capitol sacked, is not a convicted “felonious fraud,” she does not sleep with a copy of Project 2025 under her pillow (it is large and lumpy), and she is not being propped up by religious fanatics favoring a White Nationalist Autocracy. That is not a bad start.
Back to the economy and credit markets…
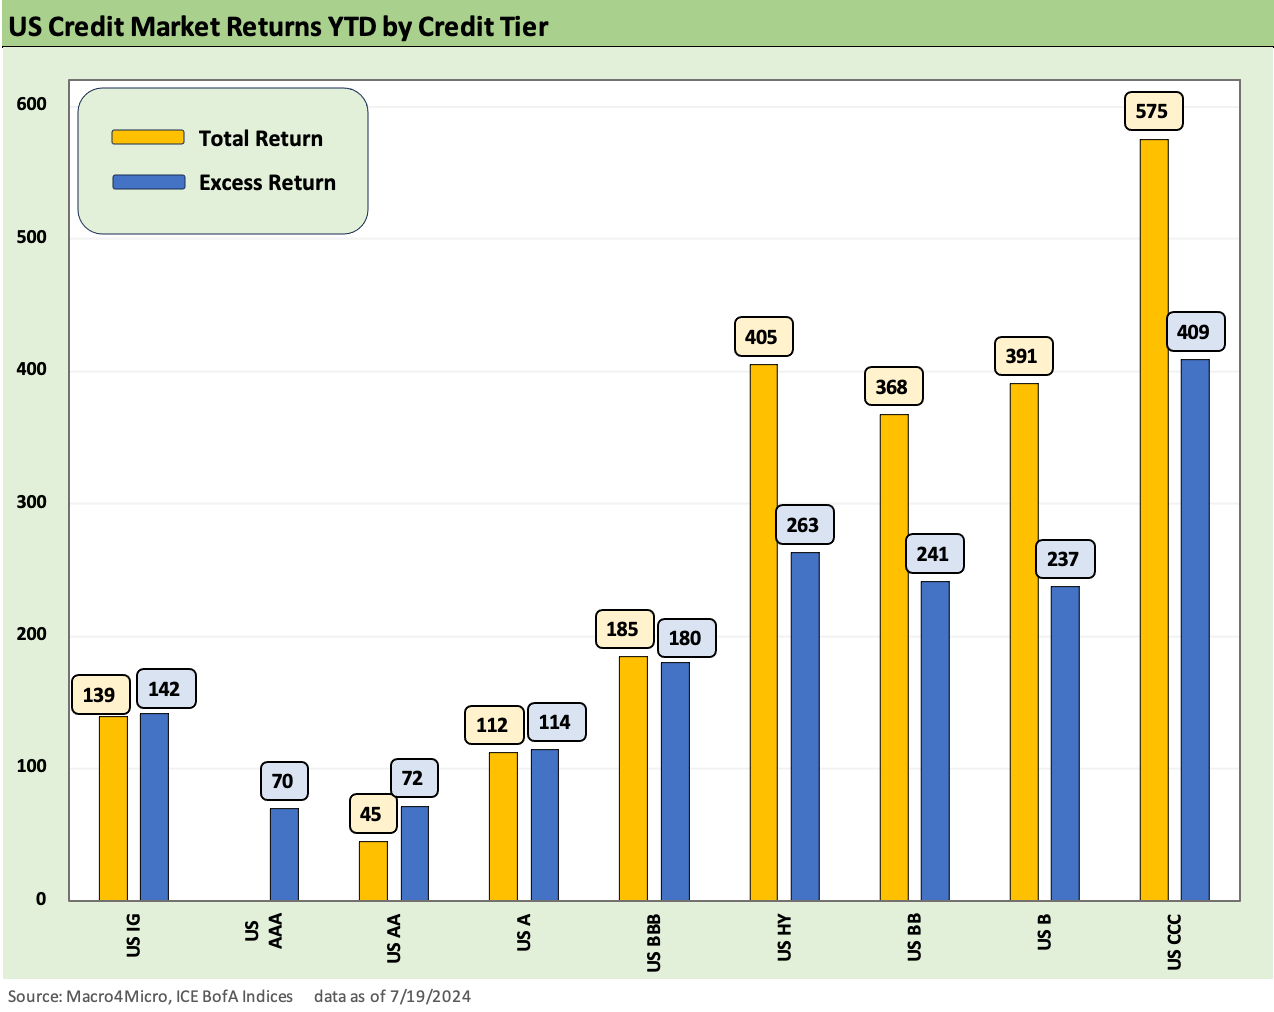
The above chart updates where the credit markets stand in total returns and excess returns in a market where duration has been generally unfriendly to IG bonds relative to expectations, spreads have narrowed, and coupons have slowly but surely continued along the path of repricing to current market rates. The pattern shown in the chart above is logical and rational with higher risk credit generating higher excess returns and longer duration IG tiers getting hit on duration relative to HY.

For a little cyclical context across the credit cycles in the riskier end of the credit spectrum in HY, the above chart shows the annual returns and the YTD 2024 results so far. The +4.1% YTD stacks up reasonably well across the cycles given the compressed starting point for the year on HY spreads and the fact that the current HY mix is more weighted to higher quality BB tier than some past periods of credit aggression in such years as 1997-1999 and 2004 to mid-2007. Some of those earlier periods had very different monetary backdrops than what we have been experiencing in this cycle. We cover those UST curve periods in other commentaries (see Greenspan’s Last Hurrah: His Wild Finish Before the Crisis 10-30-22, Wild Transition Year: The Chaos of 2007 11-1-22).
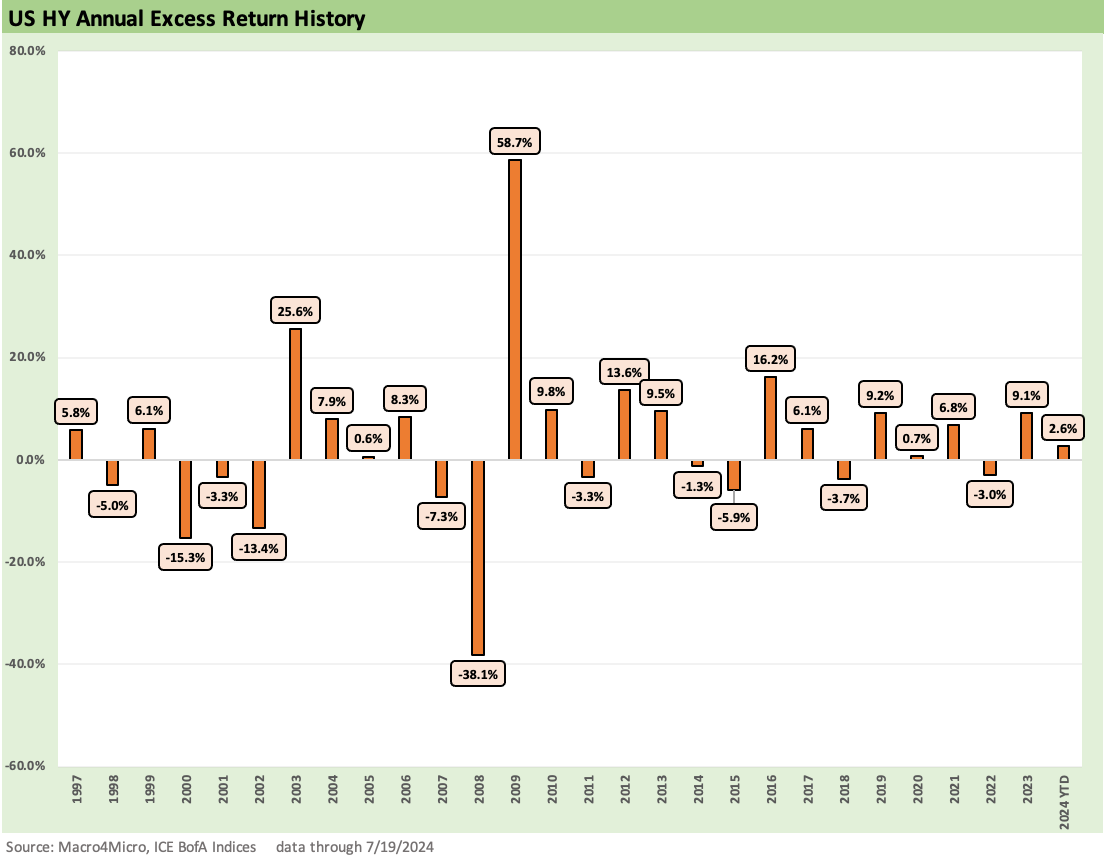
The above chart flips the switch over to excess returns to isolate the UST impacts and lock in the credit portion of returns. Once again, YTD 2024 is shaping up as reasonable returns between the extremes with risk pricing that started out compressed in historical context and stayed that way and even narrowed further as we detail below.
A rule of thumb as seen in the chart is that great years come after awful years and occasionally after several credit beatdown years as evident in 2000 to 2002. The late 2008 collapse followed by loan and bond prices doing a ricochet higher was one for the ages. The market makers were in trouble and the redemption panic of late 2008 was widespread into early 2009.
The current market is also wrestling with the same dilemma as equities in the lack of a clear transmission mechanism to a recession from here. The handicapping of contraction in credit faces the same “soft vs. hard landing” wrestling match as in equities. Many industries have navigated the tightening cycle quite impressively despite all the partisan nonsense and fact avoidance in the world of politics and the machinations of the “ethical red light district” of Washington. The DC crowd makes Wall Street look like the church choir. After all, a Wall Streeter can always just change jobs. The DC power-seekers cling and clutch and equivocate – and too often kneel. A lot of kneeling in the GOP these days.
Markets can usually look past the Washington slime-fest. They are just variables to be assessed. Now it is getting as strange as it has ever been and radically unpredictable on a global scale given the priority policies. That macro resilience in the markets is evident in the risk metrics, financial performance, and the equity market signals for many industries and issuers. It gets treacherous from there with all the noise around tariffs and more supplier chain risks and potential inflation side effects.
Credit spread trends across the risk tiers…
Risk pricing as been on compression replay across 2023 and into 2024 and is hard to rattle after a few trips into +500 bps handle OAS in 2022 and almost touching +600 bps. IG dipped into double digits and has shown the sort of resilience evident back in 2004 to 1H07 and 1997-1998. The IG and HY markets have been relatively unflappable since those shaky 2022 moments as the market acclimated itself to the first major inflation war since the Volcker years.

The above chart updates the IG OAS time series with Hi and Lo periods noted along the way. The current +93 bps is below all the median periods noted in the chart and is consistent with earlier cyclical lows. As always, the +53 bps low of Oct 1997 is in a class by itself. That year ended around +70 bps for IG.

The above chart updates the HY index spread history with the current +309 bps below the lows of 2018 and 2014 but just wide to the tightest levels of Dec 2021 as the end of ZIRP was on the horizon a few months later. We recently did a detailed lookback at some of those prior compressed spread markets (see HY Spreads: Celebrating Tumultuous Times at a Credit Peak 6-13-24). We would highlight that low point to start June 2007 saw the end of June 2007 at +298 bps. Similarly, the compressed late 1997 period saw 1997 end at +296 bps. That TMT cycle had a long run into 1999 as the default cycle was kicking in during late 1999.

The above chart updated the HY-IG OAS differential across the cycles from 1997. This metric is a shorthand way to measure the incremental compensation for moving from the IG basket to the speculative grade basket.
The current +216 bps tightened from last week’s +227 bps on the back of HY tightening -10 bps and a slight +1 bps widening in IG. The +216 bps HY-IG differential is not back to the lows of 2021 or 2018 but is through June 2014. The differential remains well above June 2007 and Oct 1997.
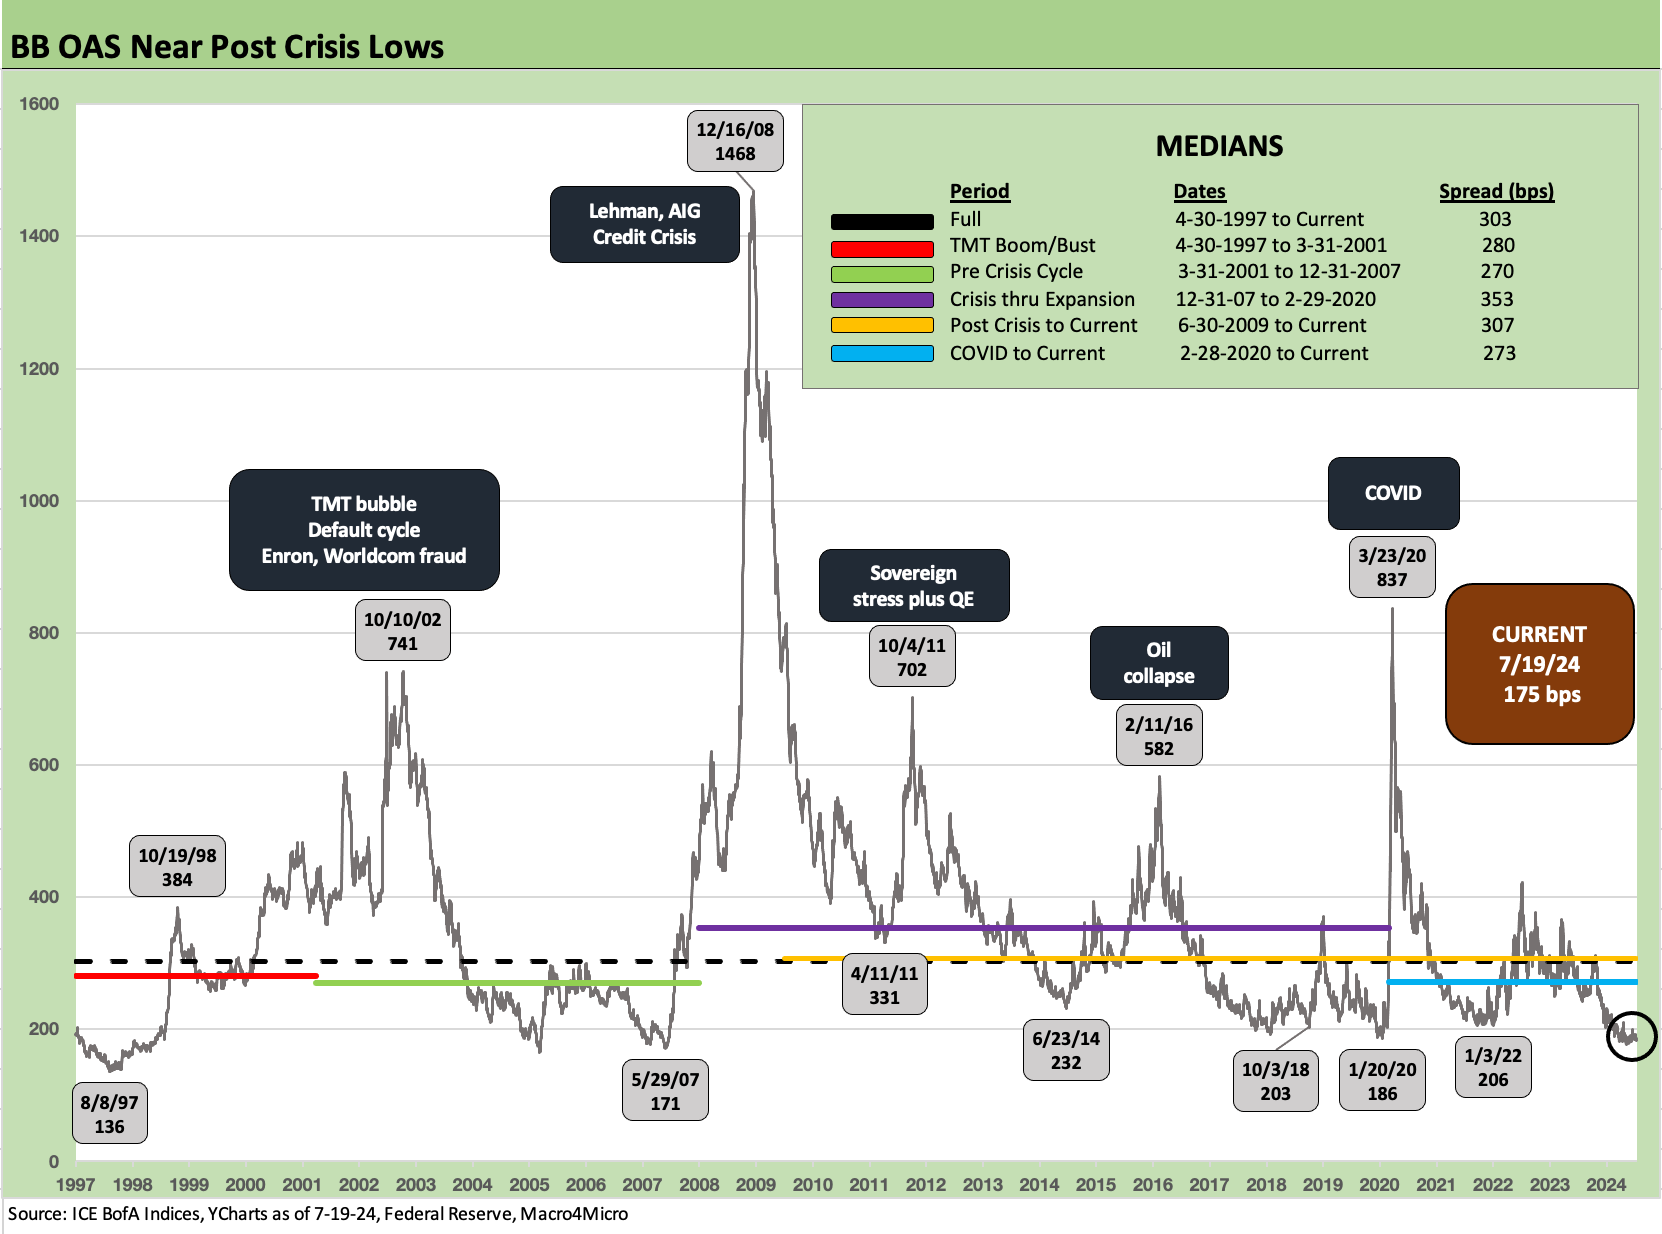
The BB tier has been running tighter in the context of its history and also relative to the BBB tier. At +175 bps, BBs are now inside the lows of early 2022, early 2020, Oct 2018, and June 2014. The current levels are not at the late May 2007 lows of +171 bps yet, but the pricing is knocking on that door last seen in the credit bubble of mid-2007. Those earlier lows were soon derailed. We addressed those earlier spread waves in other commentaries (see HY Spreads: Celebrating Tumultuous Times at a Credit Peak 6-13-24).

The above chart updates the incremental credit compensation for the move from the BBB tier into the BB tier. We have looked at the histories of the BBB vs.BB tier relationships in detail in other commentaries (see HY Spreads: The BB vs. BBB Spread Compression 6-13-24). Current levels are dramatically below all the period medians noted in the chart.
The latest print of +60 bps is right in the mix with the lows of Dec 2019, Oct 2018, and Oct 1997. The differential is closing in on the lows of March 2005 (ahead of the auto downgrade noise) and the +53 bps seen in June 2007 at the credit bubble peak.

The B tier “HY Classic” sweet spot keeps on compressing and ended the week at +287 bps or -7 bps tighter than last week. The BB tier has broken through the post-crisis BB tier lows and the June 1997 lows but has a long way to go to match the June 2007 credit bubble lows.

The above chart updates the B tier and CCC tier OAS time series as both tightened this week with the B tier in by -7 bps and CCC tier tightening by -19 bps. The pattern of these two across the cycles highlights the challenges in low B and CCC tier volatility. The CCC tier OAS is well above the other cyclical lows noted in the time series. We commented on the B tier history in the prior chart.

The above chart updates the “CCC OAS minus B tier OAS” differential. This one can really swing around as we covered in a recent detailed commentary (see The B vs. CCC Battle: Tough Neighborhood, Rough Players 7-7-24). The gaps between the two are more aptly measured in dollar-price points and not basis points (e.g. 43.5 points differential in Jan 2002), but the time series above shows a median differential in spreads of +645 bps at the end of last week. That differential is wide to all the medians posted in the chart with the exception of the 1997-2001 median during the TMT bubble.

The above chart shortens up the time series for the CCC minus B OAS differential to just before the tightening cycle for another angle on a more recent period of volatility. The spread decompression wave seen in HY is evident in late 2022 from the early 2022 tights.
The takeaway from this B vs. CCC differential is that issuer level action is the main event and not a credit tier composite. We can see CCC spreads tighten when the worst names drop out and CCC OAS can widen when companies drop out on upgrades. CCCs are often more like high-risk equities in volatility but without the secondary liquidity of stocks.
The exercise is more useful when you look at tiers of CCCs and break them out by dollar price range. We have done that in past lives. The Hi-Lo ranges in dollar prices are pretty stark in the CCC tier relative to the B tier. That is an exercise for another day.
Some yield comparisons across time…

The above chart updates the running yields on the IG and HY index across time with some notable timeline medians broken out. We always highlight that the most relevant yields to today’s non-ZIRP market are the pre-crisis YTW of 6.1% for IG and 9.3% for HY. That median yield reflects a HY market and IG asset class operating outside of ZIRP and not wrapped up in a slow rate normalization market such as what we saw in 2016-2018 before the fed easing of 2019 and then into ZIRP again from March 2020 to March 2022.
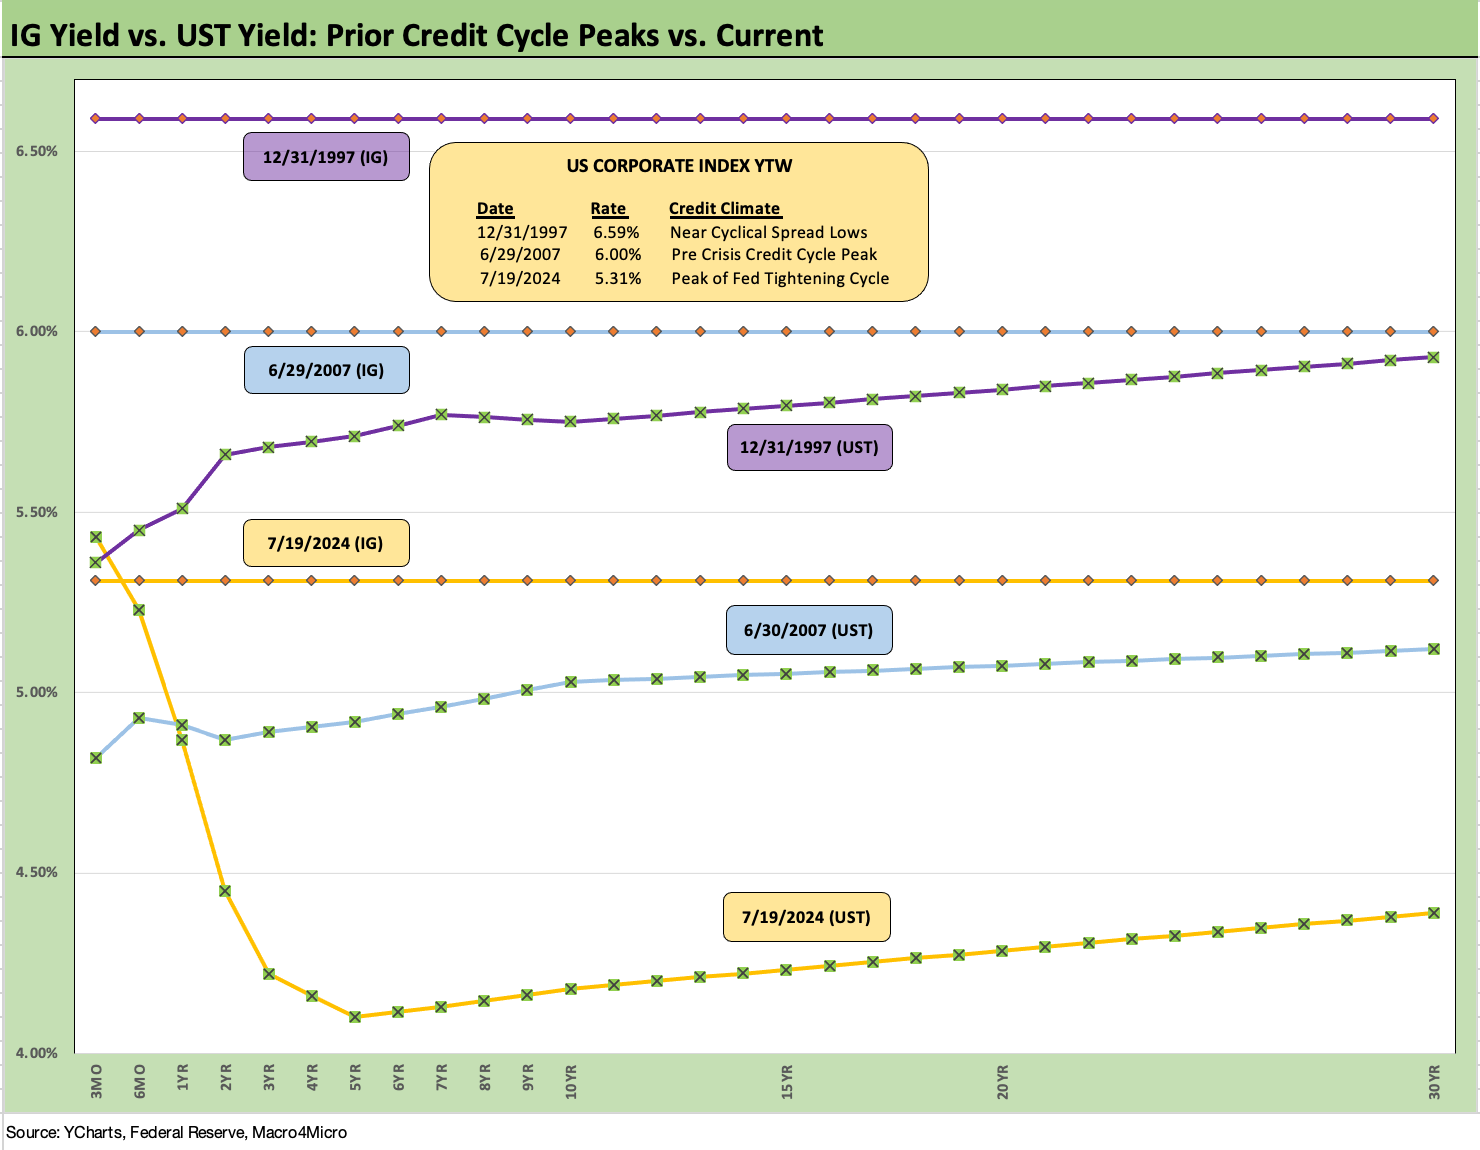
The above chart offers some historical context on today’s IG index yield and UST curves vs. those seen in the famous credit bubble of June 2007 and credit peaks and spread lows of late 1997. The IG index yields are plotted on the horizontal lines.
Spread compression was evident in all three of those markets, but the UST curve is much lower today beyond the 2Y UST as well as steeply inverted. The 2024 market stands out as anomalous across history for numerous reasons with its combination of tight spreads, low absolute UST rates vs. earlier cyclical peaks, and protracted inversion.

The above chart does the same exercise for HY that we did for IG. The all-in index yield reflects tight spreads in all three markets, but lower UST rates carry the day to drive the current HY index YTW below those earlier peaks. We also see a higher quality mix of credit tiers in today’s market vs. 1997 and 2007 with more BBs.
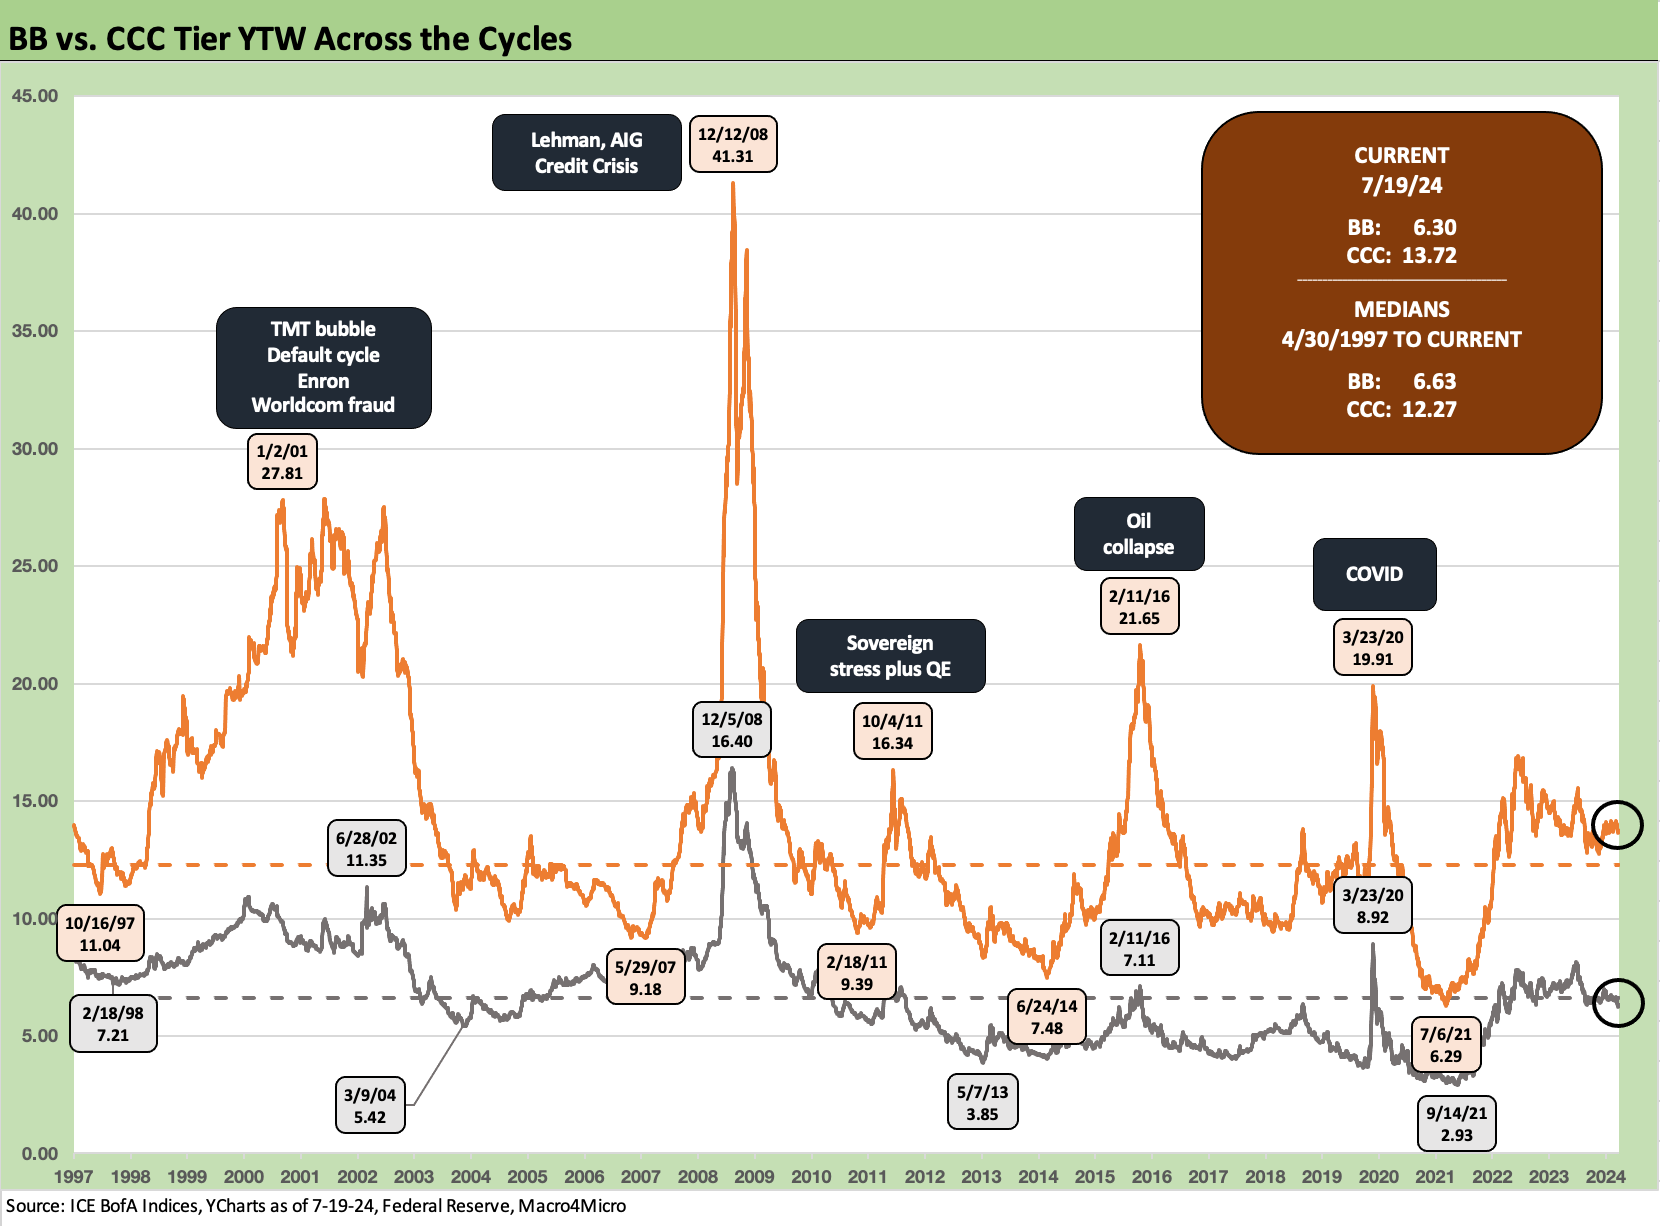
The above chart plots the timeline of BB and CCC YTW for a sense of what the market decided was a fair forward return for the given risk profiles across time. If we consider that the long-term nominal returns on equities is around 10%, the CCC tier at a median of 12.4% (current 13.7%) allow for a reasonable conversation.
The 6.6% median for BBs is also a reasonable expectation. We can play with the numbers for those markets outside ZIRP and “normalization” periods and boost the yields that way, but the main point is that there is a logical core asset allocation across time for those balancing income needs and finding the right positioning along a risk-reward spectrum that can be monitored by good managers. It is always worth keeping in mind that the B tier has exponentially higher long-term average default risk than the BB tier, and the CCC tier has exponentially higher default risks than the B tier.
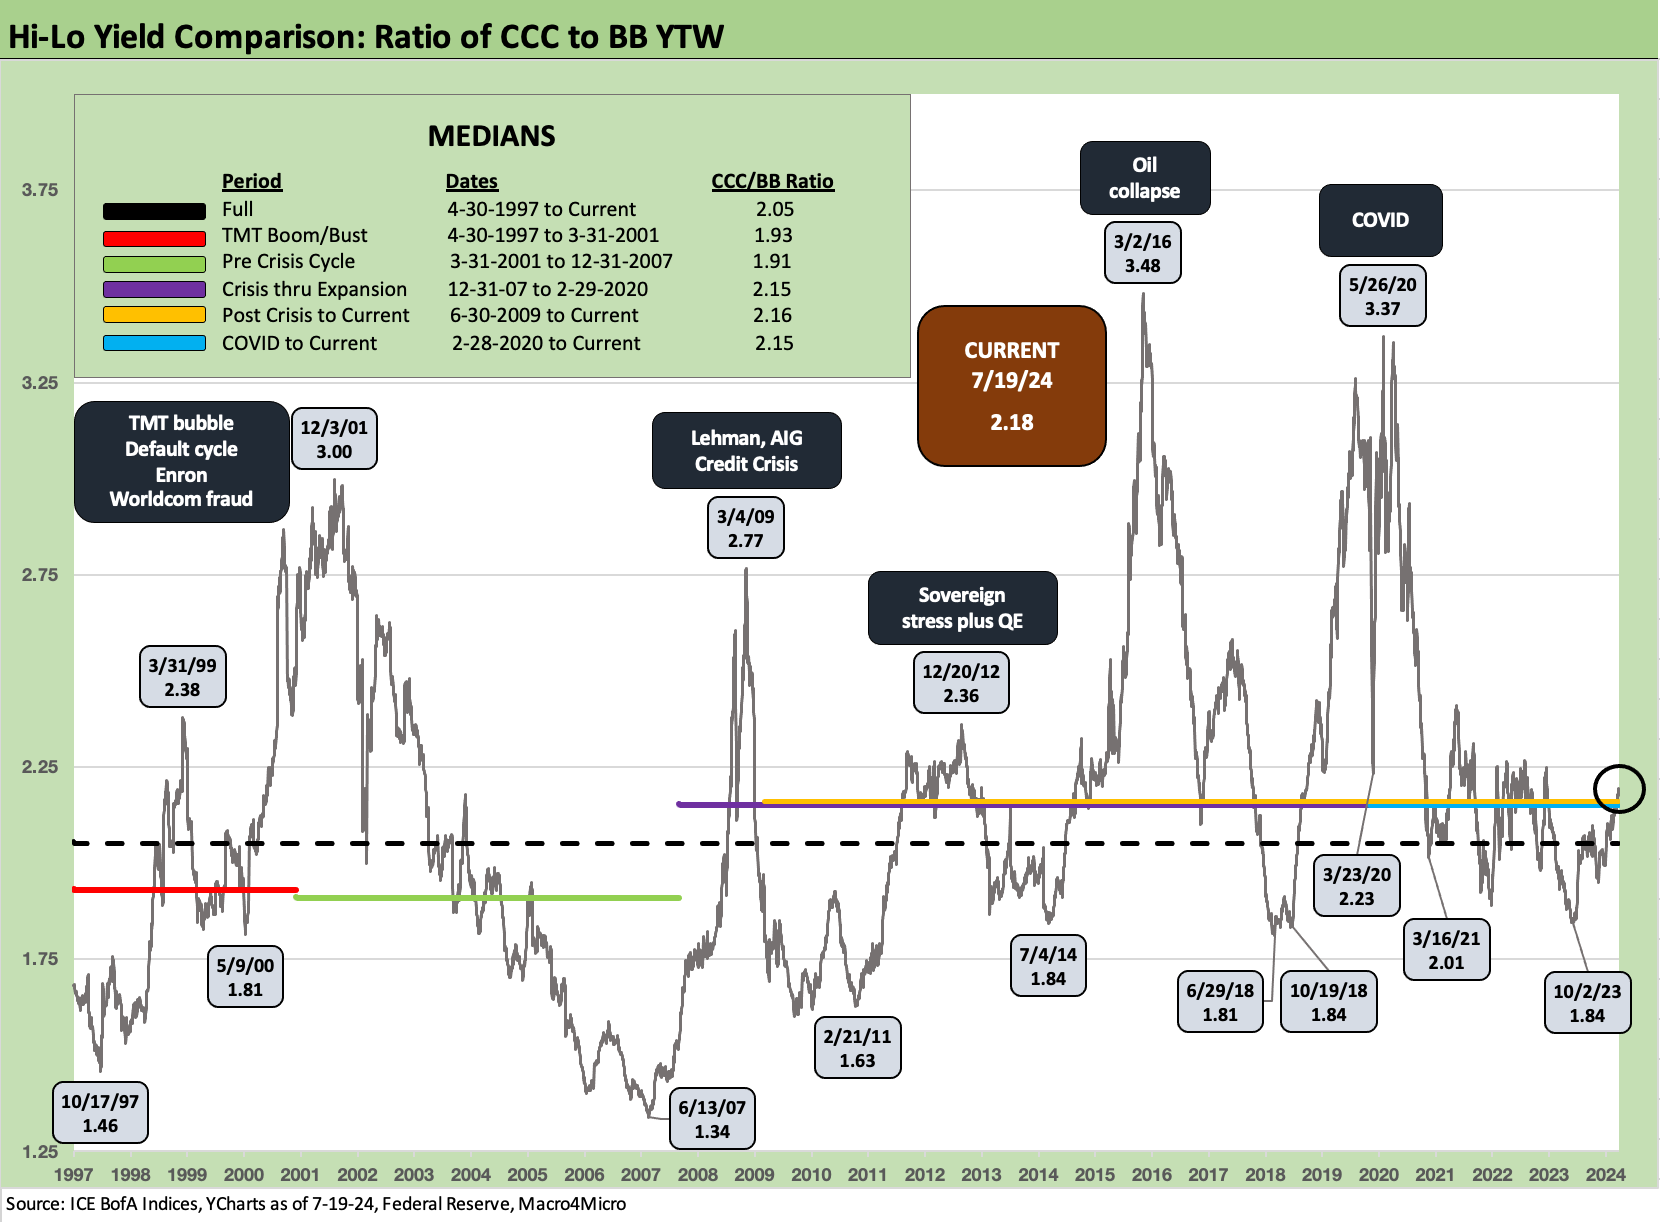
The above chart frames a relative yield ratio for the Hi-Lo risk tiers in HY with a metric using CCC/BB YTW. The basic rule of higher return for higher risk is clear enough, and this points to a simple relationship. The current 2.18x is right in line with the long-term median and multiple other medians. The high and low swings are noted in the chart from a 1.34x low in June 2007 to a high of 3.48x in the oil crisis.
There is always an intensive industry and issuer mix and market liquidity story behind each spike higher in spreads and yields across periods of turmoil. We cover those histories across multiple commentaries including some cycles that pre-dated the use of OAS (see The B vs. CCC Battle: Tough Neighborhood, Rough Players 7-7-24, UST Curve History: Credit Cycle Peaks 10-12-22, Greenspan’s First Cyclical Ride: 1987-1992 10-24-22, UST Moves: 1988-1989 Credit Cycle Swoon10-20-23, UST Moves: The 1990-1991 Risk Factor Pig Pile10-24-23).
See also:
Footnotes & Flashbacks: State of Yields 7-21-24
Footnotes & Flashbacks: Asset Returns 7-20-24
Industrial Production June 2024: Is the Sector Rotation Alive? 7-17-24
Housing Starts June 2024: Still All About the Deliveries 7-17-24
Retail Sales: Second Wind 7-16-24
Footnotes & Flashbacks: Credit Markets 7-15-24
Footnotes & Flashbacks: State of Yields 7-14-24
Footnotes & Flashbacks: Asset Returns 7-13-24
Consumer Sentiment: Still Feeling the Heat 7-12-24
Homebuilder Equities: “Morning After” on Rate Optimism 7-12-24
Homebuilders: Equity Performance and Size Rankings 7-11-24
CPI June 2024: Good News is Good News 7-11-24
Footnotes & Flashbacks: Credit Markets 7-8-24
The B vs. CCC Battle: Tough Neighborhood, Rough Players 7-7-24
Payroll June 2024: The Race Gets Confusing 7-5-24
JOLTS May 2024: The Jobs Oasis Still Has Water 7-2-24
Footnotes & Flashbacks: Credit Markets 7-1-24
State Unemployment: A Sum-of-the-Parts BS Detector 6-30-24
The Debate: The China Deficit and Who Pays the Tariff? 6-29-24
 |
|