
Footnotes & Flashbacks: Asset Returns 7-20-24
We look at the realigning asset returns with tech pain and sector rotation as the recent headline themes.


You need to work on the tone and smell of your unity sales pitch…
The recent asset returns show setbacks in tech on a mix of valuation worries and the potential for Small Caps and interest-rate-sensitive sectors to play catch-up.
While mortgages moved lower again, the upper 6% handle region for 30Y mortgages are still a very long way from the sweet spot to drive sustained unlocking of a very healthy base of home equity for housing and consumer spending.
The longer end of the UST curve is still facing a challenge when the tariff-inflation connection stays in focus and the demonstrated willingness of Trump to load up on deficits does not mark a departure from the status quo budgeting.
Relief for short duration funding for consumer durables (notably motor vehicles) could open up an opportunity for more incentives at lower costs to the consumer sector.

The above chart updates the high level debt and equity benchmarks we watch as we see a weaker relative performance with the NASDAQ falling into the negative zone by itself as of the current rolling 1-month. That is a long way from the stellar 3-month time horizon return of over 16%. We look at some of the big tech movers further below. We see all those bellwether names in the red above and beyond the Magnificent 7.
The debt benchmarks have been solid over 3 months, but for 6 months the duration performance has been very muted overall. The IG benchmarks and UST have been more exposed to the adverse YTD curve moves as we detail in our separate Footnotes publication on the State of Yields to be published later this weekend.

The above chart updates the 1500 and 3000 series with the returns lined up in descending order of 1-year total returns. Those 1-year returns show what a dazzling year it has been in equities broadly even with some stretches within that time horizon showing a lack of breadth and tech domination. The metrics above cover a very wide range of companies and sectors, and even the “bad numbers” (Real Estate) are respectable in a tightening cycle despite some subsectors facing asset value stress and fears of credit contraction and outflows (notably office properties and some healthcare REITS).
We found it somewhat amusing that the stock market performance did not get much airtime at the GOP convention after Biden missed his window to throw these numbers at Trump in that dreadful debate. Trump loved his stock market bragging rights back in his term. Biden could have gotten under his skin on that topic, but he went mentally MIA.
On the broad market benchmark (S&P 500), Biden has hit over 100 highs above the highest achieved under Trump. That does not in substance mean much to us since the market generally hit new highs under most Presidents since the bull markets of the 1980s, but it was a talking point left in the mental storage bin. Returns have been strong and forward guidance not signaling trouble (yet).
Biden could have made Trump say, “stock markets don’t matter” or “stock markets do matter and mine were better.” Either way, that would have been an opening to demonstrate some factual performance differentials. Another opportunity missed on hard market numbers. We are hearing a lot of adjectives from the candidates and few hard numbers. Biden blew his chance.
The 1-month period shows the recent tech pain in the Russell 3000 growth line while the rest of the items are comfortably back in the positive zone. The negative month for Growth stock benchmarks is still set against a very solid rolling 3-months at over +14% and almost 27% for 1-year, so there is ample room for volatility as the tech vs. industrials vs. financials debate plays out on valuation anxiety.
The rolling return visual
In the next section we get into the details of the 32 ETFs and benchmarks for some trailing periods. Below we offer a condensed 4-chart view for an easy visual before we break out each time period in the commentary further below. This is a useful exercise we do each week looking for signals across industry groups and asset classes.

The above chart shows a negative shift in the 1-week mix after posting a 30-2 score last week. The CPI news had sent stocks flying and boosted bonds (CPI June 2024: Good News is Good News 7-11-24). As covered in more detail below, the main story of late has been trouble in tech and rewards for Small Caps. The UST rate expectations have helped subsectors such as Builders and Real Estate. That held up even with a modestly adverse UST curve this past week.
The Magnificent 7 heavy ETFs…
Some of the benchmarks and industry ETFs we include have issuer concentration elements that leave them wagged by a few names. When looking across some of the bellwether industry and subsector ETFs in the rankings, it is good to keep in mind which narrow ETFs (vs. broad market benchmarks) get wagged more by the “Magnificent 7” including Consumer Discretionary (XLY) with Amazon and Tesla, Tech (XLK) with Microsoft, Apple, and NVIDIA, and Communications Services (XLC) with Alphabet and Meta.

The above table underscores the breadth of the tech setbacks this past week. All the Magnificent 7 names were in the red. Some of the next tier of tech bellwethers we track each week also felt pain with names such as Taiwan Semi and Broadcom near the bottom with NVIDIA. Taiwan Semi was feeling some rhetoric heat from Trump comments on Taiwan paying some share of US defense bills.
The strategic goal of all semi production returning to the US provides excuses to take action on tariffs, but that has been murky at best on how to move the needle on Taiwan Semi independence. Threatening Taiwan with trade action is like picking a fight with the Emergency Room surgeon while you are on the operating table. The US might be their defense protection, but Taiwan provides the life blood of many US industries.
Policies that entail economic coercion (tariffs) to elicit a response usually fall apart once you peel back 1 or 2 layers. Tariffs hurt the buyer first (very bad for the many industries who pay the tariffs in the US including tech, autos, etc.). Threats of withholding defense and also hitting them with tariffs is self-destructive for the relationship with the ally and the US buyers of products.
In terms of semis, such massive projects require years and billions in risky capex. The transmission mechanism from political rhetoric to economic activity is never clear since tariffs usually clash with the reality that the bigger plans need to be embraced by the private sector at great financial risk.
Such companies always have the ability to just put a pause on expansion. If their operations get hammered on semi shortages (saw that already in recent years with autos), the risk on the other side could be inflation on supplier chain disarray and finished good shortages that inflate end market prices (note the new and used auto inflation of 2022, etc.).
The trade “fix” strategy being shouted from the podium echoes past threats to the massive, embedded infrastructure of supplier chains. The fix would impair the functioning of the supplier-to-OEM production lines. That is true whether from Mexico or Taiwan. Sweeping changes thrown out in very general terms in rambling speeches have very little to do with what unfolds at the ground level.
The requirement of building all-new supplier chains with the necessary contracts, funding, logistical infrastructure, etc., is not as easy as “get it done” since that is what “I” want. The capital budgeting decisions made at the company level are always one or two elections away from a policy shift that could bring the demise of their revenue and cost assumptions that went into the plan. The more radical the plan, the riskier the investment. That was something the tariff fans might have paid attention to in the setbacks of 2019 (“the greatest economy in the history of the world”) when the Fed had to ease 3 times.

The 1-week return mix shifted heavily toward the negative side from the 30-2 score last week. In contrast, this week posted 11 positive, 1 at zero, and 20 negative. The battering in tech, Mag 7 names and Mag 7 heavy ETFs is evident on the right side of the chart. The weaker performers included Base Metals again with some weakness in EM equities as well. We see 6 of 7 bond ETFs in negative range with HY (HYG) straddling the zero line.
BDCs are softer after a solid run in 2023 and into early 2024. BDCs finally dropped just below the top quartile of the LTM period, so that will be a broader asset class to watch with the expectation of floating rates seeing downward pressure on the cash income part of total return. The credit cycle has remained resilient, however, as evident in the consistent HY spread compression. BIZD is running at +9.7% total return YTD but has been running into some headwinds the past month but were still positive for the month.
The bigger story in an eventful week was the sustained optimism around where the UST is headed and the apparent embrace of the sector rotation strategy that has pushed the Small Caps and driven the Russell 2000 (RUT) back into a rally of the sort seen in Dec 2023. Small Caps were up another +1.7% this past week bringing the trailing 1-month to +8.0%. Midcaps did not follow closely the past month and lagged again this past week with MDY down in the negative range.
Interest-rate-sensitive equities were rocking again with the Homebuilder ETF (XHB) at #2 on the week behind #1 Regional Banks (KRE). We see Real Estate (XLRE) and Financials (XLF) in the top quartile for the week.
The KRE returns have shown an ebb-and-flow pattern over the past year mixing rallies on rates with mixed numbers on the latest commercial real estate doom headlines. The impressive performance relative to expectations was that KRE has been #1 for 1-week, 1-month, and 3-months. Earnings season mixes an occasional ugly asset quality number in a narrower credit story while the overall tone during reporting season has offered ample reassurance on the “absence of disaster” for the great majority of the names. The earnings reports continue to roll out.

The 1-month returns stayed heavily weighted toward the positive side of the ledger at 26-6, with the score down from 31-1 last week. The low end in negative range is heavy on tech exposure with XLK in dead last and Base Metals just above. We see the Equal Weight NASDAQ 100 ETF (QQEW) and NASDAQ in negative range.
We see long duration assets still weak over the past month as the short end vs. long end shapeshifting debate continues. The long duration UST 20+ Year ETF (TLT) posted -1.45% for the 1-month period vs. the short duration UST 1Y to 3Y ETF (SHY) at +0.7% for the month. We see 6 of the 7 bond ETFs in a slightly positive range with only TLT in the red.
As noted earlier in the 1-week discussion, the Regional Banks ETF (KRE) were the big winners with Small Caps (RUT) a more distant #2 just ahead of Homebuilders (XHB) at #3 and Real Estate (XLRE) at #4. We see Midstream Energy (AMLP) and Energy (XLE) in the top quartile.

The 3-month period held again this week at 29-3, which was flat to last week’s score. The bottom of the list in negative range is Base Metals, E&P (XOP) and the broad Energy ETF (XLE). We see all positive numbers for the bond ETFs, but they are all housed in the third quartile and bottom quartile.
The battle for the leadership ranks shows Regional Banks (KRE) and Small Caps (RUT) battling it out in the top tier with the Tech ETF (XLK) and NASDAQ (IXIC). Real Estate (XLRE), Builders (XHB) and Mag 7 heavy S&P 500 and Consumer Discretionary ETF (XLY) are also jockeying for position up in the top quartile with Consumer Discretionary (XLY) near the lower end of the top group.
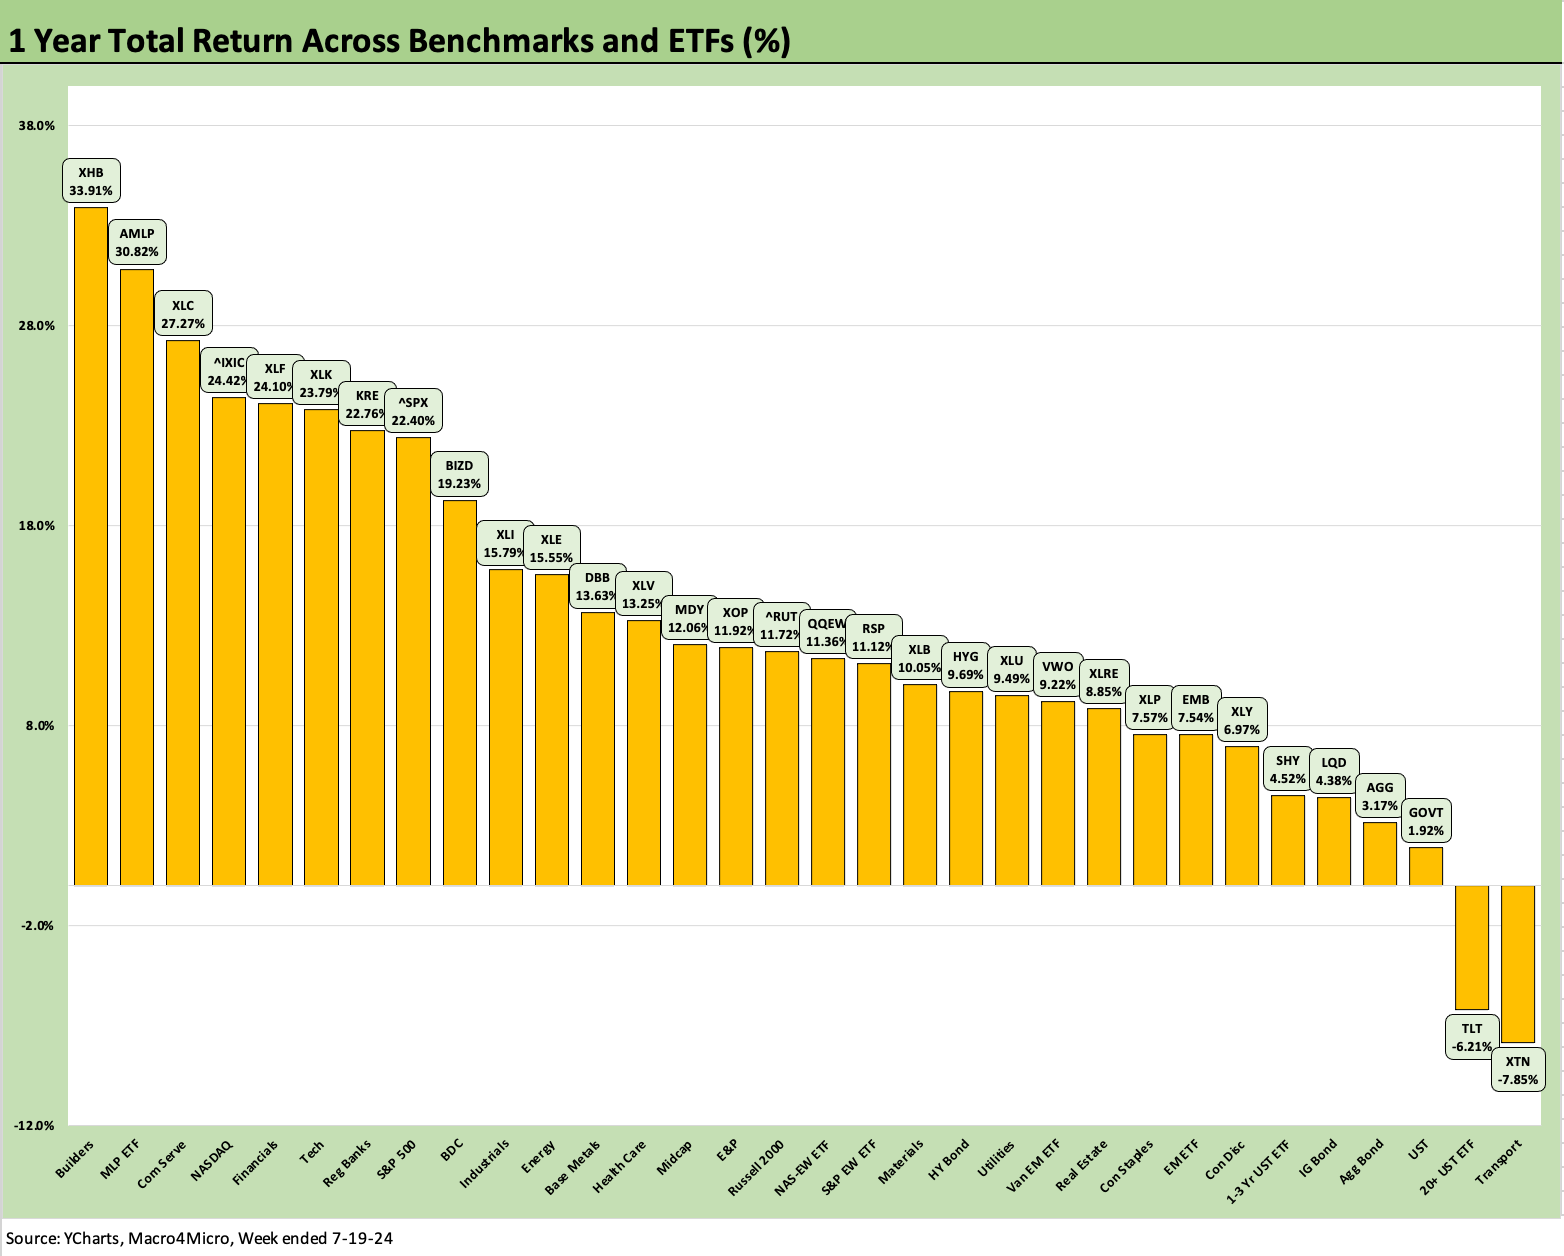
The LTM scoresheet remains at 30-2 with TLT and Transports (XTN) still sitting on the bottom. The most telling news is that Homebuilders (XHB) have rallied back into the #1 position after recently dropping down the ranks (see Homebuilder Equities: “Morning After” on Rate Optimism 7-12-24, Homebuilders: Equity Performance and Size Rankings 7-11-24). The strong performance after the CPI release during the prior week continued this past week with industry leader D.R. Horton popping up over +10% after its earnings release.
We see AMLP well positioned in a recurring reminder of the power of high dividend payouts and less volatility in revenue and earnings than the more commodity-exposed Upstream (E&P, Suppliers) and Downstream (Refining) players. Midstream operators have strong credit profiles, less business risk than other energy sectors, and a deep base of asset protection. They ran into a capex ceiling in many areas, and that is the wildcard for the post-election energy infrastructure planning.
The energy sector comes up a lot in the Trump speeches (“Drill baby drill” on Day 1). With record oil and gas production now, there are some wild scenarios one can craft with Trump. He can open up widespread infrastructure approval (Keystone Part N+1?), uncap the LNG project limits, greenlight more E&P with incentives and arbitrary deregulation (the Supreme Court’s Chevron decision raises lots of issues), and throws Ukraine under the tank and frees up Russian oil. Then again, he always might light up Iran and jam up the strait of Hormuz. Somewhere in there you could see a supply boom – or some major geopolitical problems. That makes for tough scenario spinning.
See also:
Industrial Production June 2024: Is the Sector Rotation Alive? 7-17-24
Housing Starts June 2024: Still All About the Deliveries 7-17-24
Retail Sales: Second Wind 7-16-24
Footnotes & Flashbacks: Credit Markets 7-15-24
Footnotes & Flashbacks: State of Yields 7-14-24
Footnotes & Flashbacks: Asset Returns 7-13-24
Consumer Sentiment: Still Feeling the Heat 7-12-24
Homebuilder Equities: “Morning After” on Rate Optimism 7-12-24
Homebuilders: Equity Performance and Size Rankings 7-11-24
CPI June 2024: Good News is Good News 7-11-24
Footnotes & Flashbacks: Credit Markets 7-8-24
The B vs. CCC Battle: Tough Neighborhood, Rough Players 7-7-24
Payroll June 2024: The Race Gets Confusing 7-5-24
JOLTS May 2024: The Jobs Oasis Still Has Water 7-2-24
Footnotes & Flashbacks: Credit Markets 7-1-24
State Unemployment: A Sum-of-the-Parts BS Detector 6-30-24
The Debate: The China Deficit and Who Pays the Tariff? 6-29-24