
Footnotes & Flashbacks: State of Yields 7-21-24
The week was slightly negative for duration as the handicapping of the 2025 story on deficits, tariffs, inflation, and the UST slope heat up.


Make my economy big, bigly, bigliest…win, win, win…greatest ever…again!
The broad tech sell-off and continued rebound in interest-rate-sensitive industries were the main events on the week with the Presidential election factor starting to roll into some near-term UST reactions.
The UST curve had been somewhat mixed across the week for UST segments as the hope for sustained lower inflation is getting swept up in the tariff debates and deficit themes that were front and center with the GOP convention.
The questions around how massive tariffs, mass deportations, potential inflation fallout, and a lack of specifics on deficit plans all served to push rates higher on the week.
We roll into a big economic release week with advance numbers on 2Q24 GDP and a fresh round of PCE inputs with some additional housing and durable goods data.

The above chart updates some key historical UST curves outside the ZIRP and “normalization” markets. We include the details in the embedded box on the chart.
These periods run from the 1978 Carter period inversion and then across the stagflation double-dip of Carter/Reagan, the 1989 credit cycle peak under George H.W. Bush, the 2000 TMT cycle turn under Clinton, the housing and structured credit bubble peak (2006) under George W. Bush, the recent Oct 2023 UST curve highs under Biden, and last week’s close.
For those using a cyclical scoresheet, Trump operated in a ZIRP and normalization world. For those with amnesia, he was demanding that Powell use negative rates when economic trends were struggling. The idea was if Germany had negative rates for a while, the US should have them. That would be the same economy as in his acceptance speech this week that he called “the greatest economy in the history of the world.” The assumption must be that the 1980s and 1990s never happened in the US.
The recurring takeaway in long term context is that current rates are in fact low if you look through a lens that blocks out the ZIRP and QE years and the extraordinary stretch of accommodation from the fall 2008 crisis through COVID into early 2022 and then on to the start of the second inflation war in March 2022 and the first in over 4 decades.

The above chart updates the comparative UST curves of 10-19-23 (at the 10Y UST peak) vs. the starting point for 2024 and the UST to end last week. The current 2Y UST is +26 bps to where the year started while the 10Y UST is +37 bps. The market consensus had been expecting a very different profile to unfold at the start of 2024, but optimism is getting back into the game. It is easier to be optimistic about the 3M UST than the 10Y UST.
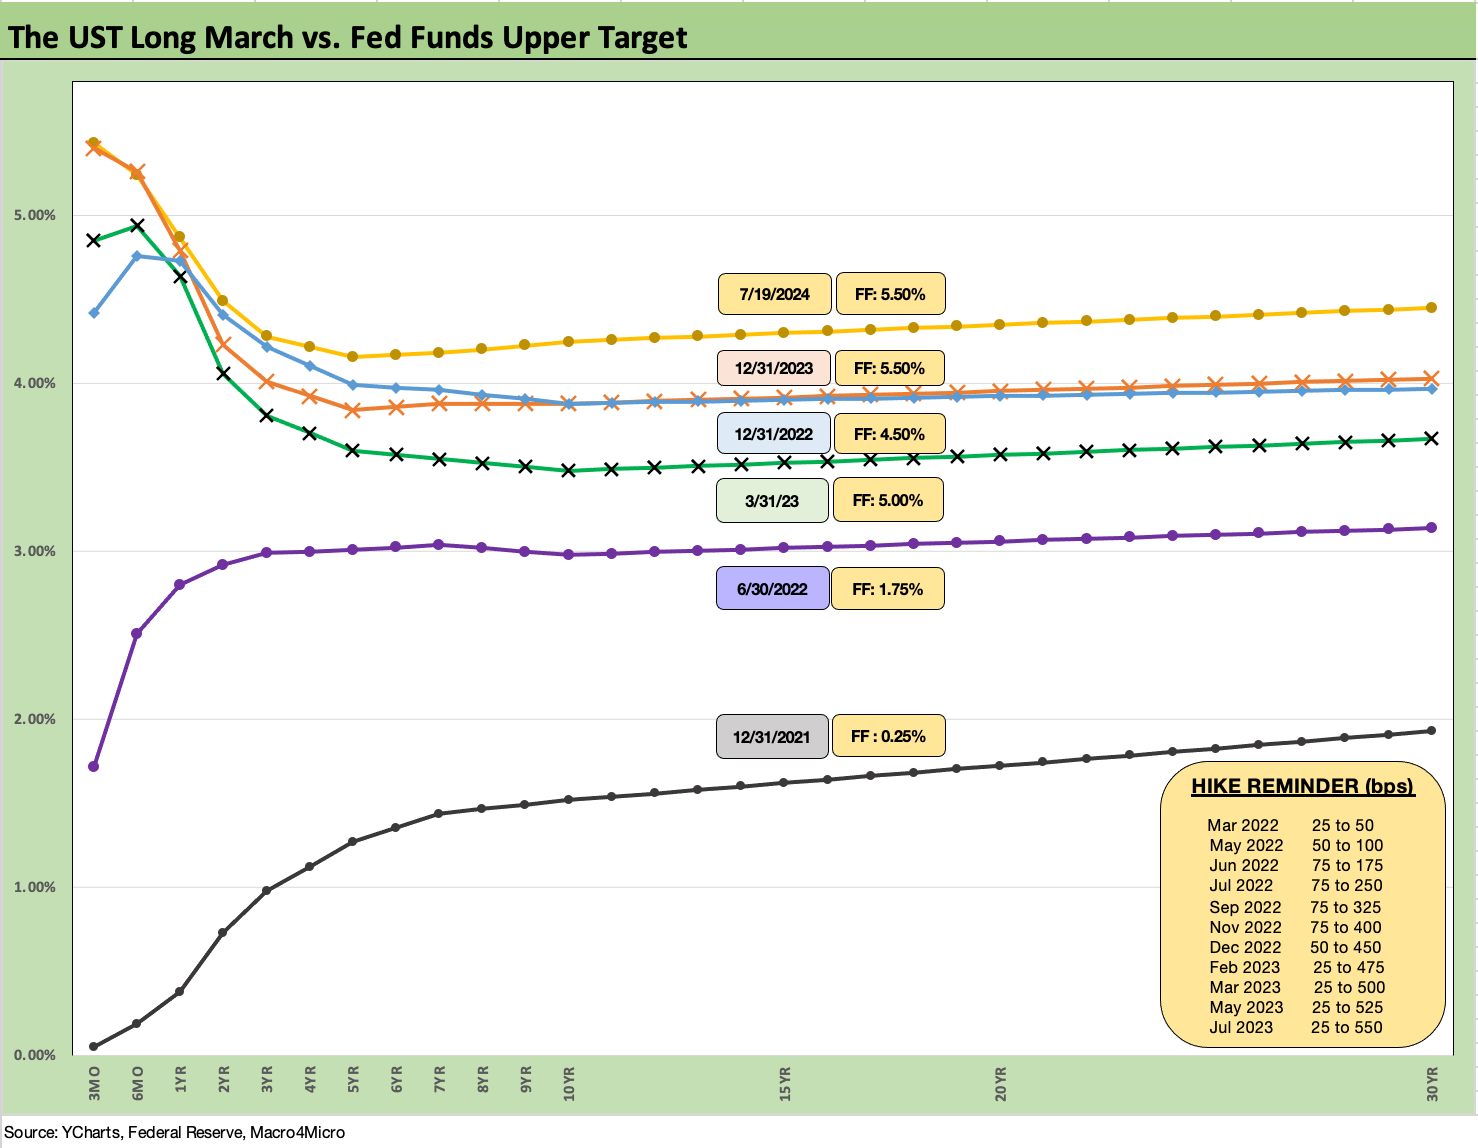
The above chart is our recurring reminder of how the 12-31-22 and 12-31-23 UST curves converged in longer maturities despite the 100 bps differential in fed funds. It is a data point for those forecasting the 10Y to follow fed funds lower during the anticipated easing cycle that is being handicapped for the fall or in 2025 when Trump seeks to fire Powell and take over the Fed. In the end, the Fed (or White House potentially) can set the short end, but the market determines the long end. You can bully regulators and legislators (or shoot a few of them if it is “official”), but the flows and the economic realities will set the long end.

The above chart updates the weekly UST deltas with a slightly bearish UST curve action that undermined bond returns on the week (see Footnotes & Flashbacks: Asset Returns 7-20-24). The upward move in rates on the week did not prevent a slight downtick in 30Y mortgages as we detail below. The optimism around the direction of fed funds and short rates for now is more straightforward than making the case that the long end will follow.

The above chart updates the adverse shift for 2024 YTD along the UST curve. The UST bulls are still waiting for their day on duration returns in 2024.

The above chart updates the running downward shift in UST rates from the 10-19-23 peak date for the 10Y UST. The Nov-Dec 2023 run in rates also saw a broadening of the equity boom that included an impressive – but brief – rally in small caps in December.
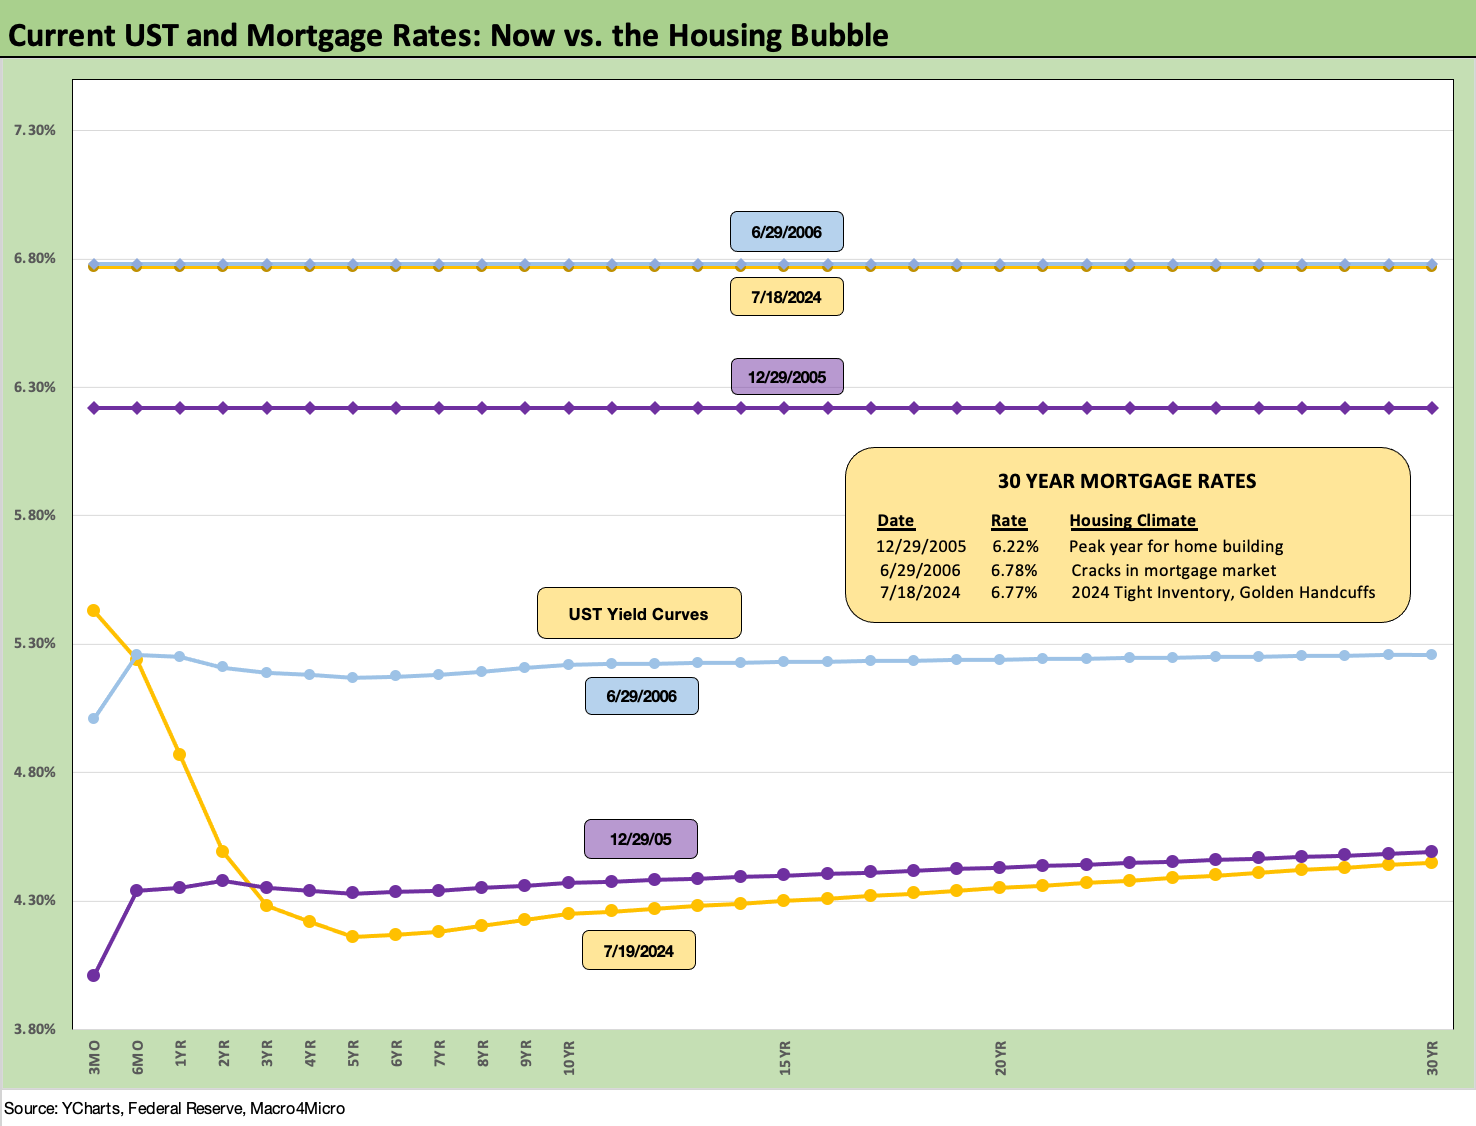
The above chart updates the most recent Freddie Mac 30Y benchmark (updated on Thursdays), and we see another move lower to 6.77% this week. This chart includes the Freddie Mac benchmark for the peak homebuilding year (2005) and one for the mid-2006 period when the RMBS market was getting spooky. We include those three Freddie 30Y benchmarks on the horizontal lines.
The current mortgage rates have converged with the mid-2006 period despite materially lower UST curve today than mid-2006. The current 10Y UST is also below 2005 while the short end now is notably higher.
We also plot the UST curves for each of those dates. The current distinctive inversion reminds us that this is a very strange market considering that all three periods were during strong, “risk-on” markets at the back end of a tightening cycle. The bear flattener of the 2003 to 2006 period was not an inflation fighting period, but it was a Fed tightening cycle coming off the post-TMT mega-easing by Greenspan (see Greenspan’s Last Hurrah: His Wild Finish Before the Crisis10-30-22 ).

The above chart updates the 3M to 10Y UST slope since 1984. We see the inversion now still running at a hefty -118 bps, which is in a very different world than the long-term upward-sloping median of +161 bps. The peak inversion was -189 bps in May and June of 2023.
With the range of outcomes possible for inflation, fiscal/monetary policies, and the impact on the UST curve in 2025, the event-driven economic risks and monetary governance questions certainly do not give cause for a mad dash to extension unless you have a very strong view on the outcomes of the election and which policy chatter is “talk vs. walk.”

The above chart shortens the timeline to the beginning of 2021 for better visuals on the transition of the 3M to 10Y UST slope from the ZIRP period into the tightening cycle. We see a +227 bps peak slope in May 2022 on the way to the -189 bps inversion peaks in May/June 2023. This slope has been volatile around the 10Y UST swings along with the uneven pace of tightening actions.

We wrap with our running update of the UST deltas since the beginning of March 2022 ahead of the end of ZIRP in mid-March (ZIRP ended effective 3-17-22). We also include the 12-31-2020 UST curve and the peak 10-19-23 as frames of reference.
The UST curve expectations will be in for a wild ride that combine objective economic releases with highly subjective speculation on policies and potential outcomes.
See also:
Footnotes & Flashbacks: Asset Returns 7-20-24
Industrial Production June 2024: Is the Sector Rotation Alive? 7-17-24
Housing Starts June 2024: Still All About the Deliveries 7-17-24
Retail Sales: Second Wind 7-16-24
Footnotes & Flashbacks: Credit Markets 7-15-24
Footnotes & Flashbacks: State of Yields 7-14-24
Footnotes & Flashbacks: Asset Returns 7-13-24
Consumer Sentiment: Still Feeling the Heat 7-12-24
Homebuilder Equities: “Morning After” on Rate Optimism 7-12-24
Homebuilders: Equity Performance and Size Rankings 7-11-24