
JOLTS May 2024: The Jobs Oasis Still Has Water
We look at the latest JOLTS report with numbers little changed across the board and openings well above the pre-COVID peak of Nov 2018.


Headline Job Openings remain steady at 8.1 million, which is higher than the pre-COVID peak, while Hires in May ticked higher on the month and outpaced a small rise in Layoffs/Discharges (SAAR data).
Despite an ample number of reasons for many to be unhappy with their financial pressures, the reality remains that jobs are there to be had even if some constitute structural underemployment, might reflect a step down, are part time, or are second jobs.
The steady state job openings picture for May (1-month lag) is not telling a story of a cyclical turn yet and does not send doves into a celebration flight as the market awaits the payroll details for June on Friday.

The above chart updates the Job Openings for May 2024 (1-month lag), and this release was another one with the phrase “changed little” and “little changed” showing up in brief text detailing Job Openings, Hires, Separations, Quits, Layoffs/Discharges, and “Other Separations” (which covers death, disability, and transfer of locations).
The main takeaway to us is that the current Job Openings total is above the highest level posted before the pandemic (7.5 million Nov 2018). Someone should slip Biden an index card in large font that says, “After the 4 million decline in Job Openings from the peak of March 2022, the latest Job Openings is higher than the best level achieved under Donald Trump one year after his massive tax cut.” Trump will respond, “Every economist knows I had the highest job openings number ever ever ever…EVER!”
Any candidate that claims they can miraculously improve the employment picture with record payroll on the books now and the economy at a cyclical high is a lying SoS – in other words, a politician. We look into the occupational line items and dig in the weeds each month on the mix (see Payroll May 2024: The Wave Continues 6-7-24). The news has been good for the rising count of “heads with paychecks,” but the PCE lines are still doing a mild fade as household debt service and confidence in spending has been sliding somewhat relative to wages (see PCE, Income and Outlays: Practicing Safe Growth? 6-28-24).

The above chart updates the hires as a multiple of layoffs. That stands at almost 3.5x this past month and is trending lower. The long term median is 3.0x, so that is a reminder the US is a growing economy with demographics still favoring more hiring as long as the growth does not get derailed by reckless shifts in policy that catch headlines just ahead of the point where the economy will catch hell. Nothing like a tariff binge, trade wars with major suppliers (China) and a massive disruption in North America free trade to get that turmoil inflamed.

The above chart updates the timeline of Hires vs. Layoffs/Discharges used in the multiple broken out in the prior chart. We reduce the distortion in this chart above by removing the COVID numbers. Current Hires are well above the long-term median.
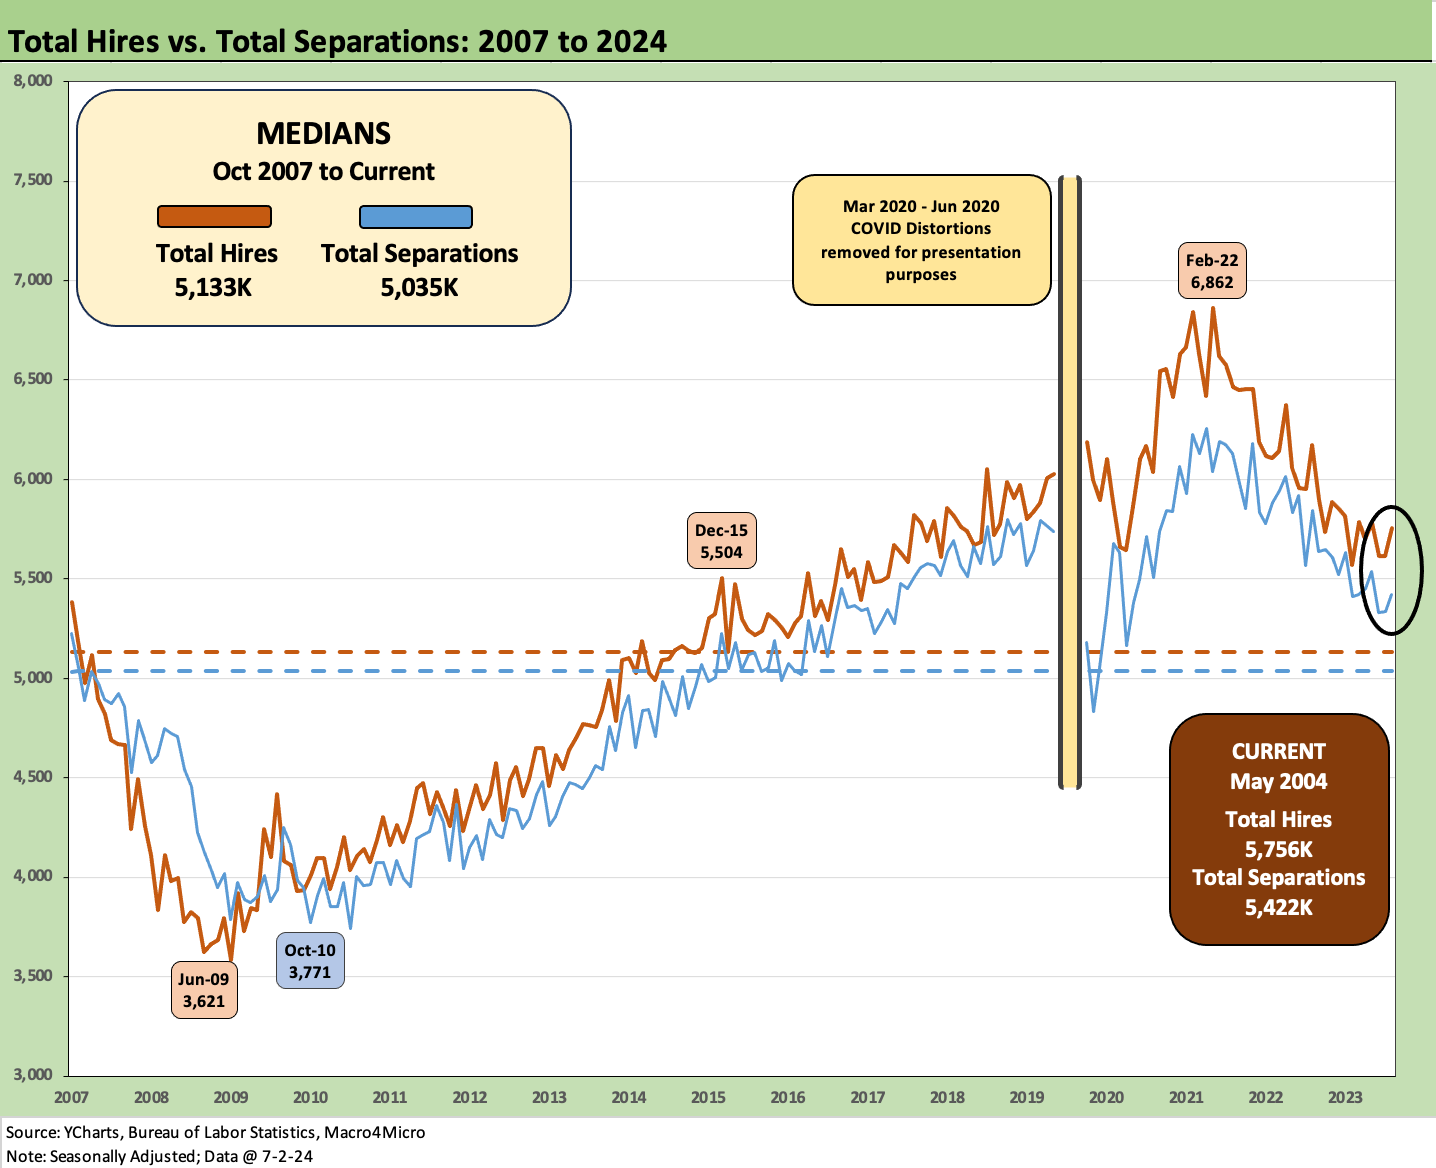
The above chart plots the total numbers of Hires vs Separations (Quits, Layoffs/Discharges, Other). We remove the COVID disruptions and detail those in the text box below. Both Hires and Separations are well above the long term medians cited in the chart.

The above text is a replay each month that frames the economic chaos of the COVID period. With almost 28 million in separations across March and April 2020, it is safe to say some economic models don’t make allowances for such inputs in framing how growth, supply, demand, and pricing trends might play out in the following periods.

The above chart updates the “Hiring minus Separations” differential time series. The current differential of 334K is 1.7x the long term median.
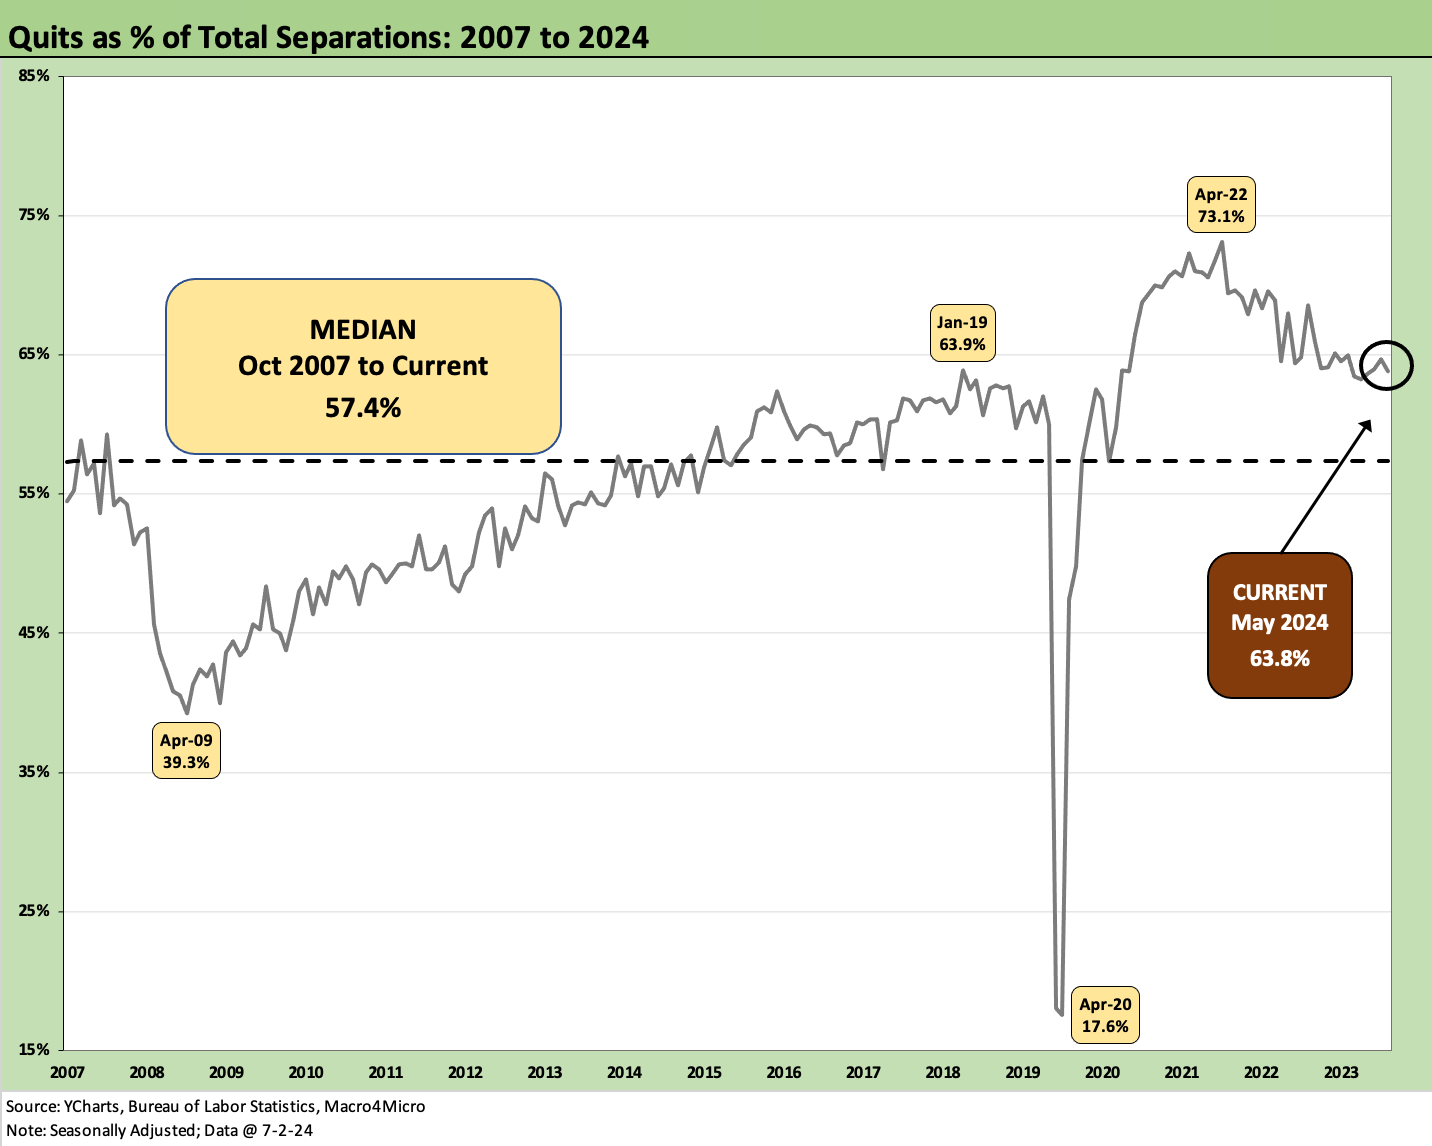
The chart above tracks the Quits share of total Separations which was 63.8% or comfortably above the long-term median of 57.4%.
“Quits” get a lot of attention for what it theoretically reflects about confidence (as opposed to disgust and disdain). The “Quits Rate” (Quits as a % Total Employment) on a SAAR basis continues to move sideways at 2.2% with the Quits total essentially flat at 3.4 million. Not seasonally adjusted was 2.3%. In other words, “nothing to see here.”
See also:
Footnotes & Flashbacks: Credit Markets 7-1-24
Footnotes & Flashbacks: State of Yields 6-30-24
Footnotes & Flashbacks: Asset Returns 6-30-24
State Unemployment: A Sum-of-the-Parts BS Detector 6-30-24
The Debate: The China Deficit and Who Pays the Tariff? 6-29-24
PCE, Income and Outlays: Practicing Safe Growth? 6-28-24
Durable Goods: Playing Defense 6-27-24