
Footnotes & Flashbacks: Credit Markets 7-1-24
We look at credit market performance and valuation profiles at June 30 as a politically toxified home stretch awaits.


US voter poll volunteer training program for 2024 election.
We look at total returns and excess returns for IG vs. HY through June 30 as taking credit risk in a short duration sector easily won the first half in total returns and won the numerical contest in excess returns (as it is supposed to with more risk).
We look at BBB vs. BB with total returns for BBB held back by duration YTD relative to the less exposed BB tier while BBs got the job done in excess return.
Next, we roll into the home stretch of a year with very compressed spreads and questionable relative risk compensation in the lower credit tiers.
We update the yield and spread backdrop for credit markets at midyear as credit compensation compression still rules, and the ability of the market to price in forward uncertainties is suspect.
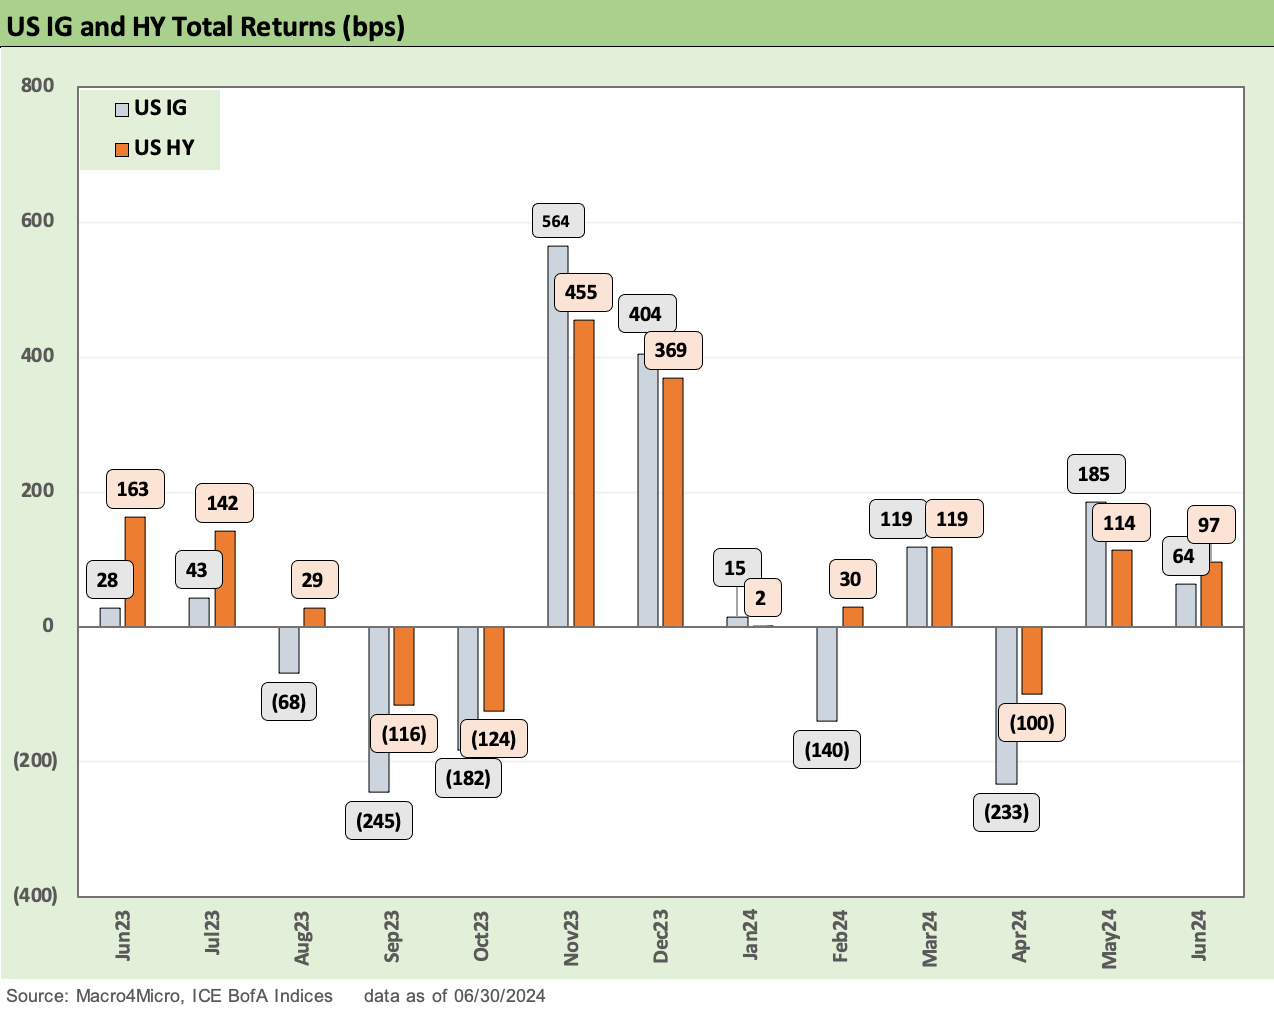
The above chart revisits the monthly timeline from June 2023 to June 2024 for total returns in IG Corporates and HY bonds. The pattern offers a reminder that the UST moves have dominated the story line in total returns across a period when handicapping the timeline to easing has been a daily focus. The monster rally in Nov-Dec 2023 stands out in the chart for the UST move away from the highs of late Oct 2023 (10-19-23).
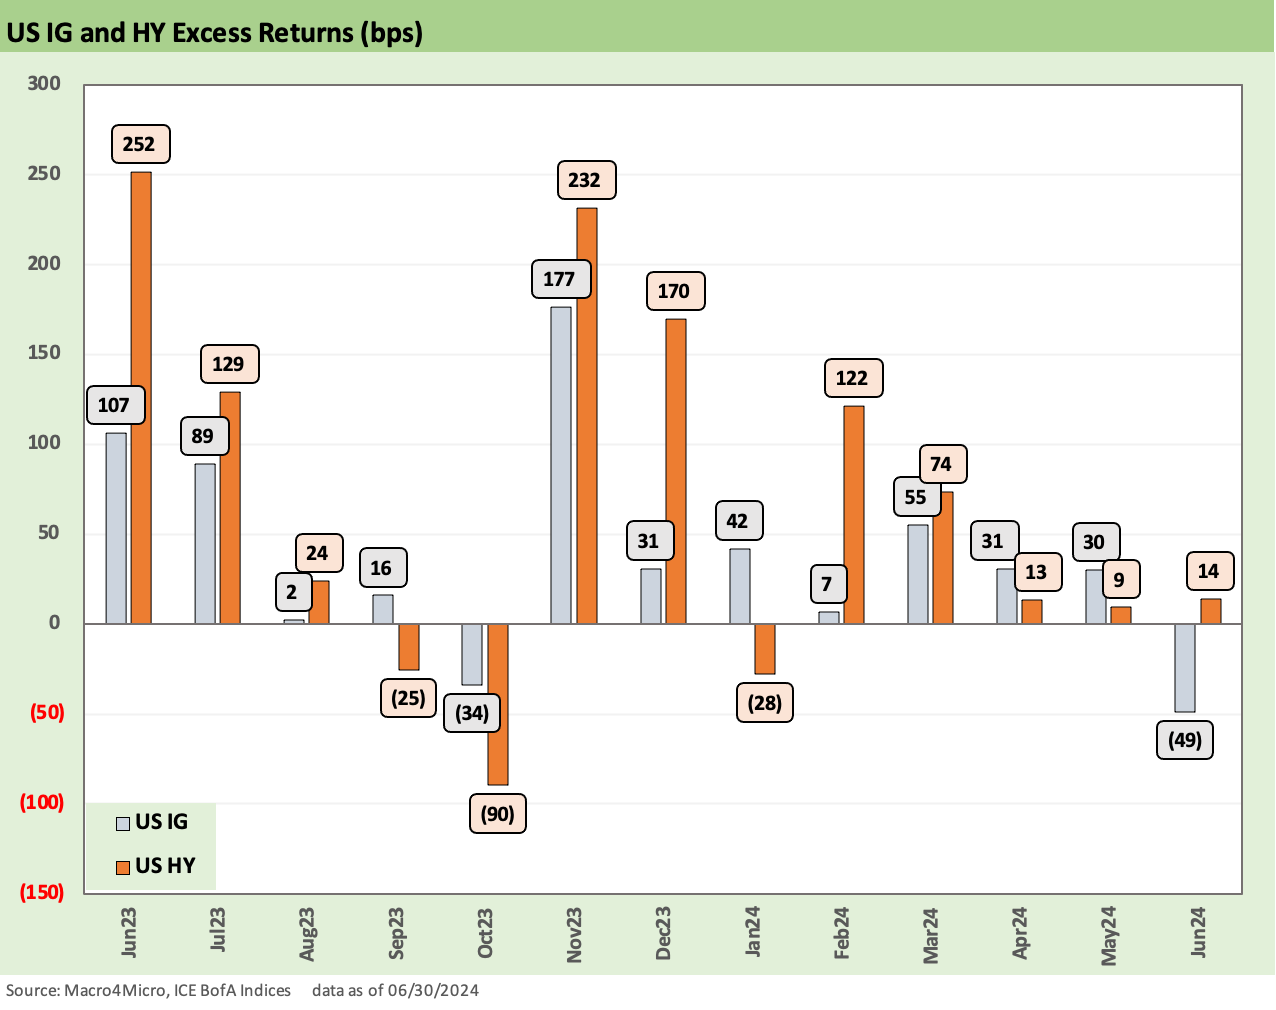
The above chart plots comparative excess returns by month for IG vs. HY, where the view on performance is more subjective. At a minimum, excess returns for HY should be higher than IG since you are taking more risk in HY. As we have covered in past commentaries, there are plenty of markets where excess returns fall short. The 2023-2024 period so far has not been one of those times. The excess returns of HY have worked well enough with a few whipsaws along the way.
The excess return conversation gets a bit more artistic in the next stage with time horizons and portfolio parameters (risk appetite, duration goals, coupon income and cash flow) getting into the picture. Cash income has not been as big a part of the return story after so many low coupons got locked in, and HY overall is more BB tier heavy than in the golden years of HY classic before the crisis.
As more refinancing and extension takes place and more current coupons get into the picture, the HY market will be back in a transition period where the contributors to total return (cash vs. price vs. spreads) shift somewhat. The pull-to-par effect on price in refinancing is a wildcard based on the quirks of the redemption provisions for each bond and issuer and how confident a liability management decision maker feels about stalling until they tap the market. There are some big macro variables to wrestle with ahead on the cycle, trade, monetary policy, and what two very different Presidential candidates pursue as policies subject to who takes the helm (or throne per the Supreme Court).
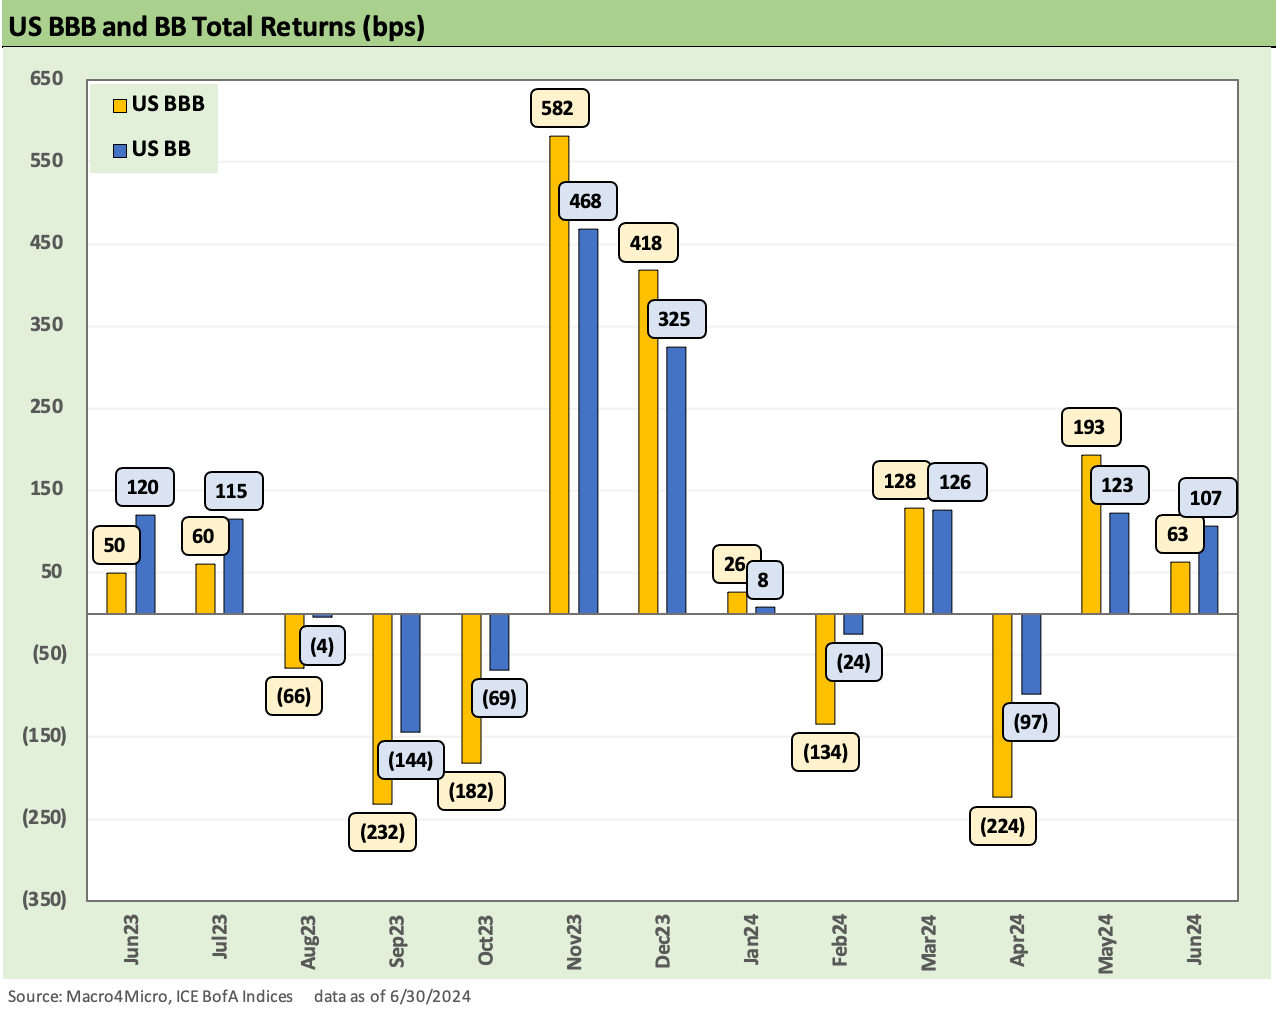
The above chart frames BBB total returns vs. BB, and the UST has been the main driver of the longer duration BBB tier (duration of 6.5 at 6-30-24) vs. the shorter duration BB tier (duration of 3.5). The big UST rally on Nov-Dec 2023 gave the BBB tier total return a nice lift even with BB OAS rallying also. The adverse 2024 YTD moves of the UST curve were not as kind as the strong finish to 2023.
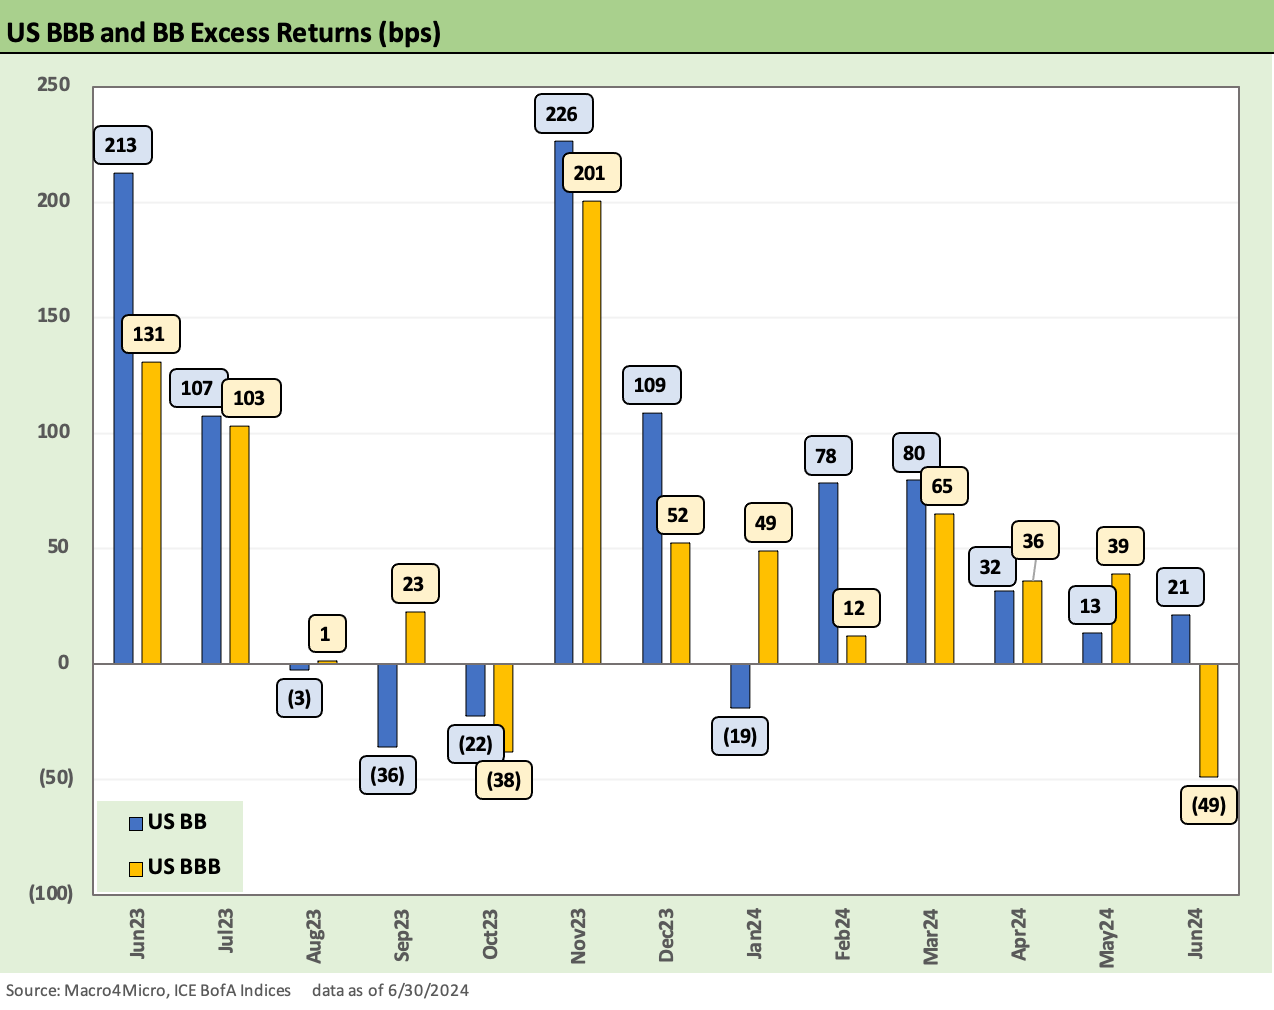
The excess return picture paints a favorable view of the relative performance of the BB tier across some key months where the market saw big swings. The moves are usually lumpy, and the past year was no different.
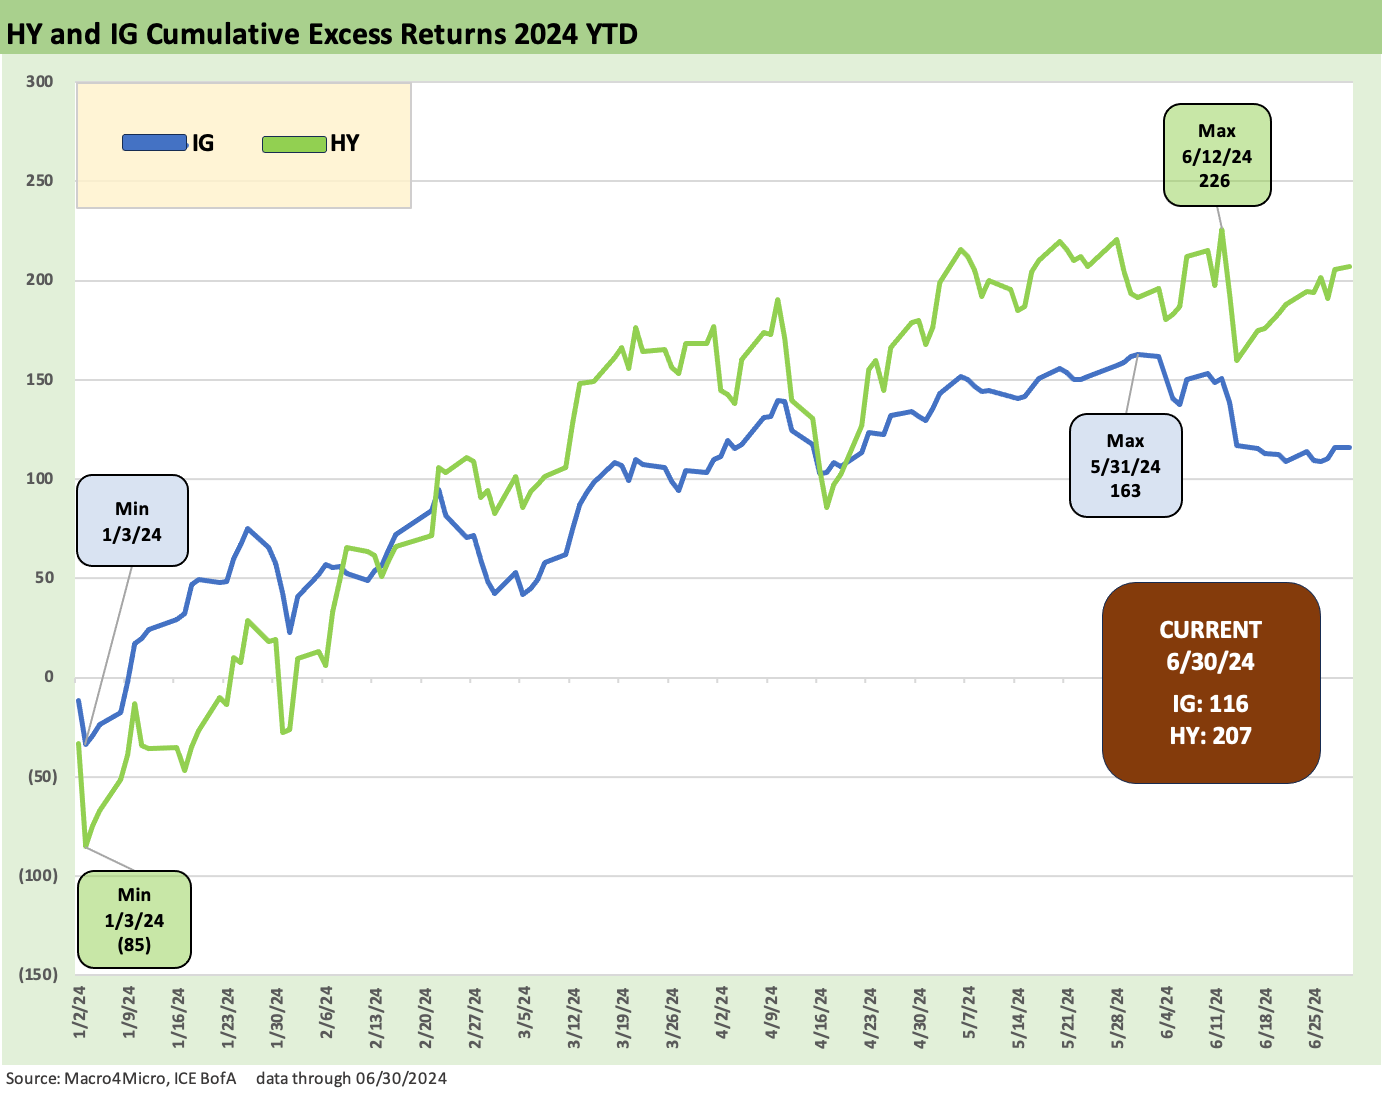
The above chart looks at running excess returns cumulatively YTD 2024 for HY vs IG. HY is doing its job in pricing much better credit returns than IG given the mix of variables and sustained bullish risk appetites in credit markets from loans to bonds to private credit.
Shorter duration assets also have an edge in terms of demand given the low term premiums the market has received for interest rate risk. That topic has been picked over in the face of such steep inversions for such a protracted period.
From a midyear starting point as of July 2024, credit spreads are anything but compelling at this point. We look at those histories in other charts, but the fact remains that the OAS to wrap midyear was more in line with past credit peaks such as late 1997 and mid 2007 among the pre-crisis peaks and June 2014 and Oct 2018 in the post-crisis ZIRP and mild normalization periods. Spreads are tight, plain and simple, but have held in very well after an especially strong rally to wrap 2023 in Nov-Dec (see HY Spreads: Celebrating Tumultuous Times at a Credit Peak 6-13-24).
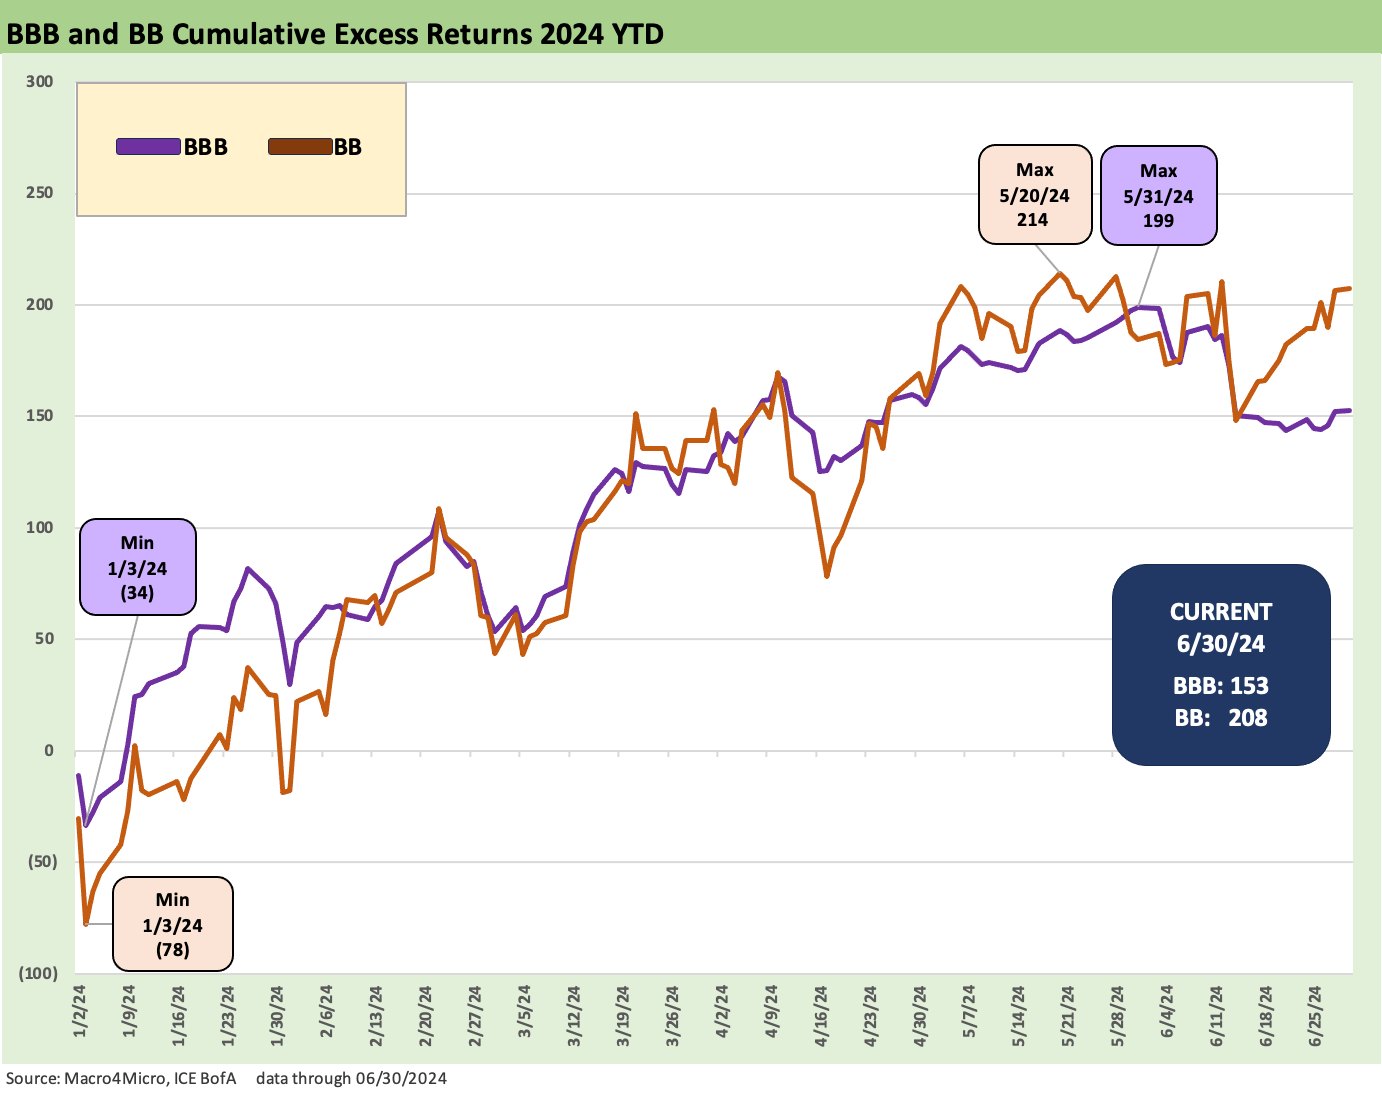
The above chart plots the BBB vs. BB running excess return patterns for 1H24. BBB vs. BB OAS has been compressed as we covered in our recent commentaries (see HY Spreads: The BB vs. BBB Spread Compression 6-13-24), and the incremental spread compensation is now down around past cyclical low points as we cover in a separate chart herein.
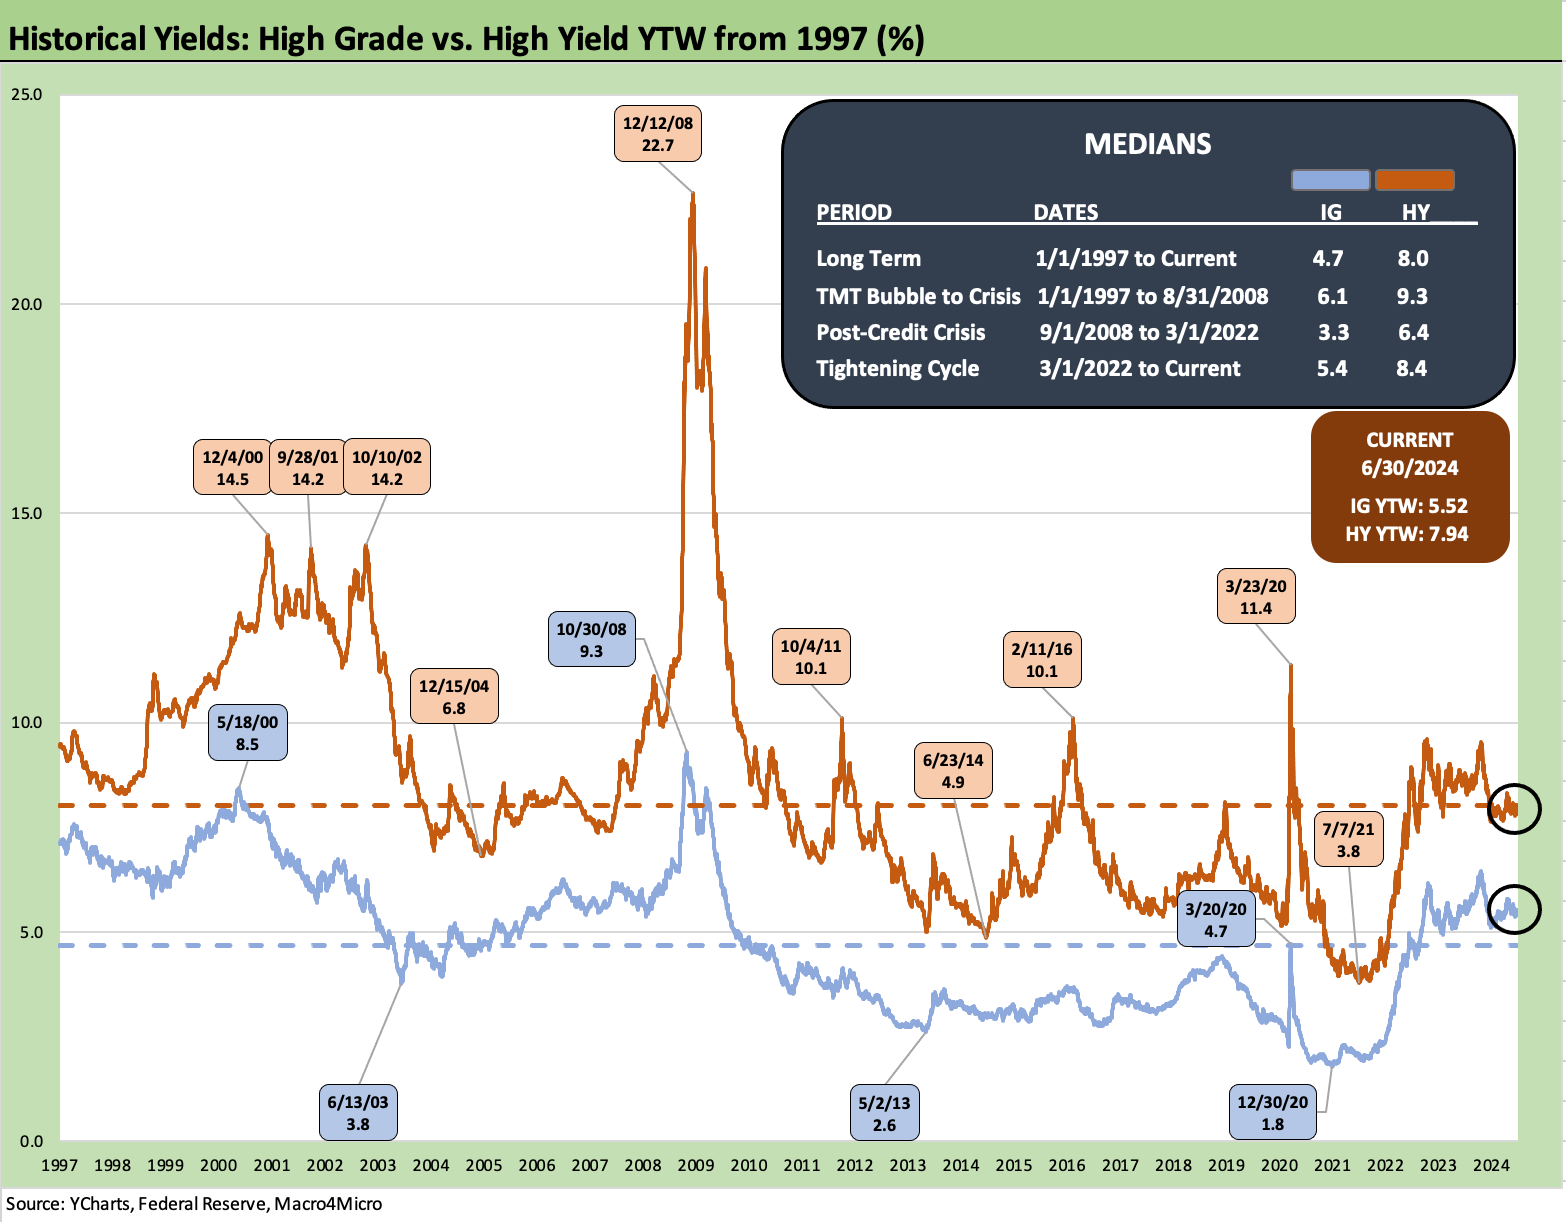
The above chart shifts us back to the topic of comparative yields and spreads. The timeline runs from the TMT boom of the late 1990s across the TMT default cycle and the Greenspan mega-easing of 2001 on through the 1% fed funds to start 2004 as the housing bubble and structured credit excess blew up the market after the June 2007 spread lows.
The recession was later officially framed as starting on Dec 2007 even if the systemic crisis exploded in Sept 2008 with the Lehman and AIG events plus Merrill getting folded into BofA. The dates can be debated, but for this chart we set the pre-crisis time horizon from the start of 1997 and break out some timeline medians through the summer of 2008. We consider the median from 1-1-97 through 8-31-08 as the most useful frame of reference for the world outside ZIRP in an old fashioned world of credit cycles and volatility (i.e. outside systemic panic and Fed and fiscal bailouts).
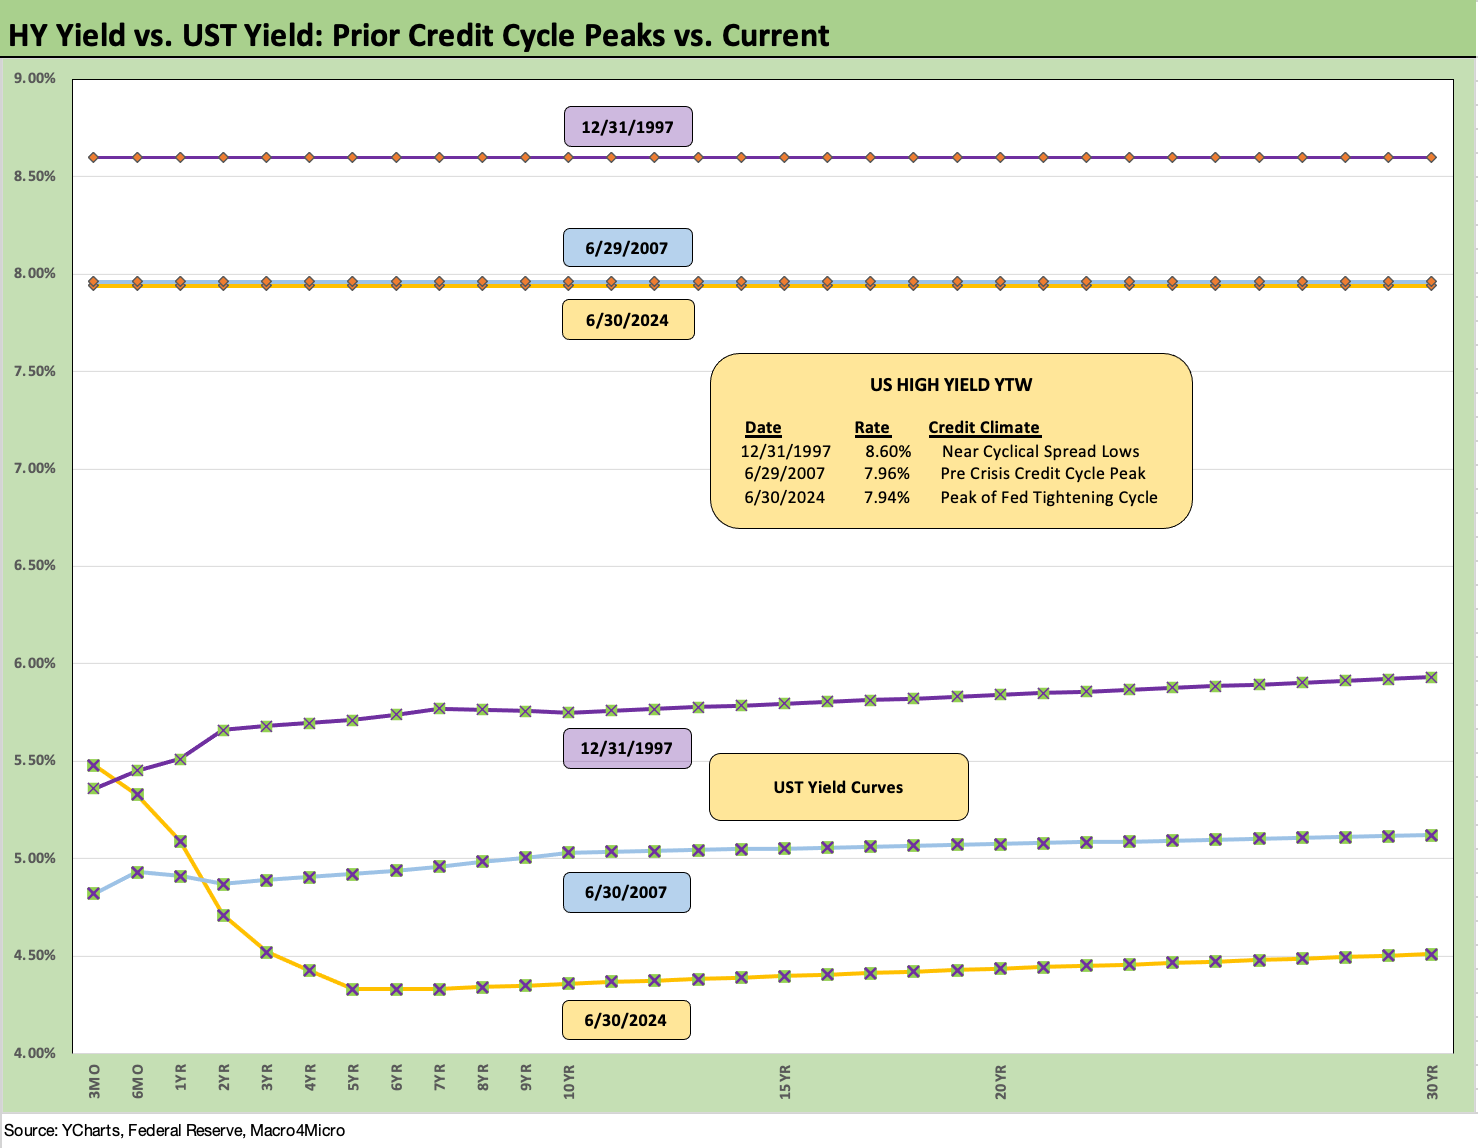
Using that rationale, the current yields of 5.52% for IG and 7.94% can be stacked up against 6.1% in HY and 9.3% in IG. Considering that spreads are very compressed and UST rates below the rates of earlier credit cycle peaks, those comparisons make more sense than comparing to a ZIRP and QE or minimal rates world seen from late 2008 through the early stages of the current tightening cycle. The current UST rate backdrop is quite low in the broader multicycle context against non-ZIRP periods (see Footnotes & Flashbacks: State of Yields 6-30-24).
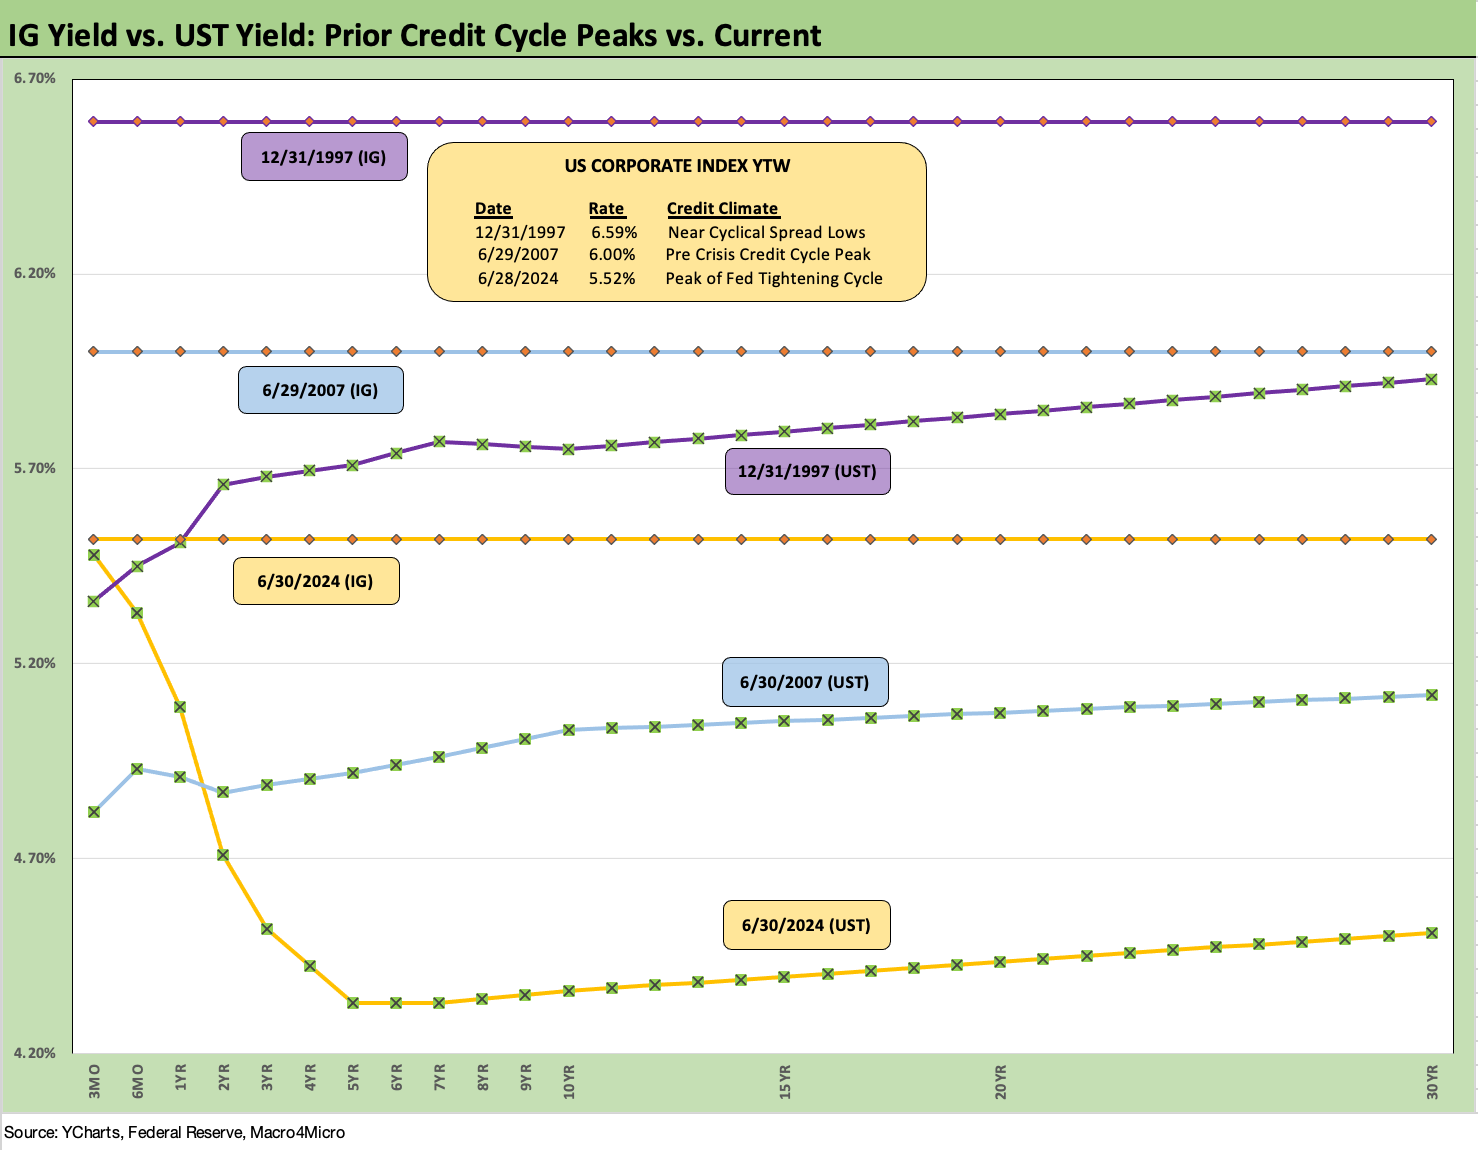
The above chart revisits two major credit cycle peaks, one in late 1997 and the other in mid-2007. We post the IG yields for these three periods using 6-30-24 levels and those from the end of 1997 and late June 2007. We also plot the UST curves of that period for context.
We see the all-in YTW for the end of June 2007 and June 2024 in a relatively narrow band. While the IG index yield at the end of 1997 was materially higher, IG spreads hit a low on Oct 1997 at +53 bps and ended the year at +70 bps vs. the end of June 2024 close of +96 bps. June 2007 saw IG spreads at the end of June at +100 bps. So, the current market OAS is in the area of the June 2007 credit bubble peak but wide to the all-time lows of 1997.
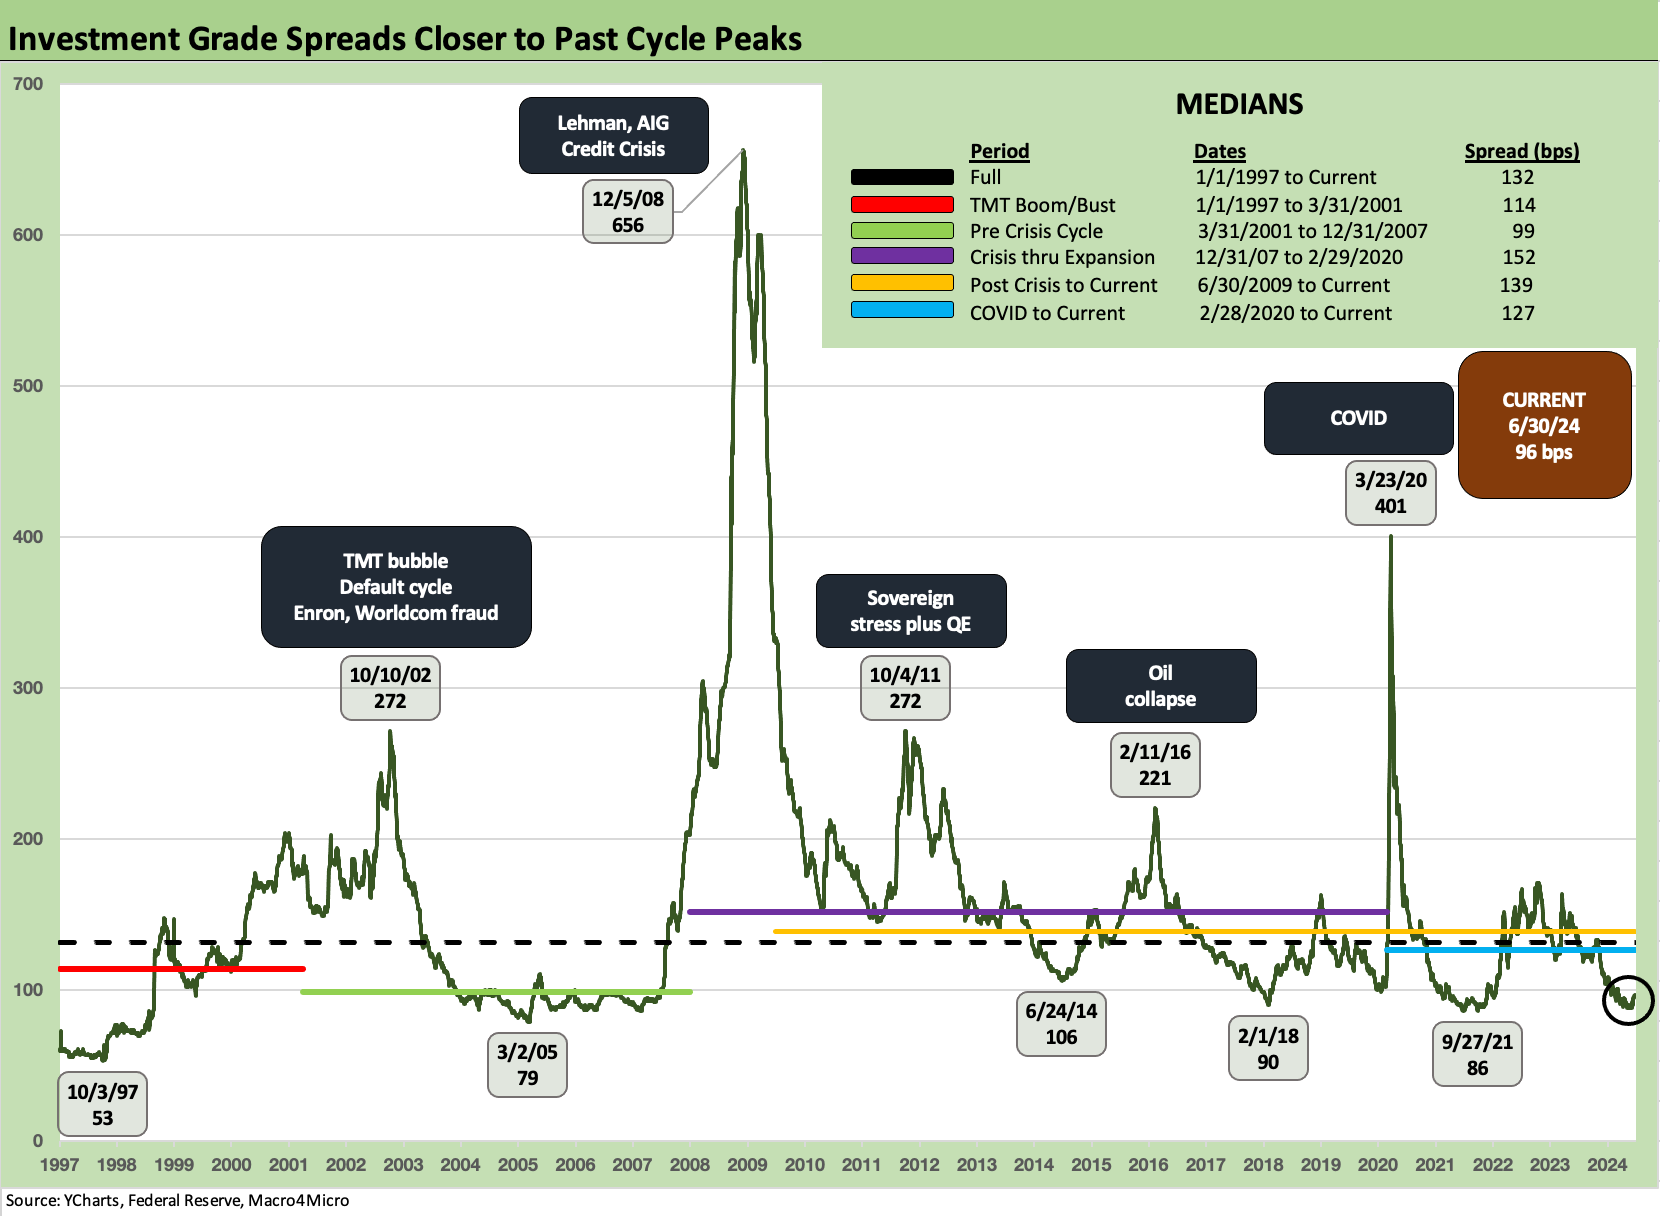
The above chart frames the running IG spreads across the longer term timelines. The highs and lows are noted with the current +96 bps still wide to the March 2005 tights (just before the auto downgrade fears and related volatility) and closer to the lower UST periods of June 2014 of +106 bps (ZIRP), +90 bps in Feb 2018 (mild normalization attempts by Fed during that period), and Feb 2021 at +86 bps (ZIRP). The 6-30-24 IG OAS of +96 bps is in the zone of the 1H04 to 1H07 average and the 1997-1998 average. Those periods offer a reminder that tight IG spreads can last for a protracted period.
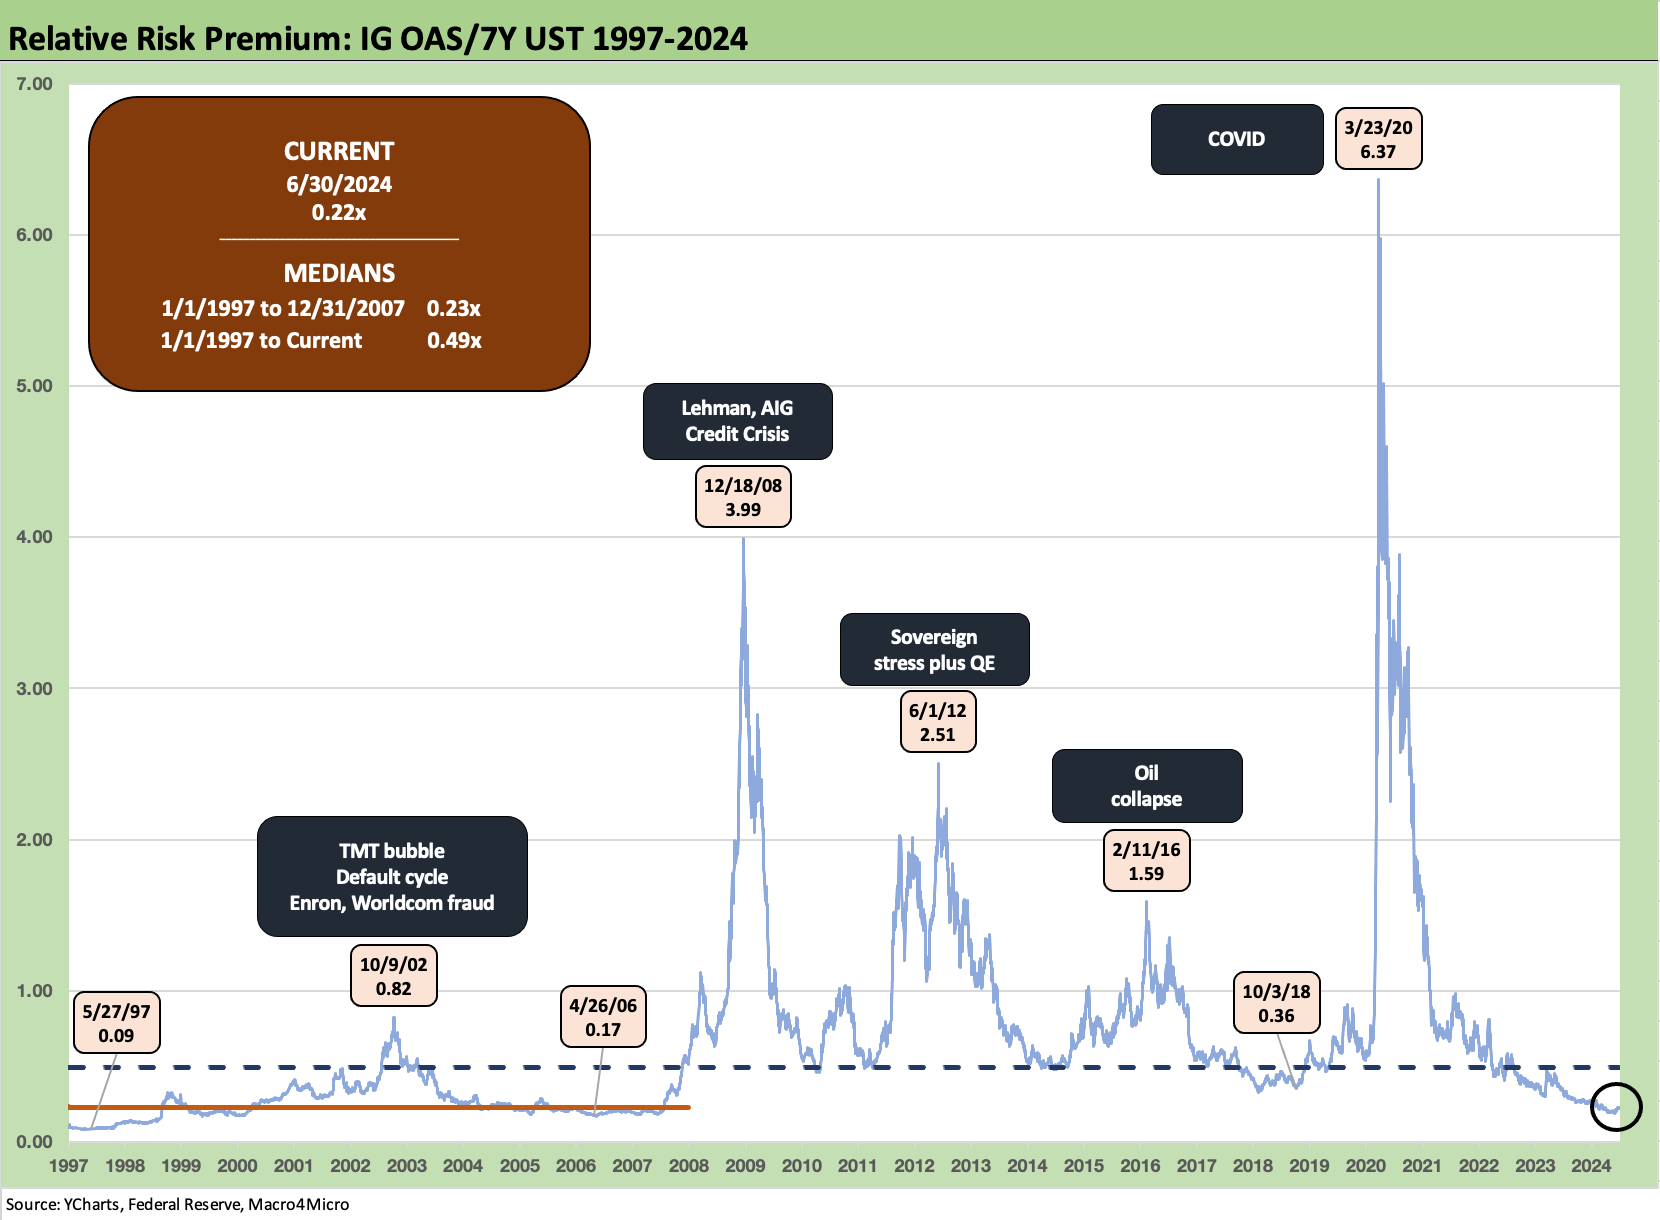
The above chart uses a metric we prefer for HY that we detail further below. We take the index OAS and frame it against a relevant UST maturity consistent with the IG index duration (we use the 7Y UST). The ratio gives a proportionate risk premium measure on the compensation received for taking the IG basket of credit risk. The current level of 0.22x is consistent with the pre-crisis median level (using 1-1-97 to 12-31-07) before ZIRP brought substantial distortions to the denominator. We used 12-31-07 in this case since that marked NBER’s official recession start. The long-term median including the ZIRP years was 0.49x.
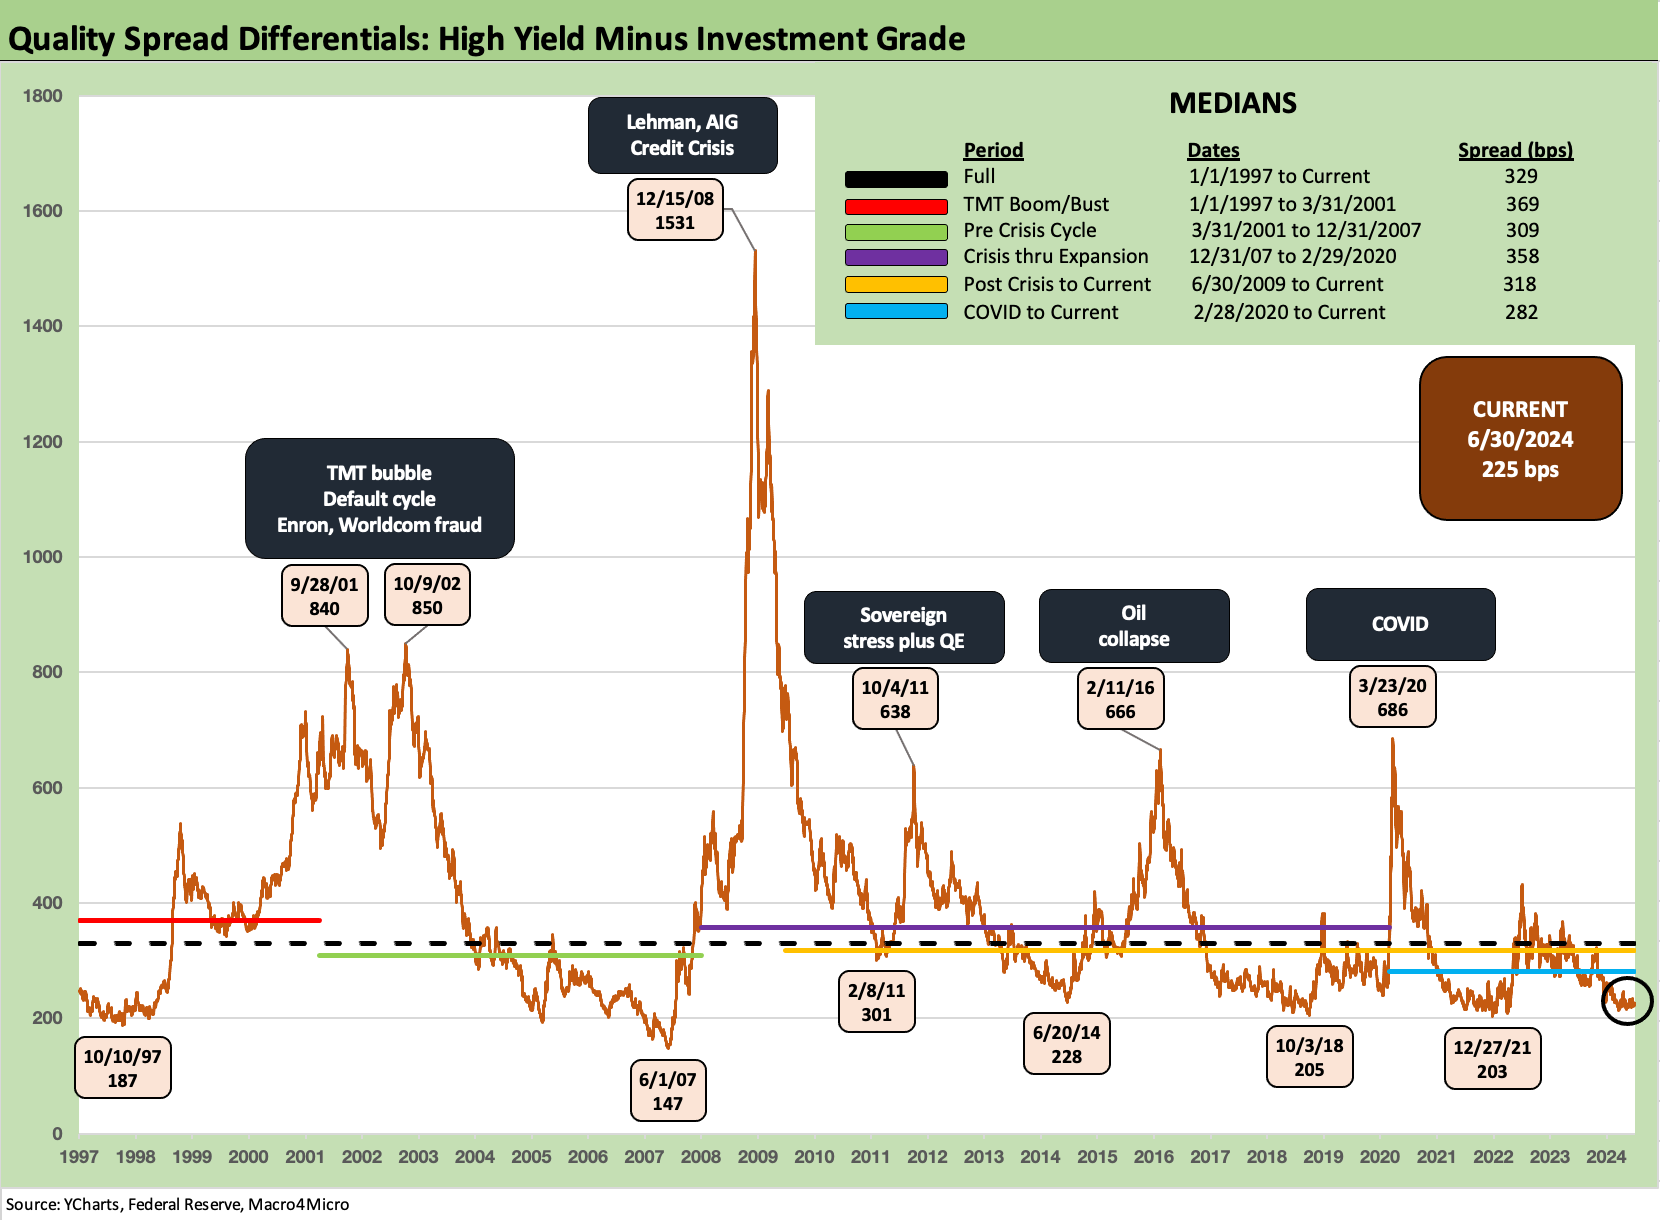
The above chart plots the HY minus IG spread differentials for a measure of the credit risk compensation for moving from the IG basket to the speculative grade basket. At midyear, that HY-IG differential was +225 bps and well inside the long-term medians. The chart breaks out the Hi-Lo dates and amounts. The +225 bps is wider to most post-crisis lows except the June 2014 spread compression period. We include Feb 2011 for a data point on the way into the systemic jitters of the summer and fall on the way to the OAS spike into early Oct 2011.
The above chart updates the BB tier OAS as that credit tier has become a much-traveled part of the credit tiers by the traditional BB buyers. There are ample diversified opportunities in the BB tier with higher coupons, more compelling spreads, and many healthy companies that are not available in the BBB tier and often present less volatility risk than marginal BBBs with a heavy weighting of long duration bonds and weaker covenants.
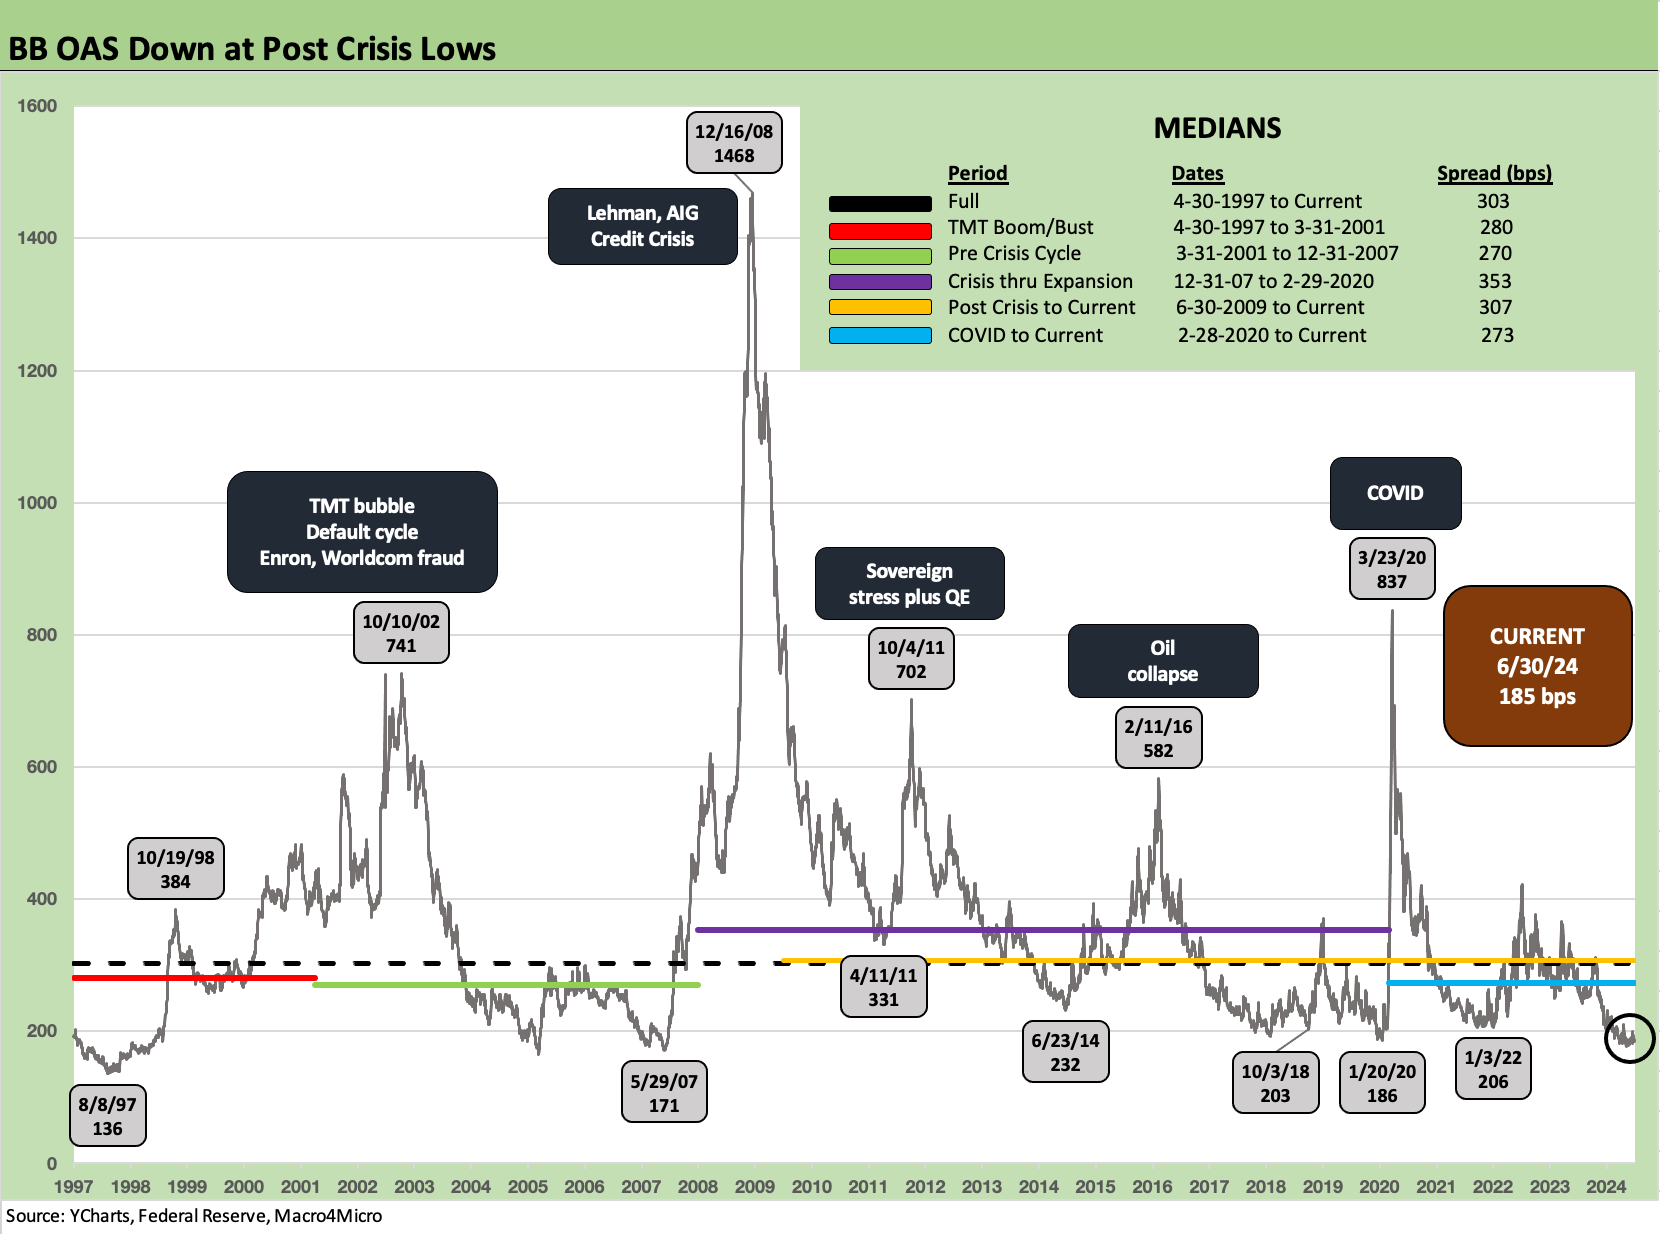
We see the recent BB OAS at +185 bps well inside the long-term median of +303 bps and sub-300 bps medians for levels since 1997 and up to 2007. The lows across the periods are noted, and the BB tier market now is in the low range and looks more like the par-plus BB tier index of early 2020 just ahead of COVID. The current BBB OAS is modestly wide to the May 2007 lows of +171 but more materially above the +136 lows of August 1997.
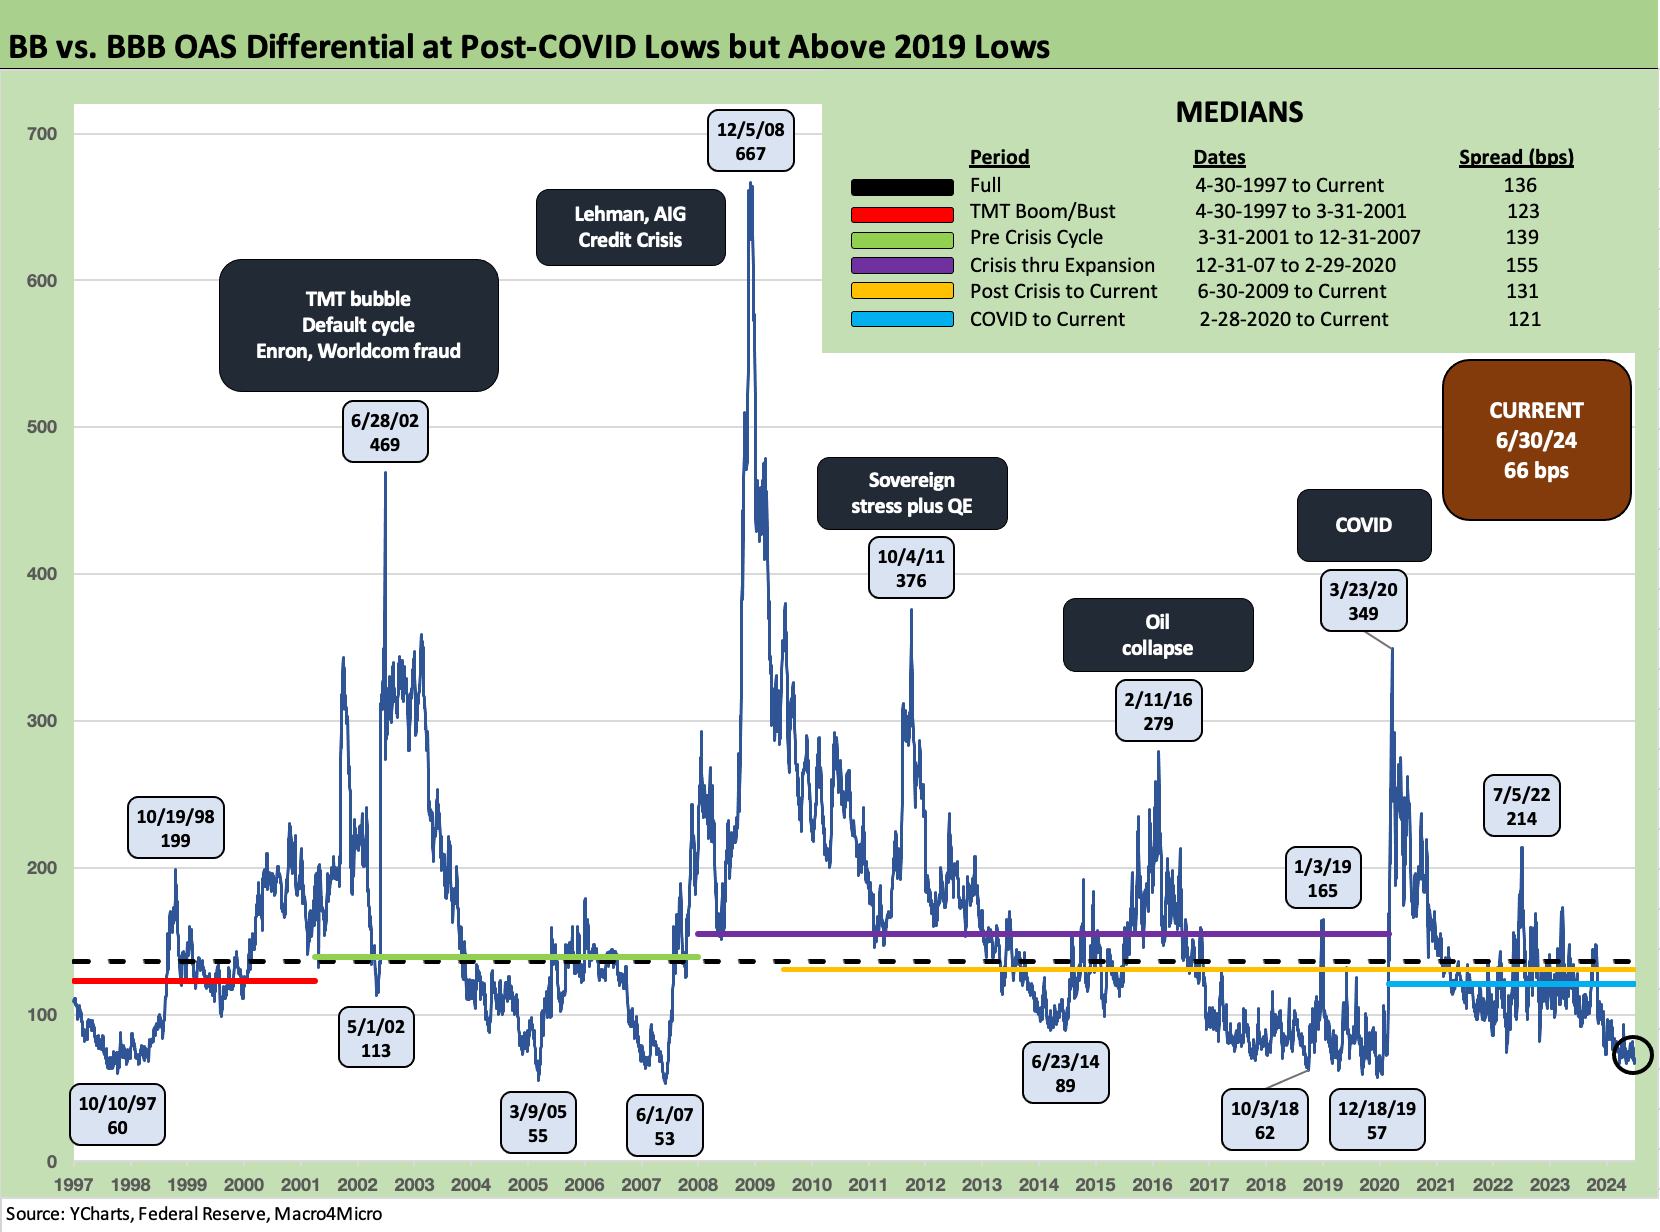
The above chart updates the BB OAS minus BBB OAS differential for a measure of the compensation along the speculative grade divide. At $4.1 trillion of BBB face value bonds vs. $689 bn of BB tier bonds, the BBB tier is one of the largest “nations” in the world and in a class by itself. The BB-BBB OAS differential of +66 bps is in the zone of past lows but not quite at the +57 bps of Dec 2019 when HY bonds were at par plus and BBs even more so after multiple Fed eases. The COVID crisis unfolded only weeks later. The current differential is inside the June 2014 lows but wide to the early Oct 2018 HY OAS trough period.
The above chart takes the same approach we used with the earlier IG Corporate index. We again use June 2007 and late 1997 for credit peak comps. The all-in yields for June 2007 and June 2024 are very close at this point, and June 2007 is not known as a period of rational credit pricing.
We review the HY spread lows in the next chart, but June 2007 saw +241 bps early in the month and ended the month at +298 bps. The current +321 bps is not far off. The end of 1997 was +296 bps after hitting a low of +244 bps in Oct 1997. It is safe to say current spreads are quite tight, but they have some room and have a BB heavy mix relative to those earlier periods.
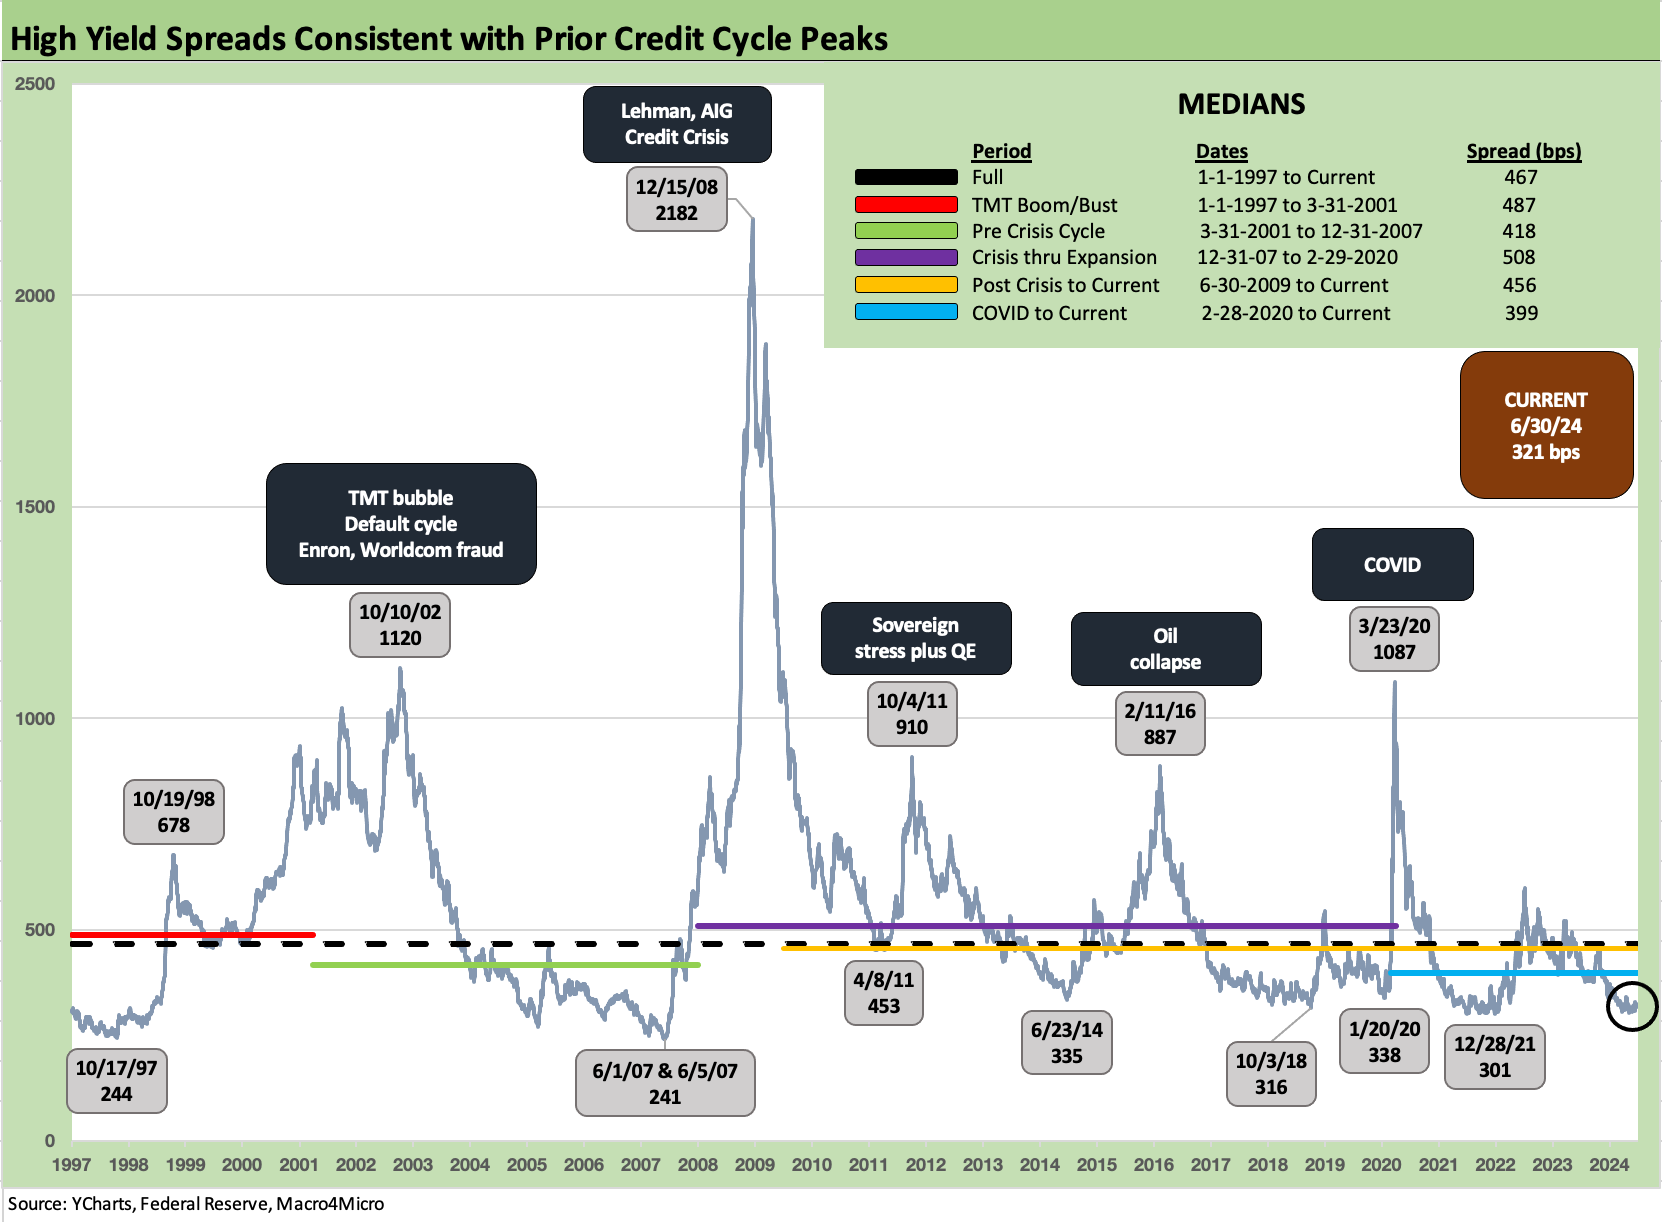
The above chart plots the long-term history from 1997 with the highs and lows noted along the journey. The current +321 bps is in the area of some of the periodic lows along the way even if well above the June 2007 and Oct 1997 lows. The recent lows are occurring outside the ZIRP periods and low rate normalization attempts of the post-2009 period through the tightening cycle commencement of March 2022.
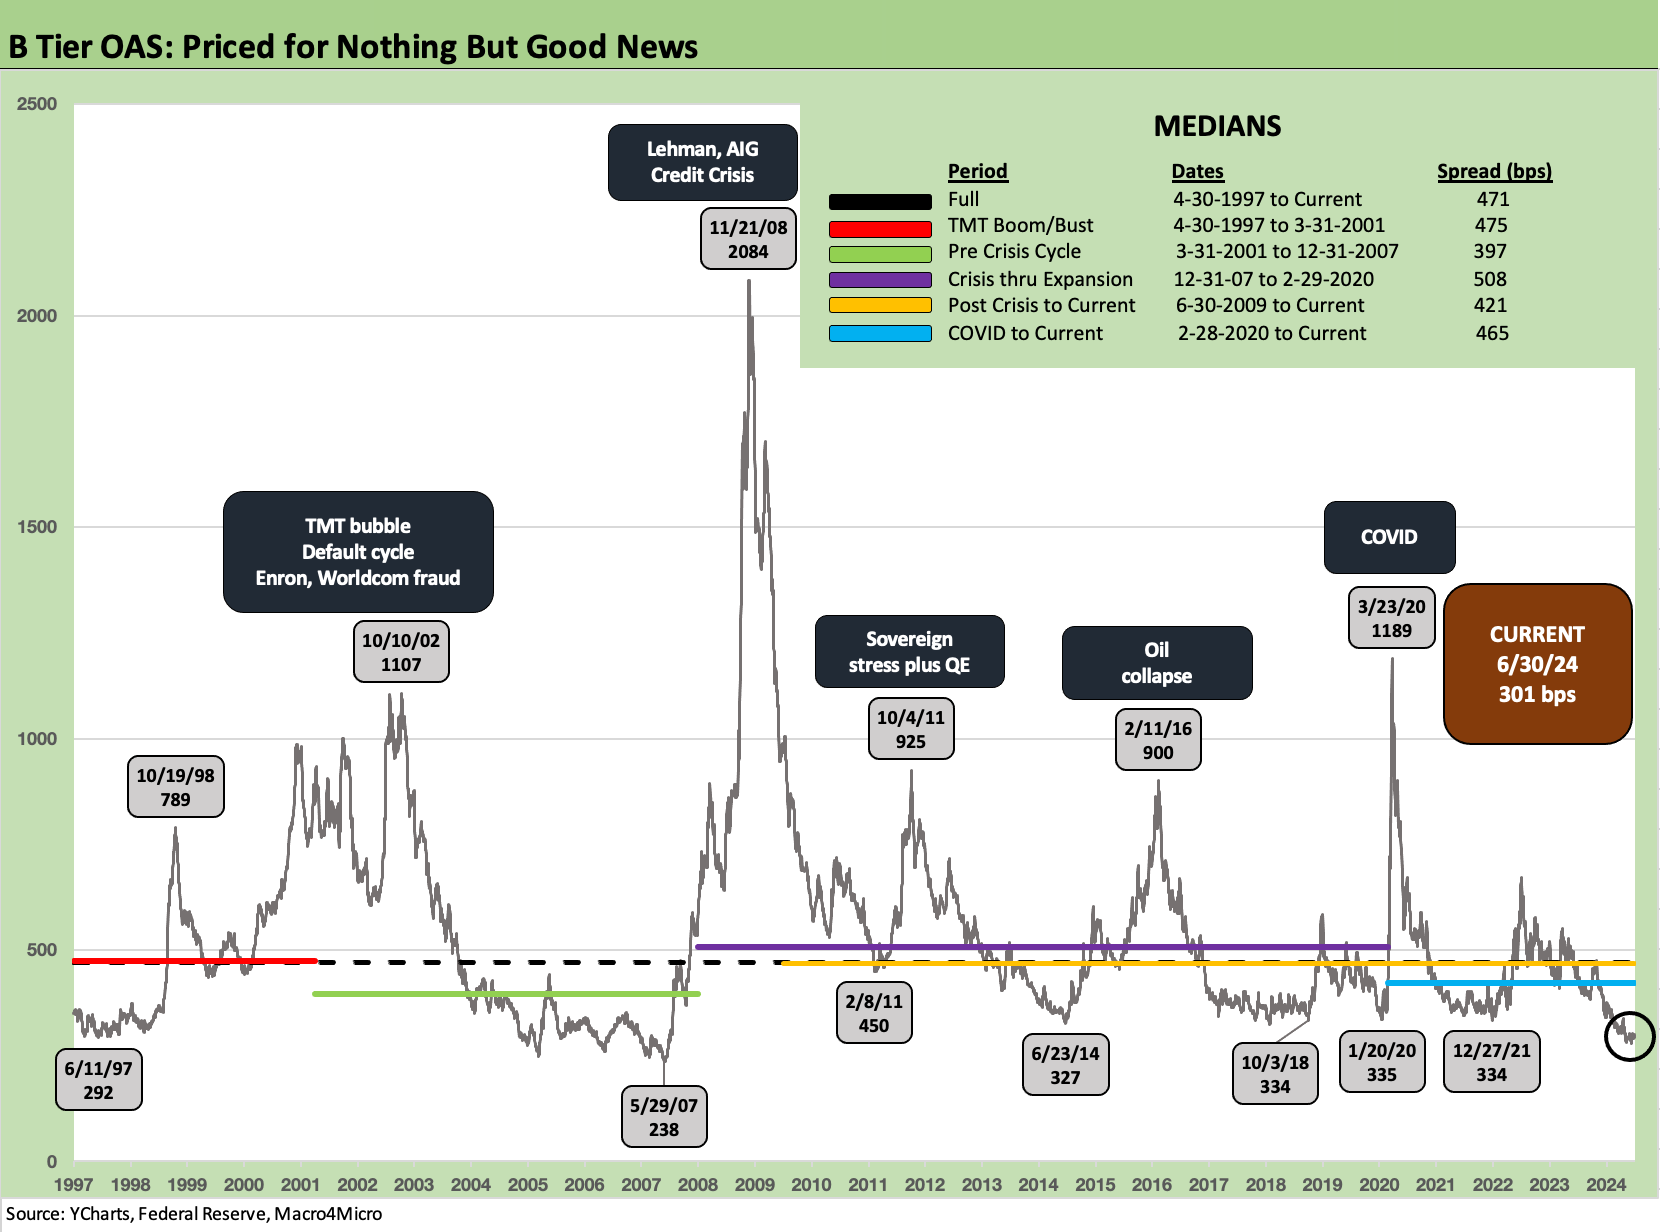
The above chart updates the long-term B tier OAS time series. This is the ancestral sweet spot of HY Classic investors (as opposed to HY Lite). The current +301 bps is below the post-crisis lows of June 2014, Oct 2018, Jan 2020, and Dec 2021. Current levels are well inside the long-term B tier OAS median of +471 bps.
The current spreads are in a zone rarely seen with the usual exceptions of June 2007 and 1997 although the B tier low in 1997 was “only” +292 bps. The June 2007 lows were swept up in the structured credit and leveraged loan boom for competitive pricing. Leveraged positions saw easy credit to take risk that year. The lowest median in the timeline above was that 2001-2007 median of +397 bps.
We are not including a CCC tier OAS reconciliation here given what happens when the default cycle starts to creep up and the CCC tier turns into a low dollar price case study in dollar price swings. That is when spreads decompress from the bottom up and the distressed debt players show up in force. We will look at some of those histories some other day.
For some glaring examples of the dollar price swings when the credit cycles turns sour, we saw low CCC dollar prices in the 42 dollar price area in Oct 2001, 31 handle prices in Dec 2008, and 58+ prices at the peak of the oil crisis in early Feb 2016. The current market shows the CCC tier at a 77 price and 14% yield currently. The Sept 2001 CCC yield as Greenspan was easing came in at just under 28%. The Dec 2008 yield was 41%. Feb 2016 was over 21%.
The current B vs. CCC dollar price composite differential is 18.6 points. That differential was over 43 points in Jan 2002 (defaults), 32 points in Feb 2009 (credit crisis period), almost 31 points in March 1999 (while the NASDAQ was soaring), and over 29 points in early March 2016 (in an economic expansion). The CCC tier runs the full gamut of risks and presents exponentially higher long term average default risks than the B tier.
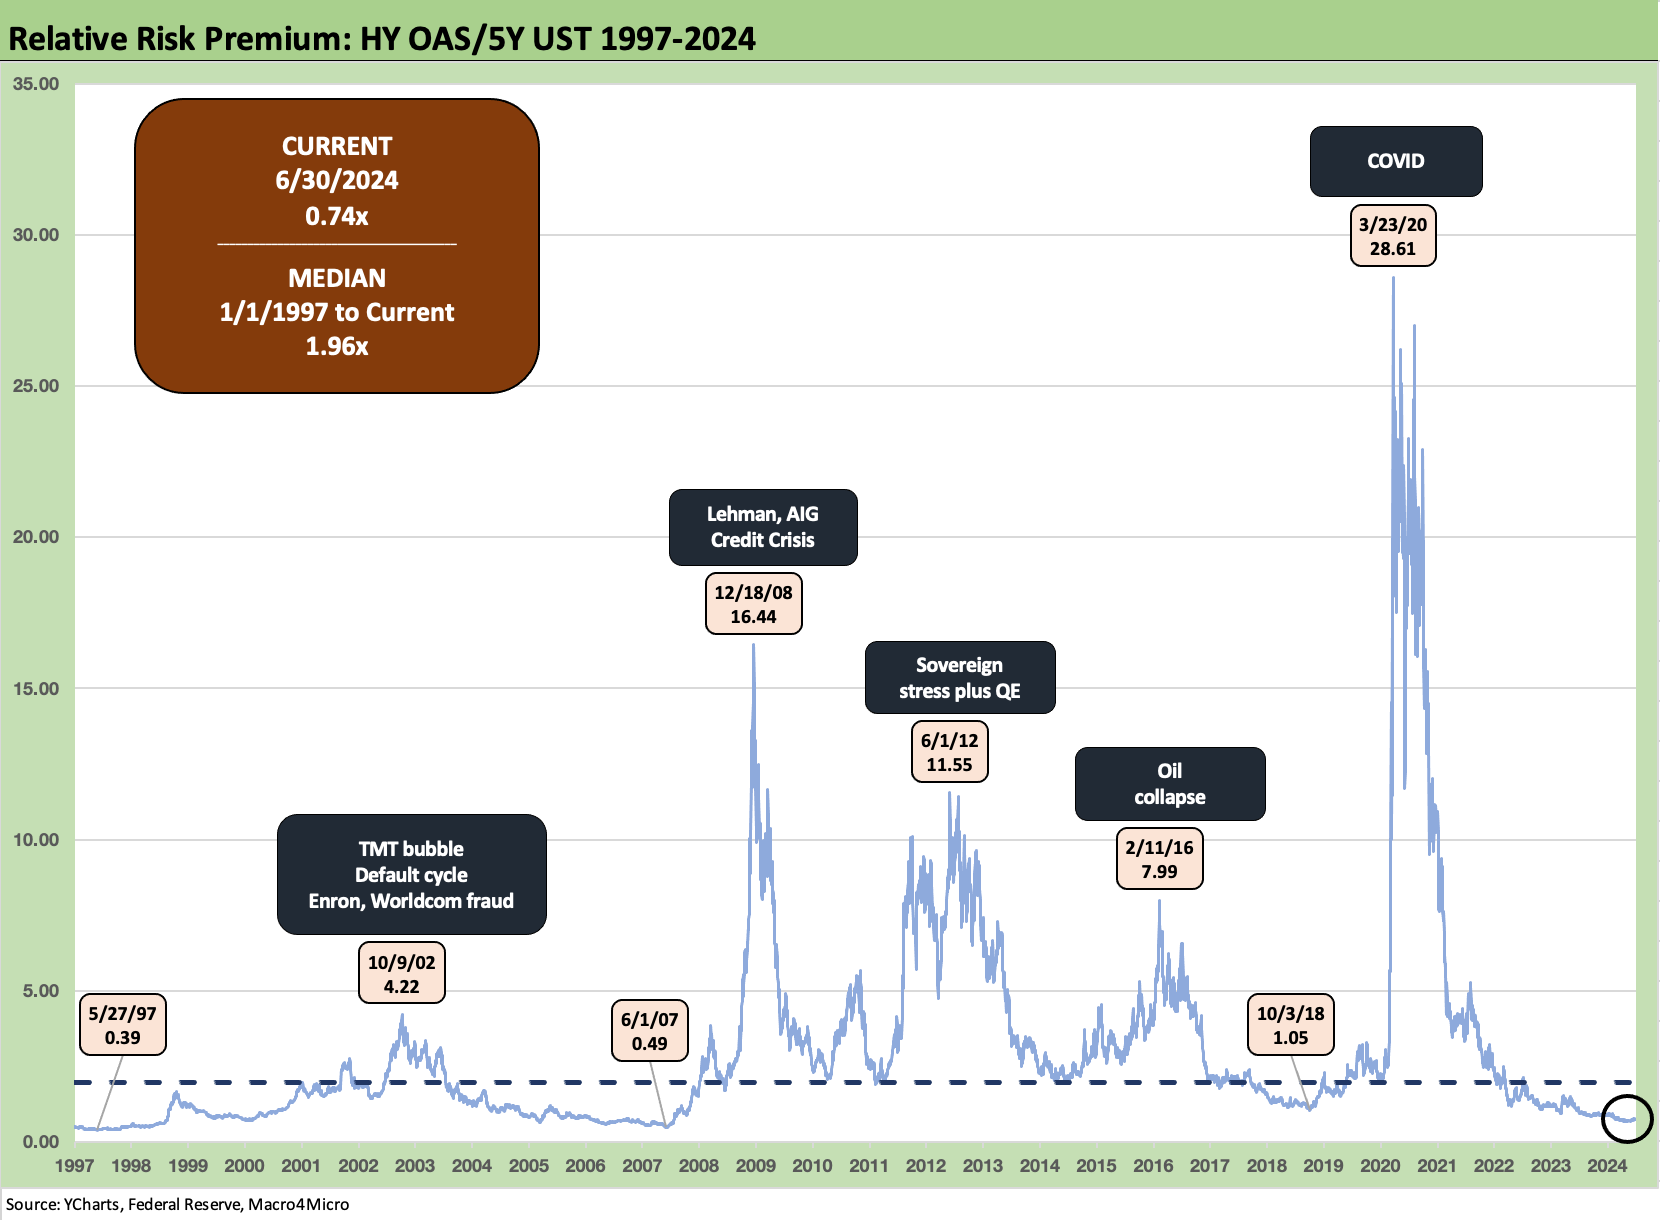
The above chart uses the proportionate premium approach cited earlier where we take the HY OAS and frame it against a duration relevant UST (in this case the 5Y UST). With HY OAS/5Y UST at 0.74x, the proportionate risk premium is well inside the long-term median of 1.96x. Even if above the lows of June 2007 and May 1997, we are near a post-crisis low.
Contributors:
Glenn Reynolds, CFA glenn@macro4micro.com
Kevin Chun, CFA kevin@macro4micro.com
See also:
Footnotes & Flashbacks: State of Yields 6-30-24
Footnotes & Flashbacks: Asset Returns 6-30-24
State Unemployment: A Sum-of-the-Parts BS Detector 6-30-24
The Debate: The China Deficit and Who Pays the Tariff? 6-29-24
PCE, Income and Outlays: Practicing Safe Growth? 6-28-24
Durable Goods: Playing Defense 6-27-24
1Q24 GDP: Final Cut, Moving Parts 6-27-24
New Home Sales: Pumping the Brakes 6-26-24
Footnotes and Flashbacks: Credit Markets 6-23-24
Footnotes & Flashbacks: Asset Returns 6-23-24
Footnotes & Flashbacks: State of Yields 6-23-24
Existing Home Sales May 2024: Weary Climb 6-21-24
Consumer Sentiment: Summer Blues or Election Vibecession 6-14-24