
Trade Flows: More Clarity Needed to Handicap Major Trade Risks
We update key trade flow statistics ahead of what needs to be more trade policy clarity from candidates and transparency on the economic threats.


We have a deal Xi… Tell them the US had a trade surplus with China by 2020, you paid me billions in tariffs, I won the election, and I weigh 215 pounds.
Then I’ll owe you one!
With a fresh round of Section 301 tariffs on unfair trade practices from the Biden team on China, there is still a lot of trade event risk lurking for 2025.
We update critical trade data and frame some questions to ponder around trade risk on the horizon and especially some crucial issues with China and Mexico.
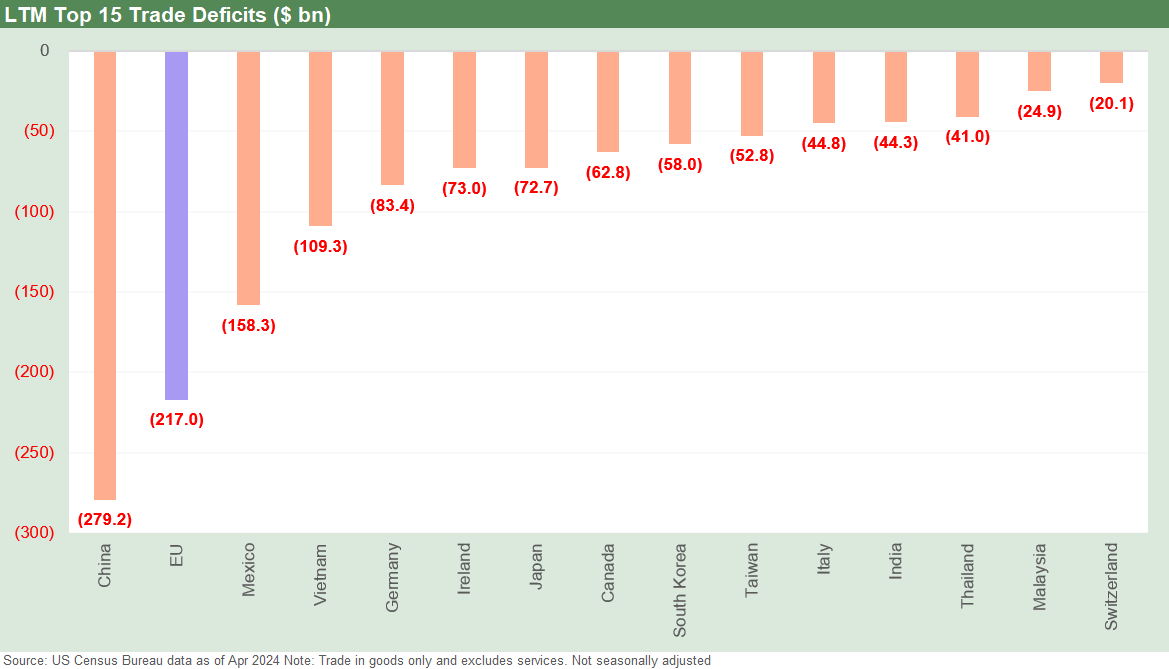
The EU is by far the top LTM trade partner, #1 in imports, and #1 in exports, but China and Mexico have the most exposure to radical shifts in trade policies that have not been clear or coherent to this point.
The LTM Goods trade deficit with China is materially below the record peak of 2018 while the Mexico deficit is at a record high and EU near a record high, setting the stage for a blustery election season on trade and holding candidates to account on the difference between facts (who pays the tariffs) and pure fiction (“I collected tens of billions from China”).
The evolution of supplier chains is ongoing, and low-cost sourcing remains a priority for US companies. That means demand from a healthy US economy can bias the trade deficit higher just on the reality of what higher consumption means in the US.
The month of May brought a slew of proposed new Section 301 tariffs (unfair trade) on China from the Biden team, and the hope is that trade policy starts getting more airtime given how much disinformation (aka lies) have been promulgated over time on the topic as tariffs became a headline item back in 2018-2019.
We spent a lot of time on trade in prior lives and most recently in the early Trump years as NAFTA was getting reworked and tariff battles and retaliation was breaking out with China and the EU. Korean and Japanese trade deals were updated or more terms initiated in 2018-2019 and Trump got to air his repetitive grievances on autos and to make a marketing push on US Energy and Aerospace.
The main events were with NAFTA and China and some sideshows with the EU during the Trump term. Those who watch the “trade news” out of Washington agencies know the array of issues and legalistic twists and turns on trade can be technocratically mind-boggling. The main generalization (and fair ones) has been that Biden has continued the protectionist Trump trade approach but with less end-zone-dance excess and fewer gross misstatements.
Our favorite misstatement on tariffs remains the G-7 statement by Trump that he has collected “tens of billions” from China that offsets any damage. He claimed “the tariffs have cost nothing, in my opinion. ...And we’re not paying for the tariffs; China is paying for the tariffs, for the one-hundredth time.” He claimed no one ever got China to pay “ten cents” before him. That last part is true for all the wrong reasons since the “buyer pays.” That is why no one has ever done it before.
Questions to ponder…
Will Biden embrace the protectionist label with the “save jobs” theme (jobs numbers are at least on his side unlike inflation) and seek to highlight his basic understanding of how tariffs work to draw a clear distinction from the on-the-record statements made by Trump? Will he look to share some inflation blame with Trump on tariffs that are paid for by customers?
Does Biden have a view on what the economic effects of tariffs that can have on some industries and has he learned what Trump failed to ever admit (buyer pays tariffs, not the exporting country)? Does he have a theme for the unfolding Section 301 tariff reviews?
Will Biden highlight that the recent major increases in China 301 tariffs are driven by the technology transfer requirements in China and shine light on a topic that has been hot in the age of semiconductor spending and incentives (CHIPS Act?)
Can Biden smoke out Trump on his false statements around collecting billions from China in a debate and demonstrate his grasp of economics and draw a contract with Trump’s statements? After all, Biden gets lower scores on the economy than Trump, and this is an opportunity for him.
Has Trump figured out the difference between a trade deficit tied to unfair trade and how trade deficits can reflect US economic strength in demand and favorable economy?
Has 4 years of Trump and a 4th year of Biden evolved the trade and tariff conversation, or will that topic get mired in strident, simplistic, concept-free, fact-lite rhetoric? (China bad, we good…)
If tariffs and energy make a difference in trade deficits, why has the average trade deficits moved higher for every Presidential 4-year administration timeline since Obama I?
As we look at trade deficits charts further below, why did the average total US goods trade deficit plunge from Bush II to Obama I?
Why did the trade deficits soar from Bush I to Bush II?
Why did Clinton post such a good track record in economic growth trends with a doubling of the trade deficit?
Why were Trumps trade deficits higher than Obama? Why are Biden’s higher than Trump? Maybe there is a pattern here?!
Will Trump play the oil price wildcard on Biden in a debate to win the point on inflation? After all, higher crude production means lower gasoline prices which means lower inflation from energy costs and that in turn cuts across inputs costs for goods and services.
Will Trump use his desire for a pipeline and energy infrastructure regulatory blank check to also improve US global trade deficits that would come with higher crude oil and LNG export volumes.
Will Biden be ready to counter Trump on energy trade and the “energy independence” theme with the facts of record US oil production, record natural gas production, record volume exports of hydrocarbons of all types? Will Biden be handcuffed on the topic in the debate by the anti-carbon crowd in his camp?
However the topic of tariffs and trade policy gets spun (typically an eye glazing topic, and especially for the 49% of America that think the S&P 500 is lower this year), will the simple realities of total economic activity across borders get tied into the reality of higher economic activity within borders?
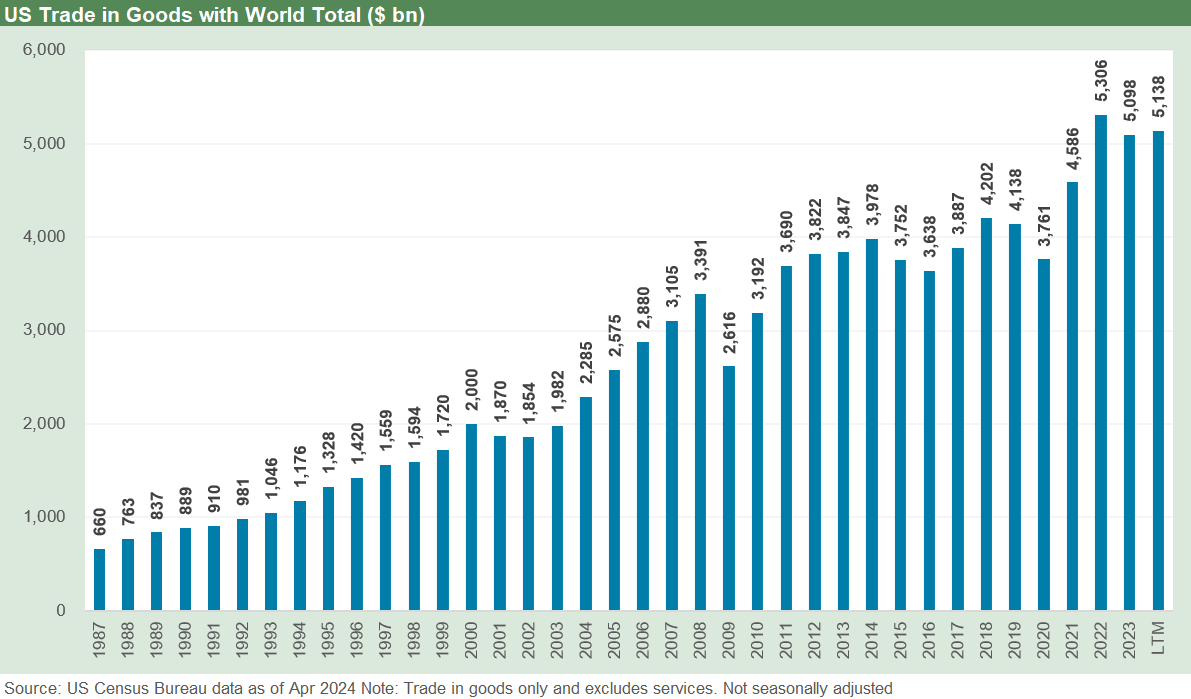
As detailed at the top, total trade is down from the 2021 peak in the last year of ZIRP and the post-COVID rebound in demand, but all 3 years under Biden show total trade higher than each year under Trump. Is that a basic fact of life in a growing economy? (Hint: yes). Are higher trade deficits also a sign of economic strength and sustained US GDP growth and especially solid consumer demand (Hint: Yes).

The above chart gives an easier multidecade view of the “up and to the right” patterns over the cycles of both imports and exports of goods. What government policy and tariffs are in part trying to do is get exports higher and domestic production of some imports higher, but the main goal is to shift the mix of what happens within the borders in GDP, jobs, household income, etc.
Reliance on external supplies in many goods is also what can drive inflation when the supply gets undermined by events (COVID) or by tariffs or even embargoes (the most draconian and rare trade action). As we think back to the early 1970s and the Arab oil embargo, the Taiwan issues can trigger thoughts of what a “Chip Embargo” might look like.
Thank God for American innovation in E&P that eliminates the threat that played out in 1973-1974. That of course triggers a debate on climate, but oil prices and natural gas prices have global and regional dynamics of their own. There was a time in the late 1970s when most were convinced the US would run out of natural gas. Cue the pipeline take-or-pay crisis of the late 1980s/early 1990s when natural gas prices plunged and supply soared. Convictions are often wrong when it comes to commodities.
Getting into the latest trade details…
We had looked at the trade flows and tariff topics back at the start of the year when full year numbers rolled in (see Trade Flows 2023: Trade Partners, Imports/Exports, and Deficits in a Troubled World 2-10-24). The tension only gets higher ahead as EV differences get aired (Trump hates EVs) but also as the potential for the US essentially banning China auto investment in Mexico to the point of even tossing out the new free trade agreement if certain lines are crossed.
The USMCA (formerly known as NAFTA) is up for its six-year review for completion in 2026 (that will set a timeline for continuation or a long slow wind-down) but the opportunity for clashes on some key issues could change the rules of the game very quickly before then. Getting Biden and Trump on record on important issues will be hard unless the right questions get asked and the candidates state some facts that are actually correct or get called out on those that are not.
The Mexico part of the trade story gets less headlines than bilateral trade battles with China, but as we discuss herein, the border closure threat and mass deportation issues will seriously raise the temperature with Mexico as 2025 gets underway. Trump still will not utter the phrase “buyer pays” on tariffs, so Biden should not let him avoid the topic. Biden has the edge on Trump on this subject even as a fellow protectionist – unless Biden blows it and lets Trump off the hook.

The above chart plots the timeline for US goods trade deficits. The world was very different after NAFTA was legislated under Clinton in 1993 after being negotiated under GHW Bush by the end of 1992. We are not going back to those days in this note, but the reality of NAFTA, China trade and entry into the WTO, and the rise of the Eurozone all factor into the above trend line.
Trump’s 4 years showed record high average trade deficits and so has Biden. We can easily see that as a positive reflection on the US economy and demand. It is not a demerit unless the product level gaps are tied to cost or tech. Unfair trade practices have to be recognized and addressed where necessary, but demand is a sign of economic strength.
Many will be curious to see if the two candidates can debate that topic. It is not exactly the clash of the conceptual titans. Just don’t let the other guy lie. The effort should be to keep it simple and clear (like facts). The candidates just have to show they can articulate the very basic, entry-level econ topics and state facts. Is that possible? We think is it for Biden. Trump has the disadvantage of being on record with spectacularly false statements on how the tariffs work.
Goods trade deficits reflect a strong US economy…
In the earlier chart, you can simply take each rolling 4-year average trade deficit for each President from 2000 and see the average annual trade deficits move higher under Obama II to Trump to Biden. If Trump defined success as a lower trade deficit (as he did at the time), does that mean he failed? And that Biden failed? No.
To avoid burying the lede, the fact remains that when demand in the US grows with a strong economy, the trade deficits go up. If you oversee a good economy with strong demand, more gets purchased. If tariffs hike the costs to the buyer and demand is strong, prices go up. That is called inflation. Trump was part of it in a big way and so is Biden. The supply side constraints of the post-COVID disruptions made the supply-demand imbalance worse and pricing power even greater. It is not quantum physics.
The US is the largest consuming nation in the world with the most developed global sourcing capabilities. We even have entire industries built over the decades for that reason (“MROs” etc.). Those supply chains take years to build and years to unwind. To force the decision to unwind them can also be met with a “strategic stall” in the form of muted capex (note the Fed easing in 2019), a lack of expansion or a redeployment to other low cost countries that are not targeted by the tariffs. We see the stunning rise of US-Vietman trade as a good example as we cover in the charts below. Vietnam is now the 7th largest importing nation into the US with the 4th largest goods trade deficit.
The average trade deficits rose under Trump from Obama despite all the tariffs and aggressive action by Trump whether under Section 232 (national security) Section 301 (unfair trade), Section 201 (industry injury on a rapid rise in imports) or anti-dumping duties. Tariffs are plain and simply the equivalent of a tax on US buyers.
The use of Section 232 was roundly rejected as insulting and absurd (Canada as part of the NORAD command structure threatening national security on aluminum, the same for NATO allies on aluminum and steel, etc.). The Trump tariffs were steadfastly opposed by respected Republicans such as Toomey and Corker. That did not go well for them over time. Other GOP luminaries opposed them also. Most are gone. Others saw the trends and checked their spines at the door and forgot what they knew. With D-Day ceremonies just passed, the history does not seem to make Europe a threat to US Democracy (well, Hungary might be).
The Biden team has been rolling in “tariff-rate quotas” (TRQs) on many of the Section 232 tariffs. The way we read TRQs is that they have the same economic effects as a tariff but are less insulting to allies and have the effect of being face saving and allowing negotiations to continue. It is form over substance.
Trade might not be a priority for debates with so much low-level toxicity dominating…
There will be more opportunities to get further into the bilateral flow detail on the Goods line items for imports and exports after midyear data comes out, but a key question will be whether the average voter gives a damn outside of the high-level message (pro-America jobs, China as a low labor cost hot button and “national security” fear, Mexico as a US job killer, etc.). We are unlikely to hear that much in the debates apart from the fact that Biden and Trump are both protectionist and not inclined to admit some simple economic realities. That would be an opportunity lost.
For Biden: He has an inflation problem in the election ahead and tariffs are intrinsically inflationary. It will be interesting to see if he admits those forces of inflation with the “buyer pays” reality and how he has simply continued the Trump policies. That makes it hard to differentiate unless he states that the US collected zero from China to paint Trump in a corner in his recurring false statements on that topic. That is like saying “I am protecting American workers, but Trump is simply ignorant on the topic and lying – again.” Biden could get some mileage there since he then is saying that he is unapologetically going to protect the American worker. Period. He can demonstrate he understands the concept and knows the facts. That would indeed be differentiating from Trump on trade.
Trump: The stakes around Trump in trade are not as “front burner” as in 2017 as he was determined to hammer NAFTA, change it, and rename it. He fought with his cabinet on tariffs, and he wanted to assign them at will. We have covered that in past commentaries on the Section 232 and 301 scattershot tariffs and recurring WTO violations that came with them. In the end, the WTO has been emasculated by the US and it could very well cease to exist with the US not even involved depending on how events play out. For the debates and the political season, someone should get Trump to say the words “buyer pays.” Biden is every bit as protectionist as Bernie Sanders and Trump, but he can “call BS” on the trade topic as explained by Trump about collecting billions from China. He could score a point on Biden mental capacity vs. Trump.
The trade topic might just get some minor airtime where both protectionists want to highlight their “America First” credentials. The fact that the term “America First” was more closely associated in history with Nazi sympathizers in the 1930s US does not seem to get as much airtime as it should. Some commentators mention it and it shows up in think tank retrospectives, but it is code for fascist sympathizers.
The America First movement in modern history was more about the US “letting Europe burn” during WWII on the “not my job” theory (often propagated by friends of Nazi Germany). The fact that Japan bombed Pearl Harbor and Hitler declared war on the US (giving serious angst to many of Hitler’s military leaders) ended that debate. At least HBO was able to get a mini-series out of Charles Lindbergh (“The Plot Against America” based on a book). That was not the way Jimmy Stewart did the movie (The Spirit of St Louis). History creeps up on high profile people with fascist sympathies. It is more prudent to see it in advance and not in retrospect…
For purposes on this discussion, let’s assume America First means pro-tariff on the basis that high tariffs in theory promote US growth and jobs and investment in supplier chains (debatable on its best day). We would argue that the performance of the US economy and markets in the combined period of 2018-2019 might push back on that positive economic spin with fixed investment weak, but then COVID derailed the debate in early 2020 before the assumptions could play out.
The year 2018 was the worst for the top performing tier of debt and equity asset classes since bond indexes were founded while 2019 saw the FOMC ride to the rescue with 3 cuts (see Histories: Asset Return Journey from 2016 to 2023 1-21-24). Many blamed tariffs and trade (or at least see it as a major contributor to investment weakness).
The trade deficit can reflect the good or the bad…concepts count.

The above chart is based on an idea that we don’t agree with – that is, trade deficits are always bad. That conviction that “not all trade deficits are bad” is nothing to brag about, since it is usually a requirement to pass a basic intro econ test.
The above chart offers a trend line to look at the topic for at least some context. We can look at trade deficits as the “bad stuff” and frame it against exports as the “good stuff.” Trade deficits became highly politicized in the election of 2016 and ensuing chaos (like masks, vaccines, voting machines, windmills and other items). We used this ratio as a frame of reference to give better context to the numbers posted by Mexico or Canada during the “new NAFTA” battle.
The time series shows the “bad stuff” ratio is much higher now than in the early to mid-1990s. The ratio is now in a tighter range since the credit crisis years after peaking in the post-TMT/pre-crisis cycle from 2001 to 2007. The arrival of China on the scene in a big way mattered (China entered WTO 2001) and the sustained buildout of manufacturing capabilities in Mexico (notably for Autos) was an important factor as well.
Oil prices rising after Iraq made a difference in trade flows with the US then still a major importer of oil. Oil exports were not even allowed at that time (Obama allowed exports later). Iraq escalated in spring 2003, and we see Canada’s trade deficit jump over the next few years. The eurozone was launched at the start of 1999, and the EU trade deficits rose quickly in that time frame (peaking in 2005). We look at the patterns of trade deficits and trade for the EU, China, Mexico, and Canada in sections below.
Who do we pick a fight with?
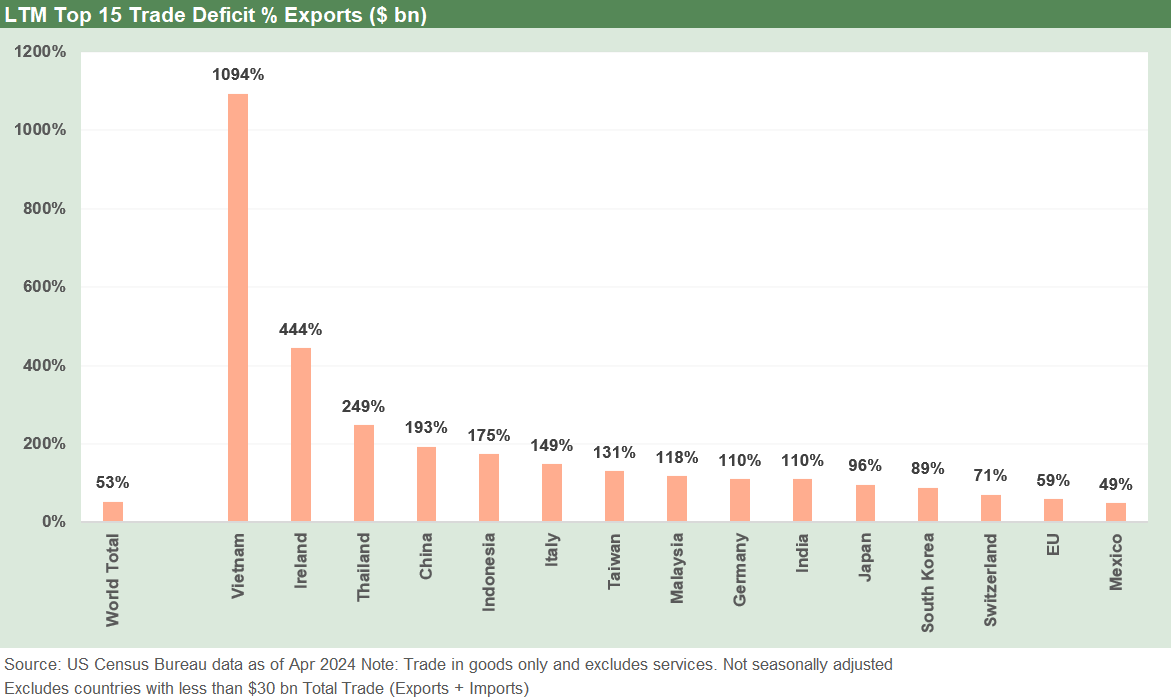
The above chart breaks out the same ratio with a “Top 15” using the top trading partners with more than $30 bn in total goods trade (exports + imports). China, the EU, and Mexico make the list. As we detail below, Vietnam has soared on the list in a reminder that cutting China trade can just be a change of address for the importer (Vietnam, Indonesia) and not necessarily a domestic job generator in the US.
The chart above shows Asia with 4 of the Top 5, 7 of the Top 10, and 9 of Top 15. The EU and Mexico made the lower end of the list for major trade partners. Germany made the list on its own (vs. the EU) as an economic powerhouse of the Eurozone and a nation with many downstream operations in the US that take imported components from Germany into US transplant operations. Italy simply does not buy much from the US while Germany is a Top 5 export market for the US (LTM).
Canada does not make the list. Canada is an excellent source of demand for US exports from commodities to high value-added goods. Canada is a great source of low-cost aluminum and other trade attributes that should be viewed in a positive light. That is a separate story for its own commentary.
The US had traditionally maintained a Goods trade surplus with Canada ex-oil, which holds one of the largest stores of oil and total hydrocarbon reserves in the world. The US combined with Canada could be a powerhouse oil exporter (driving oil prices lower) and a positive national security factor on top of that. I offer that as someone who was idling in the gas station line during in the odd-even license plate days after the 1973 Yom Kippur War and also saw gasoline prices spike during the 1979 Iranian oil crisis.
US trade deficit with the world driven by the Big 4…
The annual Goods trade deficits chart shown earlier in the commentary is worth thinking about. The sequential upward trend from each presidential term since the early 1990s (with the exception of Obama I) speaks to strong US economic growth in the 1990s and before a strong bounce off the 2001 recession (China also joined the WTO in 2001). The 2001 downturn was the most muted economic downturn in postwar history. The US-championed WTO policies and the US-engineered NAFTA were major forces in the restructuring of supplier chains as these cycles passed by.
The scramble to be cost competitive was on across the 1990s and into the 2000s as manufacturing saw massive structural changes in the US. The Toyota Production System (later known as “lean manufacturing”) was embraced by US OEMs (see The Machine That Changed the World). The efficient supply chains take years to build and years (and cycles) to unwind. The problem is that those companies affected can wait out election cycles and theoretically be cautious on the risk of inconsistent policies. The inconsistency only gets worse as the years go by (just look at EVs right now). With two protectionist candidates for President, the supplier chains may be forced to adapt as the tariff wars get worse not better.
Post-crisis changes in supplier chains…
The credit crisis years after 2008 were strategically important. First, it was during a brutal downturn in the aftermath of the systemic bank crisis and housing sector collapse. That period was the longest recession since the Great Depression (see Business Cycles: The Recession Dating Game 10-10-22). That recession “officially” started (per NBER) in Dec 2007 but the real pain started in late 2008 with a massive collapse in economic activity and inventory destocking and credit contraction. The trade deficit accordingly plunged with demand. That is another data point to revisit the idea that all declines in trade deficits are good. In the case of the US, it means a weak US economy.
The relationship between a swoon in demand in the US and the sharp contraction of the trade deficits should be obvious. We buy less in the US and that means less being bought from offshore. We are not looking to get into the multicycle history of reshaping global supplier chains across industries, but the reality is that the trade deficits worsens when the economy was doing well. From the early 1990s into the new millennium, the rise of global trade, NAFTA, China, the eurozone, and more added complexities to simple rules that did not work effectively for rules of thumb.
An anti-trade deficits policy caused by a strong economy was what made the Trump PR campiagn on tariffs so conceptually bereft (aka. embarrassing) in 2018-2019. If you are going to want to brag about the best economy of all time, then you will be seeing higher trade deficits.
Restructuring the supplier chain again with the brutal recession…
With the stress on the real economy across 2008-2009, the scramble to get lean, reduce headcount and improve low-cost global sourcing was greater than ever. That meant low-cost supplier chains built out even more quickly from Mexico to China to Vietnam. The idea of Vietnam as a Top 10 US trading partner on the back of soaring imports is not without its historical ironies.
In a Trumpian process of brooming conceptual water up a hill, he was slapping tariffs on too many things, and it led to weakness in investment in 2018-2019. That prompted the Fed to step in to ease 3 times (Trump asked for negative rates). What happened to the trade deficit in 2019? It went down…in a weaker economy with higher tariffs.
Then in 2020 everything collapsed for a while and total trade (exports and imports) declined materially. Then stimulus and pent-up demand sent the consumer soaring later in the year. What happened to the trade deficits? They rose slightly in 2020 as the market rebounded in 2H20 and then soared in 2021 and 2022 on the consumer spending binge and return to ZIRP. The economy was booming and the trade deficit rising along with total trade, jobs, and GDP.
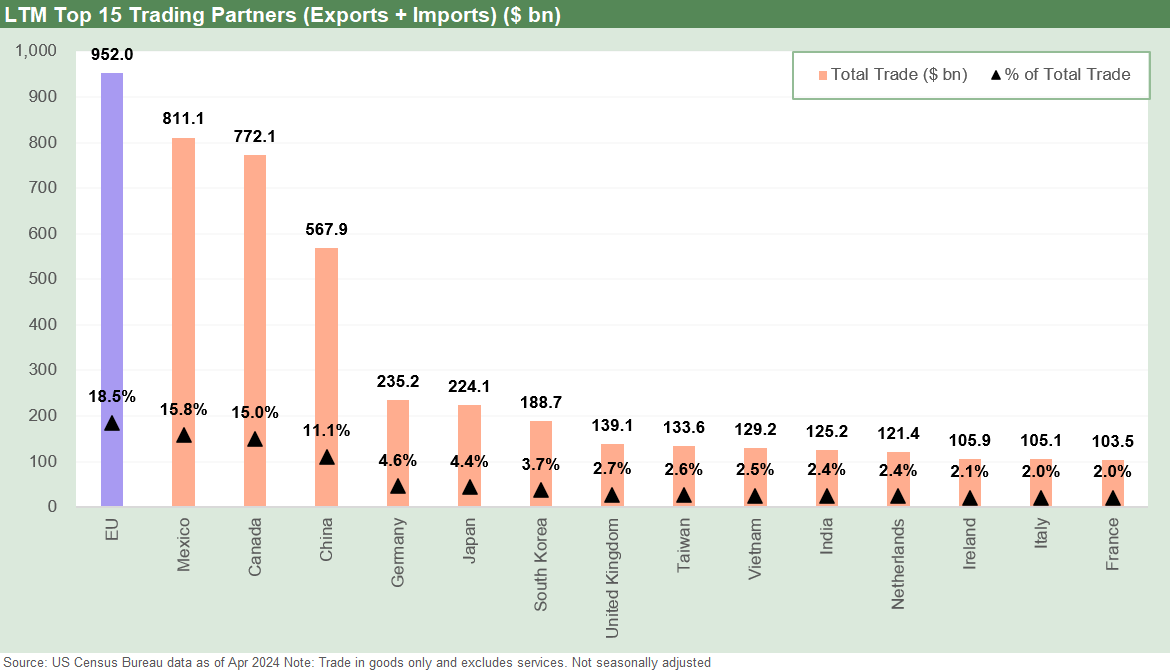
The top trade partner list is broken out above listing those by total of exports + imports. On a stand-alone basis by nation (ex-EU), Mexico is #1 with Mexico, Canada, and China comprising 41.9% of total trade LTM. If we drop in the EU, the total of the Big 4 is 60.4%.
We see Germany and Japan alongside one another as major investors in US economy. The German and Japanese auto transplant operations offer some of the highest visibility to the complexity of trade flows even before the growing infrastructure base of suppliers’ activity that such operations bring (whether owned by the US, Japan, or Germany). The rumors were that the Goldman crowd (notably Cohn and Mnuchin) were trying to keep Trump in check on economic reality in 2017-2018 in tariffs, but he wanted none of this and wanted more tariffs for his own goals. Gary Cohn told the truth that the tariffs were tax on US consumers. He did not last. He was too smart and had a backbone.
Since “trade” is just about imports and exports, it is also important to think about the multiplier effects withing the US borders that do not get captured in these metrics. The multiplier effects include US-based jobs, freight and logistics demands, financial services impacts (insurance, commercial and consumer banking such as auto loans, dealer finance, banking fees from lending, underwriting, securitization, etc.), and reverberating effects on the tax base and small businesses (the proverbial local diner etc.).
There are construction and real estate projects that also bring a slew of their own multiplier effects. Those include waves of EV and battery projects and joint ventures that brought Asia and European capital investment. Supplier chains tend to follow in part including in auto parts JVs. The incentives for more investment in the EV chain included US-sourcing requirements that we see flow into construction jobs (see Construction Spending: Stalling Sequentially at High Run Rates 6-4-24).

Top importers are detailed above with the EU on top followed by Mexico, China, and Canada. Mexico and China are the most contentious since Mexico is viewed as a “labor arb” hindering the “reshoring” of US jobs by being the “friendshoring” destination of choice. China gets called out for numerous reasons from low-cost labor arb to national security to tech transfer and ownership rules for US businesses in China among the gripes. That is where the validity of the Section 301 tariffs comes into play. Tech transfer requirements to many qualifies as an overriding unfair trade practice.
With Trump now talking about massive tariffs on all imports and multiple of those on China, the lack of a thought process and strategy or basic understanding of “who pays” is an economic threat and wildcard for inflation. Targeting “everything” beats thinking and is less demanding in conveying a complex message that the messenger might not grasp.

Top export markets for the US are not much of a surprise either at this point with the EU at #1, Canada #2, Mexico at #3, and China at a distant #4 for a total of 58.8% of US exports. When you consider how important agriculture is in the picture for exports and the same for aerospace, you start to think about the unintended consequences (or those simply ignored for political expediency).
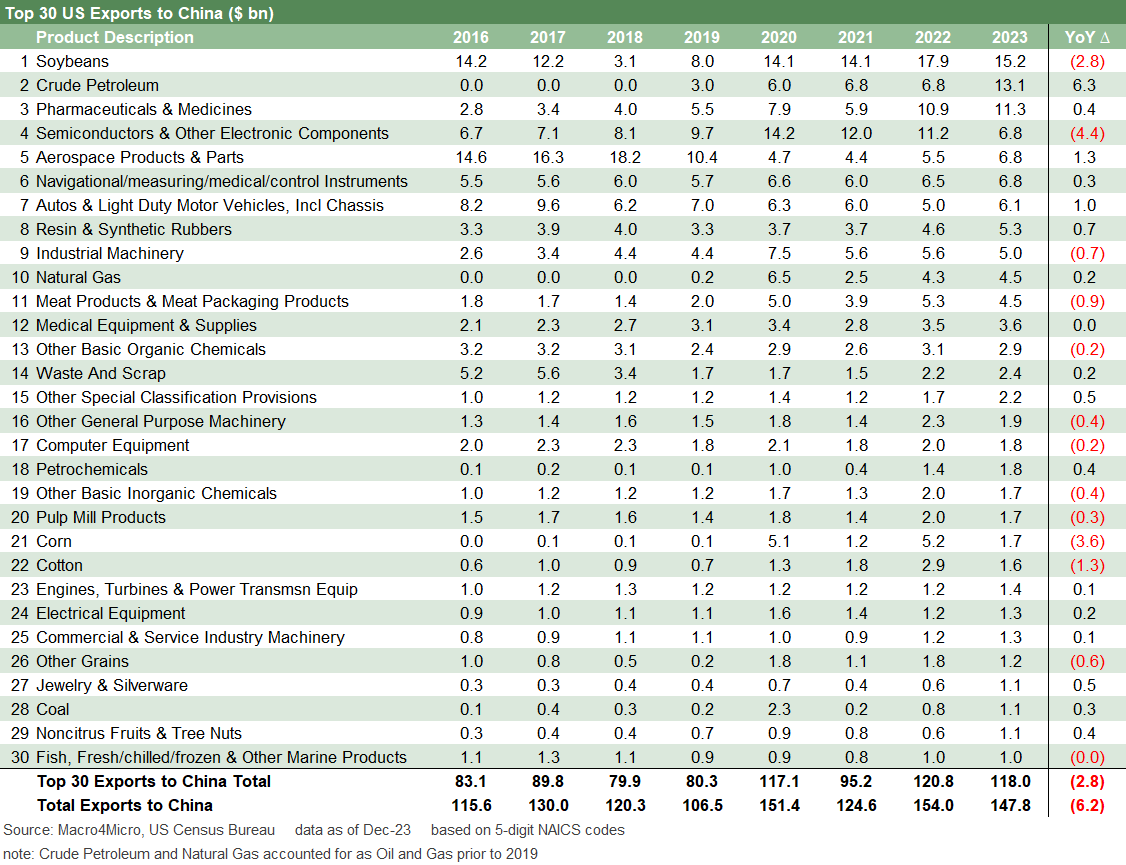
Aerospace was the #1 export from the US in FY 2023 with “petroleum refinery products” at #2, “crude petroleum” at #3, and natural gas” at #6. Among notable and identifiable categories (#5 is “special classification”), we see light vehicles at #7, semiconductors at #8, navigational/measuring/medical control instruments at #9, and organic chemicals at #10.
The “Biden crushed Trump’s energy independence” crowd on Team Trump might lead Biden to cite those export stats or the record oil and gas liquids production and record natural gas production levels. He also could see those critical export lines thrown at him based on his climate politics. These energy exports are very high in the rankings, so undermining them would be a natural attack line.
On that note, rising US production could pressure crude prices lower, reduce inflation, and take gasoline prices lower. The same would be true if the US allowed for more takeaway capacity and US infrastructure to import more of the heavy Canadian crude oil that Gulf refiners especially like to process for unit cost benefits. Higher hydrocarbon exports would also bring down the trade deficits for those keeping score there and arguably be a plus for global security with less exposure to Russia and Iran behavior.
The metaphorical nuclear option…
A trade war with China at this time could leave Boeing dangerously exposed to retaliation. China is the dominant buyer of large commercial aircraft for the industry – both Boeing and Airbus. Most would agree that Boeing has enough problems in its hangar right now. A severe China retaliation on the current order book would set the hangar on fire.
China also could target critical materials and components with so much of the supplier chain from tech to medicine a core part of trade. It would take “a lot” to pull China out of its long game. History tells us that Taiwan goes under the heading of “a lot.” We would assume unbridled targeting of all imports might be enough to trigger a mix of targeted tariffs or embargoes. The latter is the big threat for supplier chains and more inflation side effects. Such a threat is not a zero-probability risk given the rhetoric. To push China into that position would not be game theory. It would be knocking the chess board on the floor and kicking the pieces.
The deficit trap…it’s about the “Why?” more than the “How much?”
The intro economic version of trade sourcing is about “comparative advantage.” The complaints of US labor are that the typical $4 per hour wages and minimum benefits in Mexico is subsistence labor wages even if you double them. The sourcing practices of major US buyers is thus about low costs and price-appropriate quality.
That is the “race to the bottom” theme that gets cited all the time. That is where tariffs come in on China or other low-cost countries. Then the question is “Where does that China tariff send the buyer? Is that Plan B Vietnam or is the longer term Plan C simply wait for it to get made in Mexico with its minimal assembly line costs?

The above chart tells a China trade story that is now well known with the peak trade deficit reached in 2018 before a series of tariffs and “deals” sent China deficits down to level that are much lower (the 2023 and FY LTM are the lowest since 2010).
China still ranks as the highest goods trade deficit of any trade partner (including the entire EU). China is the #4 trade partner including the EU and the #3 nation ex-the EU. China is at #2 as a nation in imports behind Mexico (excluding the EU bloc) and a very distant #3 in exports as a nation (again, excluding the EU as a bloc).
In a tariff clash, we have already seen what China does with agriculture retaliation. That led to taxpayer funded bailouts larger than the auto bailout. That was very predictable. The problem then (and now) is that retaliation is assured. In the case of the “ag” sector, the targeting of ag is routine at this point. As detailed in the chart below, the #1 export to China is soybeans, and there are alternative sources for China. A range of other “food chain” products also add up.
In the case of Boeing, China needs and wants the planes, but if matters get serious, retaliation could set off myriad problems for China and the US alike. The Boeing supplier chain is massive, and any threat to Boeing deliveries and production issues would roil the domestic production chain that spans the country from the Northwest (Washington) to the Heartland (Kansas) to the Southeast (South Carolina) to name a few.
The rumored “secret weapon” for China is medical and pharma ingredients where the dependence has grown. That can spill into the # 1 US export to the world, which is pharmaceuticals. The pharma supplier chain would have knock-on effects. On the top import list from China, we see pharma and Medicine is in the Top 20 imports with medical equipment and supplies. Those two added together had a total dollar value of almost $15 bn, or almost the same as the #1 US export line from the US to China (soybeans).
The more extreme side of a trade clash is when a trading partner not only slaps tariffs on your products but also refuses to supply a good (embargo). That is when it gets very ugly.
With such a large trade deficit, the targets are more limited but very important. The farm belt has enormous political clout, and they would expect immediate bailouts if trade clashes with China falls on them in the relation to tariffs on China.
Meanwhile, the tenuous state of Boeing does not need much elaboration as their balance sheet keeps seeing its debt needs grow to fill gaping cash flow hole (see Boeing: Different Scales, Different Magnitude 1-10-24).
In other words, China has fewer targets on the US side but absolutely critical (or powerful) products in agriculture and in Boeing. In terms of blanket tariffs on all imports as cited by Trump and broad-based higher tariffs in all China goods as he has tossed out from time to time, the chart below is reminder the sheer scale of the import range from high value added to commodity like low value products. Maybe in a debate he can explain how that would bring down inflation – unless he again claims that China will pay for it.
The same inflation challenge on tariffs and China will be there for Biden as well, but he is not on record saying China pays for it.

The EU: the #1 trade partner and outside a free trade deal…
The trade statistics with Europe can be broken down across EU, Eurozone, Europe or by nation, but we use the EU line for this purpose while also looking at the leading trade partners at the national level where appropriate in other sections.

The above chart frames the timeline for the EU goods trade deficit across time. As noted in other charts herein, the EU is #1 in total trade, #1 in imports, and #1 in exports. At a time when Trump seems to be itching for a fight with Europe, routinely undermining NATO, and being brazenly and bizarrely pro-Putin and anti-Ukraine, one would think the economic intertwining of the US and the EU would raise more alarms. That is especially the case of Trump wants to pull the plug on Ukraine and dissolve NATO as part of this revenge tour (revenge for Ukraine not helping him on Biden). He never has to explain when he only get softball questions or is on the rally circuit.
Trump is well liked in Hungary (dictator ties that bind), but the news flow around his leads in key states has been one of alarm from Europe. Trump clearly hears that message, and he has a history of taking slights and turning them into angry payback. That raises the stakes in the politics of pettiness when it comes to the US-EU trade gap and the historical single-metric fixation of Trump on such matters as demonstrated in his first term. The EU will not be buying a lot of US made cars anytime soon.
The two-way product flow between the US and EU includes many major multinationals from the US and EU. The product checklists are for another day, but the EU imports show Pharmaceuticals and Medicines as by far the #1 product group on the import list for 2023 with Autos a distant #2, and Aerospace at #3 (product chart not shown).
Major European companies have large-scale operations in the US in autos and commercial vehicles and a growing aerospace presence. The supporting infrastructure players for these companies are heavily invested in supplier chains from chemicals to manufacturing even if material amounts of supplies comes from the home country. The legacy Detroit 3 Chrysler is now part of Stellantis (Peugeot, Fiat, Chrysler). Volkswagen is a major player in Mexico as is Stellantis.
The Trump tariffs hit EU on everything from steel/aluminum to agriculture, and the EU retaliated in proportionate response each time. The Section 232 designation for national security tariffs on NATO partners was one of the stranger episodes in the US-EU trade experience since some had troops in the Middle East alongside US troops.
Blaming Germany for the lack of purchase of GM and Ford cars was almost funny in its message since Ford and GM had manufactured in Europe for decades and failed badly and then mostly exited. Since then, Stellantis now owns Chrysler, so they make cars here now. With Russia as a small economy around the size of Spain and a negligible trade partner, it is all rather strange and irrational to throw in with the country that is not an ally and does not invest in the US.
The Section 232 study on autos assembled by the Department of Commerce was so embarrassing that it was never released. We discussed this in the last major commentary on trade on the year end 2023 trade data, but the substance of the effort is clear in the Trump team’s refusal to release the study. Would the lack of BMWs increase national security when they are making them in South Carolina? The same applied to Mercedes in Alabama or Volkswagen in Tennessee (those deep red states must be in on the German conspiracy). The Trump team would not release the report and invoked executive privilege. According to a report on the subject from the Department of Justice’s Office of Legal Counsel (DOJ):
“The President may direct the Secretary of Commerce not to publish a confidential report to the President under Section 232 of the Trade Expansion Act of 1962, notwithstanding a recently enacted statute requiring publication within 30 days, because the report falls within the scope of executive privilege and its disclosure would risk impairing ongoing diplomatic efforts to address a national-security threat and would risk interfering with executive branch deliberations over what additional actions, if any, may be necessary to address the threat.”
Translation: “This is so bad we cannot let it be made public.” Congress had tried to force its release, but it was buried. That says something about the rigor and depth of the thought process. Coming off D-Day week, the Section 232 rationale in retrospect seems especially pathetic.
Mexico: Deportation from Dusk till Dawn…
A new President in Mexico (Claudia Sheinbaum, who is on “Team AMLO”) could get tested very quickly if Trump is next in line. That is not only given Trump’s oft-voiced views of the Mexican people but also the mass deportation program “planed.” We assume the deportations will not be on Carnival Cruise Lines, but there is little clarity on how those detained will be logistically managed as a new deportation program shows millions the exit. Is it the expectation that Mexico will simply take them all? Could Mexico simply refuse? The massive internment camp imagery will not be a good look for democracy as we lecture Russia and China.
The deportation numbers under discussion are in double-digit millions, which is vastly more bodies than were mobilized on short notice in WWI and around the peak mobilization in the military in WWII. People can go to rallies and cheer with their red hats, but how exactly does this kind of logistical mountain climbing exercise get managed? And why is it assumed that Mexican trade flows will not go into crisis mode? What will that all mean for prices, demand, PCE, etc. Going from paper and big talk to reality has really never been a Washington strong point. To quote a Die Hard movie line on Katrina: “It took 5 days to get water to the superdome.” That was a response to how the brilliant people in Washington will defeat a cyber villain.
Such major conflicts are when trade flows get used as a weapon. It could be the economic equivalent of jumping in someone’s lap with a hand grenade and threatening to pull the pin. The other side could always say “go ahead.” Trump has not articulated his plan on Mexico and what it all means for trade and economic multiplier effects.
We can expect the usual “we will have a plan in two weeks” as we have heard a few times of late. The health care plan and attempted ACA repeal offers a legacy lesson on massively complex items that lack plans. In the case of Mexico, there are overriding economic stakes. The dollars even for Texas-based hardline border control advocates are daunting. Once again, this is the difference between “show and dough.”
That deportation turmoil could lead to border closings, disruptions in trade and supply movement from materials (flat rolled steel, aluminum) to commodity components (from autos to tech) to integrated systems that see a lot of two-way traffic back and further across the border. That includes assets owned by US multinationals. That is a lot to digest in terms of how that flows into goods and service pricing, volumes, and unit cost trends.
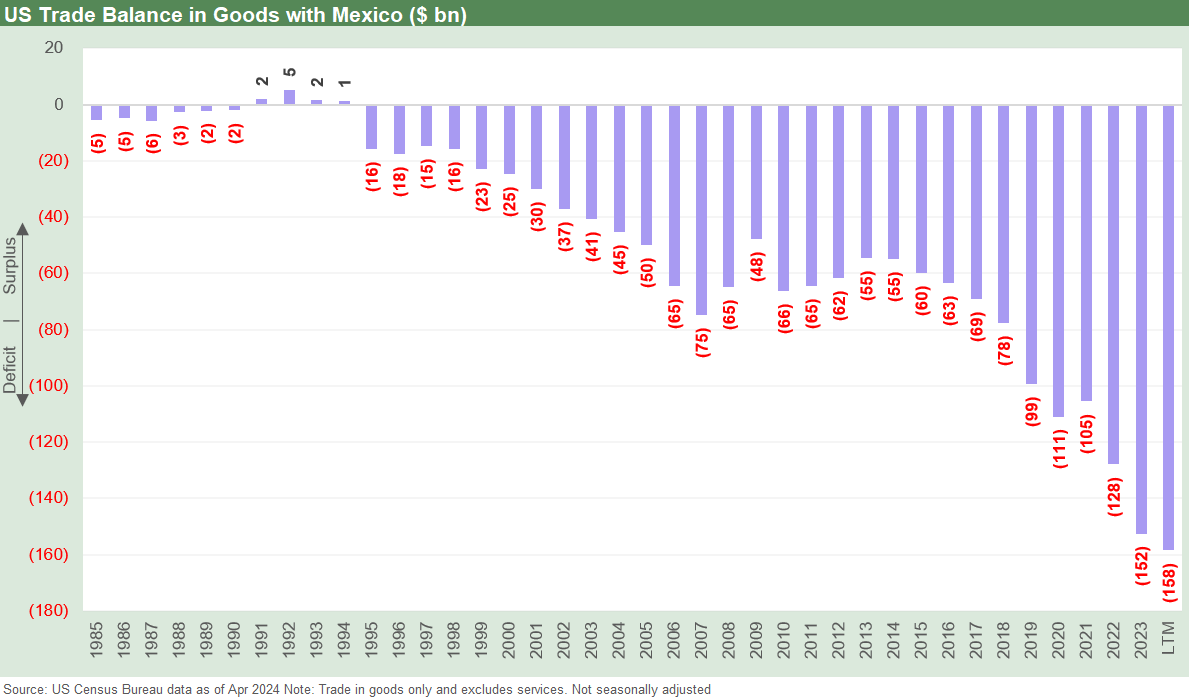
The above chart plots the long-term timeline of Mexican trade flows and the rising US-Mexico goods trade deficit. As a reminder, NAFTA was agreed to by George HW Bush in 1992, legislated in a bipartisan effort (with a lot of Democrat opponents voting against it) and signed into law by Clinton during Dec 1993 to be effective at the start of 1994. The trade deficits ramped up from there as barriers came down and more manufacturing headed south for the “assembly cost arb” from PCs to autos. NAFTA started somewhat of a “build it, they will come” and the OEMs and component suppliers did come.
Mexico also had the advantage of being a low-cost manufacturing base that attracted operations from other countries (Notably Japan and Germany) for the OEM and supplier chain expansion. The passport to NAFTA and access to the US markets brought substantial investment.
The chart below drives home the “up and to the right” pattern for both imports and exports across time and the US cycles. Much of the growth in imports along the way was dictated by US low-cost production planning within a free trade agreement, and that shows up in the mix. That also makes the US-Mexico relationship different than the China conditions where tech transfer and JV structures essentially changed the nature of control and the relative security risks of intellectual property. The geopolitical distinctions are also self-evident in friendshoring in Mexico vs. China sourcing.
The year 2025 could see a lot more tension in the relationship ahead the USMCA’s first six-year review in 2026 since China has shown interest in Mexican expansion and notably in the area of EV production. The response from the US will be aggressive, and Mexico will have some political issues to address there with some clear EV hostility from Trump and protectionist policies from the Biden team on climate initiatives that have already annoyed the EU.

One issue that is so unusual in the Mexico case besides the unit cost labor advantages is that so much of that capacity is owned by US, European, and Japanese companies. The same is true on the auto trade flows back and forth across the border with Canada, where GM, Ford, and Chrysler (now Stellantis) have been major manufacturers and have been joined by Asian transplants.
Mexico will be a major focus for trade in 2025 as more China investment is expected in the “back door” strategy for Chinese autos (EVs or ICE) potentially get preempted by aggressive US trade action against Mexico. The topic is on the front burner in Washington now and all over the trade publications.
The topic will remain hot since it brings the mix of China and Mexico together on the topic of winning the working class votes and waving the China national security flag. Those who want to win the climate war should want more low-cost EV alternatives, but this is now about jobs and nationalism and hurting US investment in US-based manufacturing.

Whether for supplier chain or demand for Mexican made/grown goods, the above chart tells a story on the import mix in manufacturing and assembly of goods with input sources from elsewhere (US, China, Japan, the EU, etc.). High quality flat rolled steel imported from multiple sources ends up in manufacturing vehicles and other goods. It all goes into the “comparative advantage” bucket with that biggest advantage being low-cost labor. Then politics come into the picture.
The top export to Mexico from the US is refined petroleum products followed by semiconductors, computer equipment, materials (chemicals/rubber/steel/aluminum), auto components and range of equipment and parts that can be used in the assembly process for re-export to the US. Overall, what gets sent to Mexico includes a high mix of manufacturing and value-added parts and supplies. The interdependence is tough to break up when the US-owned and operated companies designed the system.
Northern exposure: Canada always the best trading partner…

The above chart shows a bigger swing in the trade deficit and even less of a clear pattern than what we saw with Mexico. The Mexican base of auto and truck production materially exceeds that in Canada. The main union in Canada is powerful and cuts across industries (Unifor is successor to the Canadian Auto Workers), and they have slowed the bleed of migration of US investment to Mexico.
Crude oil is the #1 import into the US as oil sands production has ramped up impressively over recent cycles. Oil prices have been volatile but the peak crude oil imports in dollar terms was seen in 2022. During 2022, crude oil was almost ¼ of the imports from Canada with the Russia-Ukraine effect, declining modestly in 2023. Autos and light vehicles were a distant second (auto parts also in the top 10 with Refinery Products and Aerospace products and aluminum in the upper ranks.
The top exports to Canada in manufacturing include autos given the nature of the ownership structure of the production and where select models are made. Interestingly, the US is a key supplier of crude oil and refined products to Canada given the regional variations of Canadian infrastructure and how the East and West of Canada feel about pipelines. Coastal province politics and the relationship with Alberta and oil sands is a lot like California with Texas (i.e. hostile).

The hostility toward Canada by the Trump team was out of line with the very high-quality export mix we see in the export lines as detailed below for 2023 (note: we will update the mix for each major trade partner import-export pair in later commentaries). The mix is favorable for the US and ex-crude is a trade surplus. So by Trump’s own standards, the attacks on Canada were off base with some battles on Wisconsin dairy issues.
We also do not see Canadian crude imports as factoring into less energy independence. If anything, the oil sands sector and Alberta are dependent on the US. That oil sands industry and Alberta have a frosty relationship with British Columbia and a very icy relationship with Quebec. That has made takeaway capacity expansion battles a war similar to what goes on in the US.
Having a Democracy and long-time ally with a massive reserve base literally attached to the US is supposed to be appealing. The Russia-Ukraine and inflation spike just reminded us of that. The 1973 and 1979 experiences and a glance at the map for the Strait of Hormuz in dangerous times also supports the Canadian Energy case with more ties to the US. You obviously can get a fight on anything tied to this topic in the climate vs. carbon faceoff.
Having an oil market resilient to any outcomes in Russia or the Middle East has obvious virtues. Otherwise, you end up looking foolish going hat in hand to the Saudis and Venezuela when Canda sits due north but can’t get their oil from Point A to Point B. The policy navigation of how to increase climate friendly alternatives while keeping large scale production volumes in a growing economy is one more thing that gets buried in a binary world of White Hats and Black Hats and each side reversing the color.

Across time, the export and import line for US-Canada move in lockstep with some occasional deviations more tied to the price of oil. Canada should be much less contentious in coming years than Mexico in the free trade deal. With a more climate-friendly profile in Canada, it will be interesting to see what China tries to do in low cost EVs in coming years. China and Canada have been less than warm and fuzzy in recent years. Unifor is not likely to be welcoming to China EV imports and has already laid down some rules of the road for negotiators ahead of the 2026 review. They also have some gripes with some US policies (softwood lumber, labor, etc.).
Trade is a topic that starts complex and stays complex, but it would be nice if two Presidential candidates could agree on the facts and in one case even show up with some. There is a lot of factual history there for some to avoid. It clutters up the story apparently.
Contributors:
Glenn Reynolds, CFA glenn@macro4micro.com
Kevin Chun, CFA kevin@macro4micro.com