
UST Moves: The 1990-1991 Risk Factor Pig Pile
We look at the onset of the 1990 recession to the Greenspan easing frenzy.


We look at the UST curve shifts and fed funds action as the brokerage players faced funding challenges, soaring asset risks, and some pockets of evaporating secondary liquidity in risky credit.
The Drexel Chapter 11, a Shearson Lehman bailout by Amex, and First Boston getting rescued by Credit Suisse were just parts of the 1990 story.
The early August invasion of Kuwait by Iraq broke new ground for US military action that would reverberate for decades via a UN mandate and another military action in 2003, but the immediate impact on CPI and consumer anxiety in 1990 set off a recession impact that badly damaged the consumer and investment lines of GDP.
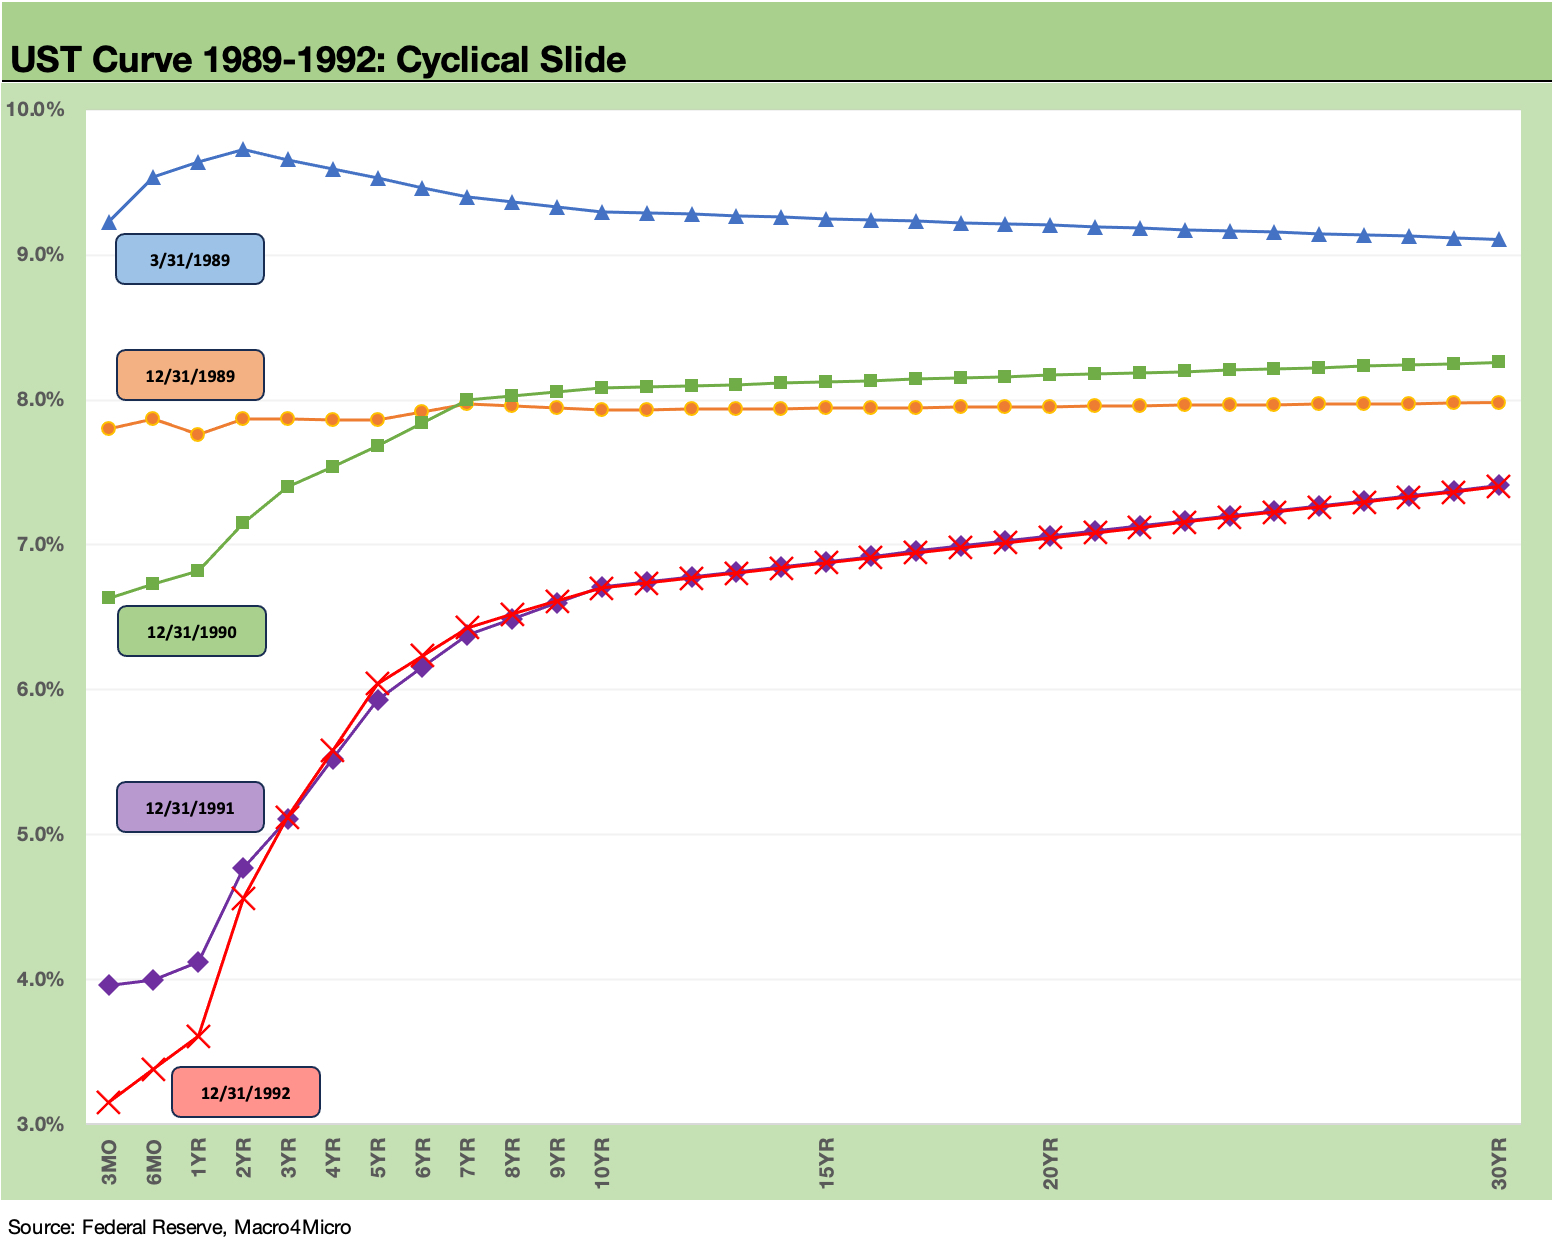
In this commentary, we continue our look at the UST curve migration and shapeshifting as the 1980s bull market came to an end and trouble in the credit markets was worsening. We looked at the 1988 to 1989 transition in a separate note (see UST Moves: 1988-1989 Credit Cycle Swoon 10-20-23), and herein we pick up the story from that point with a look at the 1990-1991 leg of a very rough journey.
The weakness in late 1989 came on the heels of a considerable amount of credit excess in the 1980s with a notable binge in 1987 and 1988 with a last round of excess in 1989 that quickly was derailed as LBO deals were canceled and stress on the securities sector set the stage for widespread chaos and more financial collapses in 1990.
The Mother of All Bad Timing
One of the main economic dislocations in the 1990 bout of volatility came when the Middle East devolved into another regional conflict (this one between Iraq and Kuwait) that pulled in the US as the major driver of military action. The turmoil drove oil materially higher as we detail in the chart below.
After the invasion of Kuwait, oil went into an upward spiral and CPI with it. For some in the markets, that brought back memories of the 1979 Iran fallout just as the Iran events of 1979 had brought back memories of 1973 and the start of an oil embargo.
Those two earlier bouts of OPEC turmoil ended badly. In this case, the US (wrapped in a UN mandate) was helping two prolific OPEC nations (Saudi Arabia and Kuwait), so the situation was different. The Iraq invasion did not involve Israel or fundamentalism and was an old-fashioned invasion by a power-mad leader with expansion ambitions. Saddam Hussein had already failed with his Iran ambitions, so Kuwait was smaller game. For the US, that was too close to Saudi Arabia and too much oil risk (despite the ancillary lofty rhetoric).
As we see today, the Middle East has a bad habit of being in a constant state of conflict. Back in the late 1980s, the oil markets were just coming off the back end of the protracted 8-year Iraq-Iran War that tends to get overlooked in the historical discussions (despite estimates that over 500K died). That brutal war (chemical/gas attacks by Iraq/Hussein, etc.) ended in the summer of 1988, and supply aftereffects had sent oil prices spiraling downward.
Below we plot the WTI price action from 1986 to 1993 to highlight what a shock the late 1990 period was for sentiment and flashback effects.
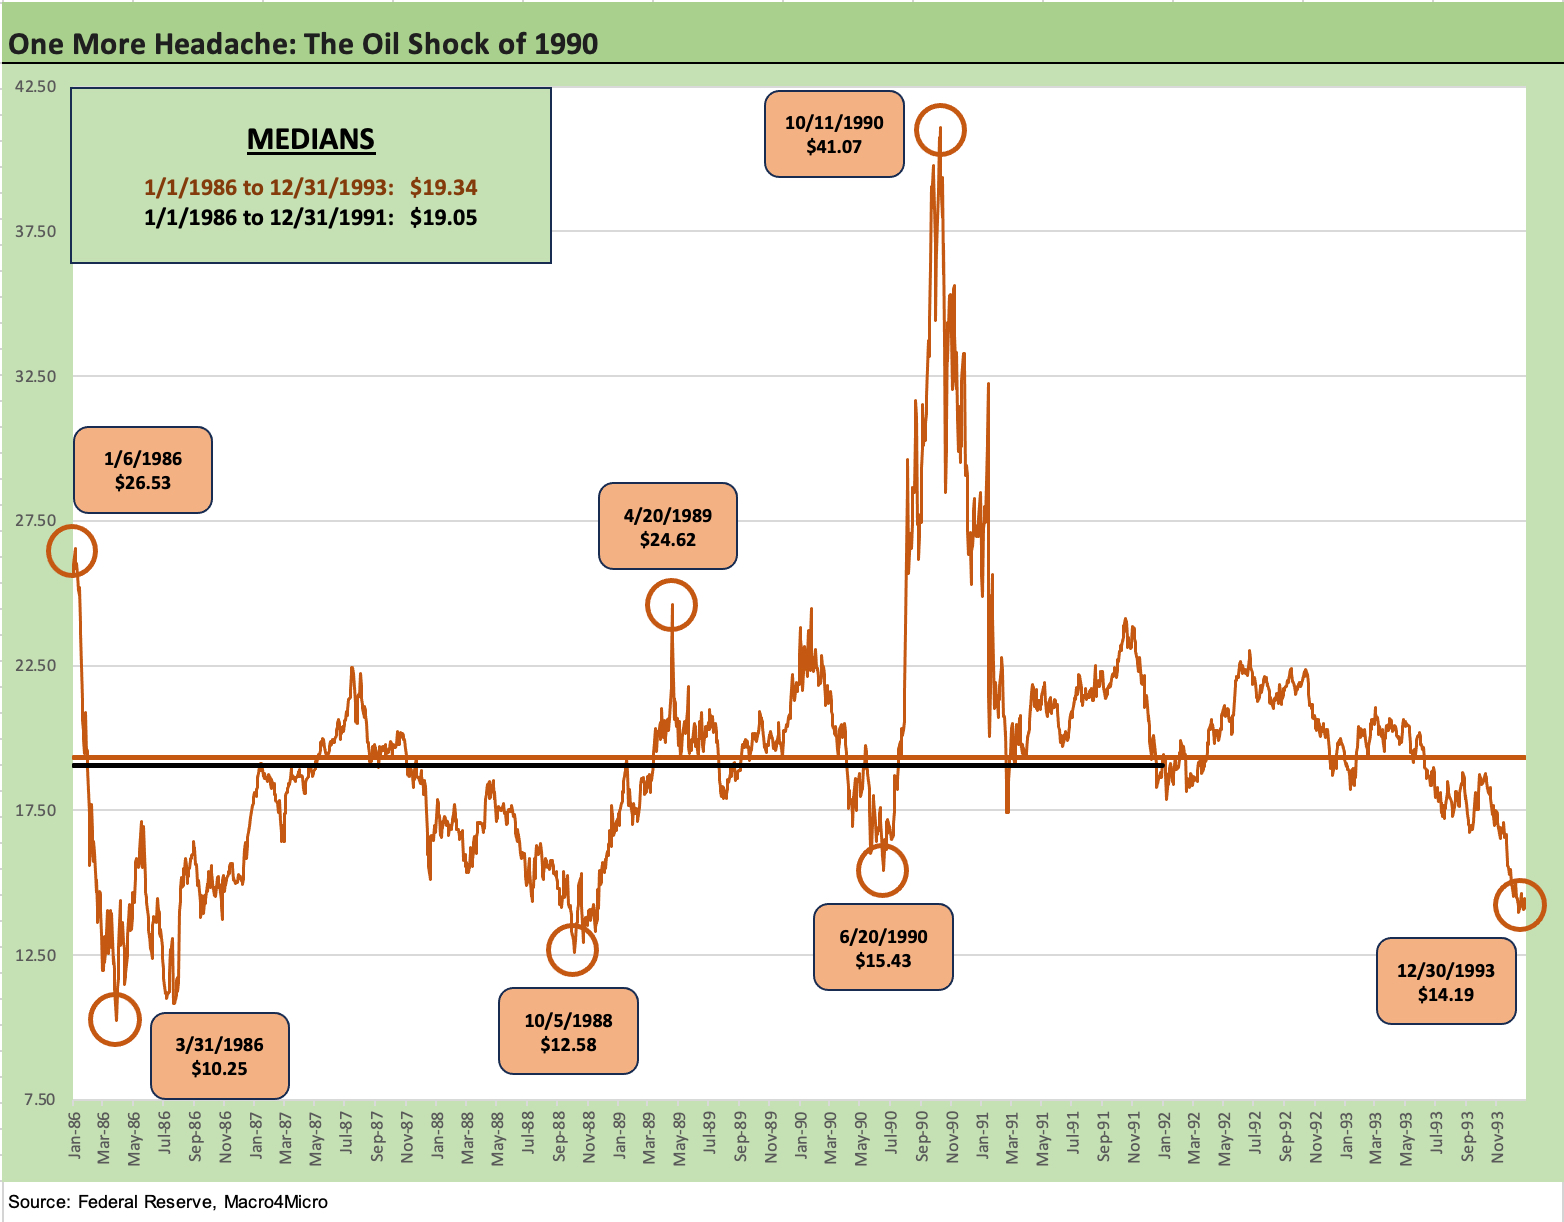
Oil had already been volatile but more to the downside after 1985. With the end of the Iraq-Iran War in 1988, the market saw oil supply rise as Iran and Iraq looked to rebuild and generate much needed cash flow. The supply caused a decline in oil as noted on the chart.
We saw $12 area lows on WTI in 1988 after the markets had seen oil rebound off the lows of the oil collapse of 1986 to back over $20 handles in 1987. As noted in the chart, the median leading up to the 1990 spike was around $19 (1983-1991). The median was similar if we keep the timeline going into the 1993 period in the chart. The fall and early winter of 1990 thus jumps out relative to June 1990 lows.
As detailed in the above chart, the military action of 1990 in the Middle East sent oil rocketing higher to over $40 at one point (that would be around mid-$90 inflation adjusted to current times). The 1990 economic slowdown in the US was thus joined by an oil spike that took a toll on CPI metrics but also on consumer confidence and propensity to consume. The word “stagflation” was back in vogue and the consumer sector backpedaled as well.
Oil shocks were never followed by good things in the economy as seen in 1974/1975 and 1980/1981. With the systemic bank crisis of 2008 and what unfolded afterward, it is sometimes easy to forget the brutal spike in oil in the summer of 2008 to all-time highs in absolute as well as inflation adjusted terms. The $145 area closing price ($147 intraday) on WTI during July 2008 is one for the cycles.
As a reminder, that had a very damaging effect on autos and light trucks and vehicle leasing that caught the headlines until September 2008 brought much bigger problems.
The oil price pain and sentiment fallout in 1990 still translated into contraction. That weakness was underscored by the -3.0% PCE line in the GDP accounts in 4Q90. A PCE contraction of that scale was rare enough, but it also fell heavily on the PCE Goods line (-6.2%) and even harder on the Durable Goods line (-10.6%). The 1Q91 GDP numbers were not much better with another GDP contraction (-1.6%) and PCE Goods slammed again (-3.4%) and with PCE Durable Goods beaten down once more in 1Q91 (-10.6%). During that stretch, Chrysler long bonds dropped over 50 points with BBB tier ratings and bottomed even before the downgrade to HY.
The weakness spread across Gross Private Domestic Investment (GPDI) was brutal with GPDI at -20.6% in 4Q90 and the Structures component of Nonresidential at -16.8% along with -21.2% in Residential. Equipment was down -5.8% in 4Q90 and -13.6% in 1Q91. Structures stayed negative through 1Q92 and the same for Equipment. Now that’s an old school recession. The success in shutting Iraq’s military power down quickly prevented an even worse downturn.
For some useful contrast, the post-TMT economic contraction was very mild (no negative quarters in PCE) while the post-2007 contraction was more tied to a systemic bank crisis driving a collapse in credit availability. Post-2007 was much worse, and the COVID experience was the strangest and shortest recession ever. So, we have to go back to 1990 to find what might be called a “normal” economic cyclical downturn.
During 1990-1991, the problems in the credit markets and in bank asset quality were certainly keeping pace with the weak economic stories. That was notably the case in commercial real estate across many regional banks but also at Citicorp, which had become a major focal point for regulators (and a very rich Saudi investor, Prince Alwaleed, who became Citi’s largest shareholder).
The HY market implosion kicks off 1990…
The late 1980s was a period when many HY deals saw many LBOs printed that did not even cover interest on an EBITDA basis in year 1. As merchant banking operations on Wall Street attempted to get in on the action of the KKR types, the deals in those days often came with bridge loans from the brokers that would be ticking until refinanced in the bond market.
The fact that the brokerage/securities firms were heavily dependent on short term funding (notably commercial paper) raised the asset-liability mismatch risks and the stakes for inventories of high-risk illiquid assets. The LBO bridge loans on the books of the brokers would be sitting in the borrower capital structure below bank loans as subordinated exposures.
Those LBO deals usually came with a heavy, near term/intermediate term, amortization schedules to pay down the banks that materially raised the risks of any failed forecasts, a recession, or a failure to execute planned asset sales. The banks in the Glass-Steagall years had a zero-sum game with the heavy mix of unsecured asset exposure of the HY bonds and the subordinated bridge loans. In other words, loss exposure was very high and very equity-like.
From the top-down perspective on many LBOs, the deals were often like juggling macro and micro hand grenades on market and borrower conditions. Everything had to work right and especially with timing and the speed of offloading the risk.
A few of those grenades went off with First Boston and Shearson Lehman both facing funding pressures and outsized risks that required bailouts by current parents (Amex at Shearson Lehman) or soon-to-be parents (Credit Suisse at First Boston). A de facto bailout of Kidder Peabody by GE (then parent company) was also announced in March 1990 with heavy losses taken in HY and bridge loans.
The demise of Drexel Burnham…
The Feb 1990 bankruptcy of Drexel as the dominant player in the US HY market shook the risky credit market to its foundations since that firm had underwritten so many high-risk deals and held the key to many of the refinancing plans for their historical (but not future) revenue generators. The quality of the marks and secondary liquidity premium questions would drive collateral values lower and cause even secured bank lenders to draw a line on what haircut to assign and how to read the risks of advance rates on even secured HY bonds on a broker’s books.
The obvious problem when a major broker such as Drexel failing to fund its inventory is that the collateral and highly illiquid nature of the asset reprices all investment alternatives. That means the inventory of the buy side and sell side alike have a gun aimed at their accounting marks. The whole “maturity transformation” problem that was so much a part of the later conversations after the credit crisis of 2008 was not new to the world. Redemption at mutual funds and liquidation of a broker brings out transparency that complicates audits as well as advance rates on loans.
The fear of the mismarked illiquid asset cliff came up in the SIVs in the 2007-2008 subprime mortgage crisis that had been funded by commercial paper and MTNs. Unwinding those structures would create a freefall and even more threats to banks, brokers, leveraged owners (hedge funds), and unleveraged owners (insurance companies, pensions, etc.). The interconnected risk issues run pretty deep over the cycles, and 1990 was the original version without all the derivative counterparty risks of later cycles.
Bridge loans, mismarked assets, impaired secondary liquidity, and asset-liability mismatches…
The bulk of the other major desks were at firms that were issuers in prime commercial paper markets, so the rating agencies and the CP holders also had to rethink the HY inventory and bridge loan exposures and risks of the counterparty.
Having a headline bridge loan problem could set off a scramble of pulled or reduced commercial paper approved lines. That certainly came up at Shearson Lehman as “all hands on deck scrambles” to get commercial paper lines approved (especially over quarter end dates) was a routine exercise (with anything but routine significance to the fate of the firm). In a market like 1990, the questions were tough for the short term funder and the answers less than satisfactory.
Shearson Lehman Hutton had attempted in late 1989 to raise capital in a stock deal. I was drafted with one of my colleagues to play “demanding road show investors” for Q&A prep with a senior finance executive. Our role was to be rigorous and challenging and to dig in on the risks that skeptics would lock in on. He was not happy with the tough questions and was a tad red faced (we buried him). The deal was later pulled (nothing to do with the Q&A session) since there were no good answers to the questions anyway. The Shearson Lehman CEO was gone soon (weeks later) and then, soon after, Shearson Lehman was bailed out by Amex.
For Shearson Lehman Hutton (a soon to be shortened name), it was about a lot more than the disastrous Prime Computer bridge loan since there were waves of legal exposures and contingent liabilities from other risks taken on across the diverse operating units.
Over at First Boston, the infamous Ohio Mattress bridge loans became the “burning bed.” At Shearson Lehman, people made up some of their own names for the Shearson Lehman bridge such as “Primed” Computer, “Slime” Computer, etc. Not good times.
Short terms funding risks ruled…
The trigger points for a default and Chapter 11 and essentially the end of a securities firm can be as simple as not being able to roll your short-term unsecured funding. The other side of a failed roll of CP or a master note or any short-term maturity was essentially game over. In the case of Drexel, the fact that it was the primary market maker and advisor/liability manager for so many high risk borrowers could set off a chain reaction in the HY borrower base and compound that problem with a collapse in secondary liquidity for the bonds in the market.
A collapse of a primary market maker in HY sets off the domino effects for other trading desks on the street who could easily choose to only make markets in their own underwritten deals and then only for small size and at very steep (read “punitive”) haircuts. The hand-over-phone question was often “Is this for a mark or a bid?” underscored the murky nature of OTC bond pricing in such times. The redemption risk at HY funds drove home the mismatch inherent in mutual funds that would need to find liquidity and prices even below theoretical recovery value.
As the market has learned across the cycle, the absolutely best time to buy into a diversified portfolio of full spectrum HY bonds is when secondary liquidity is dislocated and the liquidity premium is dominating the worry list. That is when you get paid far in excess of what is fair for the theoretical default risk and recovery rates and loss exposure you face if you hold.
Of course, you cannot just sit around waiting for a crisis since foregone coupons compound on reinvestment. HY bonds have historically delivered solid returns with coupons and risk premiums. Some markets are simply better for moving to overweight and offer better entry points.
Recession starts in July 1990…
The 1980s expansion was shorter than the 1960s cycle, but was very eventful in capital markets evolution (see Expansion Checklist: Recoveries Lined Up by Height 10-10-22). As covered separately, the “official” economic expansion came to an end in July 1990 (see Business Cycles: The Recession Dating Game 10-10-22).
The July 1990 date was the cyclical peak and start of the recession. That July 1990 date was announced by NBER in April 1991. It was later announced in Dec 1992 that the recession was over in April 1991(!). By April 1991, we can say literally “the war was over” (the Gulf War). Meanwhile the recession was already over by the time the start of the recession was announced.
As an old colleague/strategist at Lehman (the late Greg Batey) once said at a podium in London as the 1992 European currency crisis started, “There’s a reason why economists don’t have P&L’s.”
Credit cycles vs. economic cycles…
Since the late 1980s, the concept of the “credit cycle” (as opposed to the economic cycle) started to catch on since they can be very different and distinct in timing and severity. Then there is the semantics of the default cycle, which lags the economic cycle and lags the credit cycle by even more.
For 1990-1992, the economic cycle and credit cycle both saw downturns that were ugly. In contrast, the post-TMT economic contraction was quite mild while the TMT default cycle downturn was hideous and arguably lasted from late 1999 to the spring of 2004. The recession was over in Nov 2001 per NBER. HY default rates did not cross under 5% until 2004.
We will cover the TMT credit cycle in a separate piece, but it still holds the record for the longest (not the highest) default cycle as it peaked around 11.6% in Jan 2002 but endured for a protracted stretch.
The prior economic contraction that ended in Nov 1982 came on the other side of a lengthy battle with inflation and stagflation. The credit crisis default cycle lifted off around Dec 2008 above 5% and the default peak was 14.6% in Oct 2009 (depending on data sets). The default peak for this credit crisis cycle thus came after the recession ended with the June 2009 trough.
As noted earlier, the invasion of Kuwait (Aug 2, 1990) happened right after the official recession date. The confluence of events in the market made for a wild ride for HY desks with Drexel gone and numerous brokers seeing staffing and capital commitments shut down or severely retrenched at many firms. Some would restrict reasonable bids to deals they underwrote and would discriminate on pricing and size by client priority.
Donaldson, Lufkin, Jenrette (DLJ) was later a major winner of the contest to reel in key players from the Drexel Diaspora, who were among the best and most experienced in the credit business. Many Drexel alums went on to be rainmakers and start/lead major hedge funds and private equity firms. We used to call the more sea level Drexel refugees the “Class of 1992” as securities firms ramped up a HY business was crippled in 1990 before the rebound in the asset class in 1991 encouraged more investment in people and balance sheet in 1992.
The default cycle peaks at a lag during the rally bounce…
The 1990-1991 period marked the first major HY bond default cycle. The default cycle peak comes at a lag to market pricing with 1990 the low point in pricing. During 1991, the market saw a major rebound unfolding in HY as defaults peaked in mid-1991. The +39% return in US HY in 1991 was occurring at a time when the Fed was just getting underway in easing and during a period where NBER “ruled” that the expansion was underway as of March 1991.
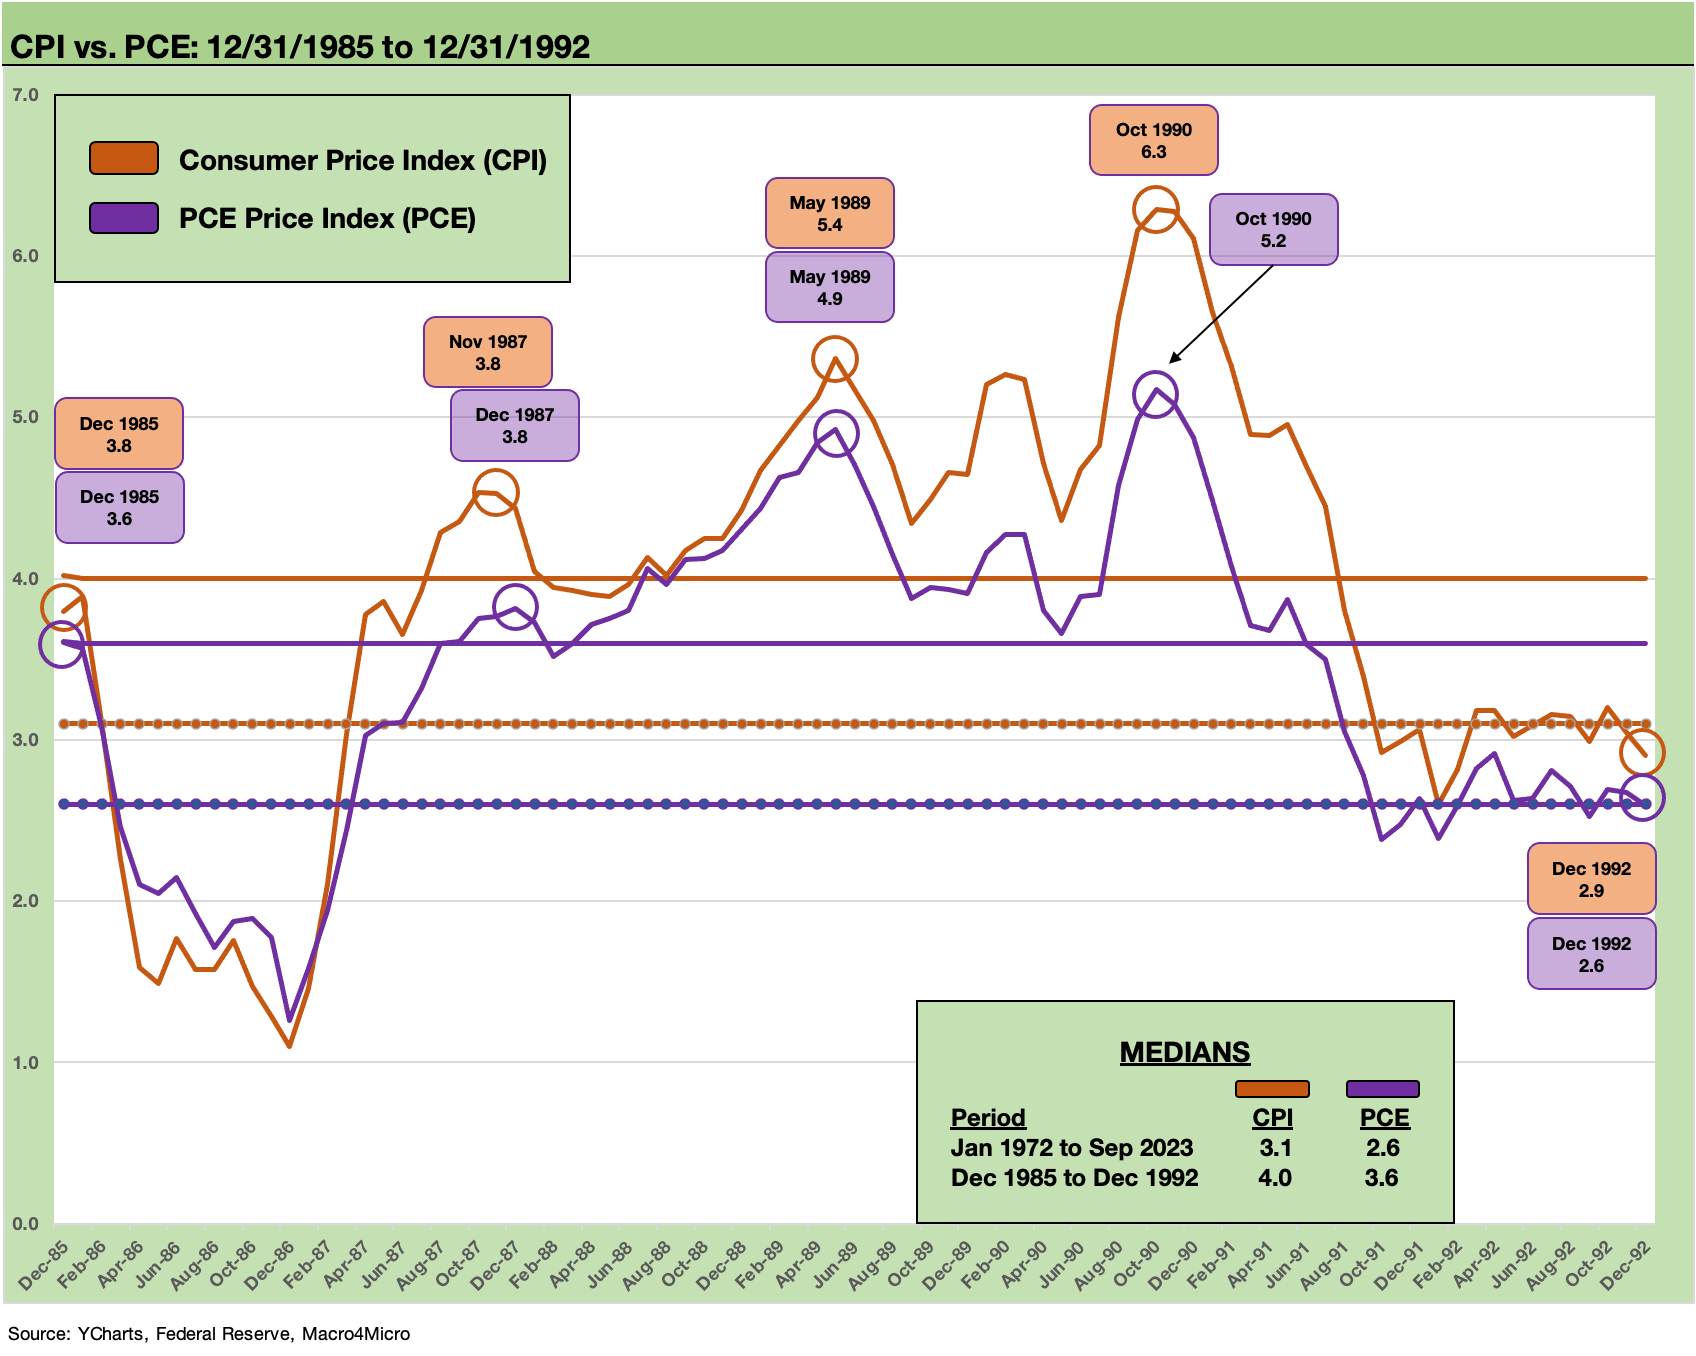
The above chart plots CPI and PCE across the 1986 to 1992 timeline. We used this chart in the 1988-1989 commentary also. We see the path of CPI from the 1986 1% handle lows to the high of 5.4% on CPI in May 1989 and then a fresh spike to 6.3% in Oct 1990 with the Iraq-Kuwait oil price fallout.
We post the median CPI and PCE inflation levels for the 1986-1992 timeline as well as the long-term timeline of Jan 1972 to Sept 2023. As we detail in the fed funds timelines in the next chart, the relationship of fed funds to inflation showed distinctly positive real fed funds over the timeline of 1986 to 1992.
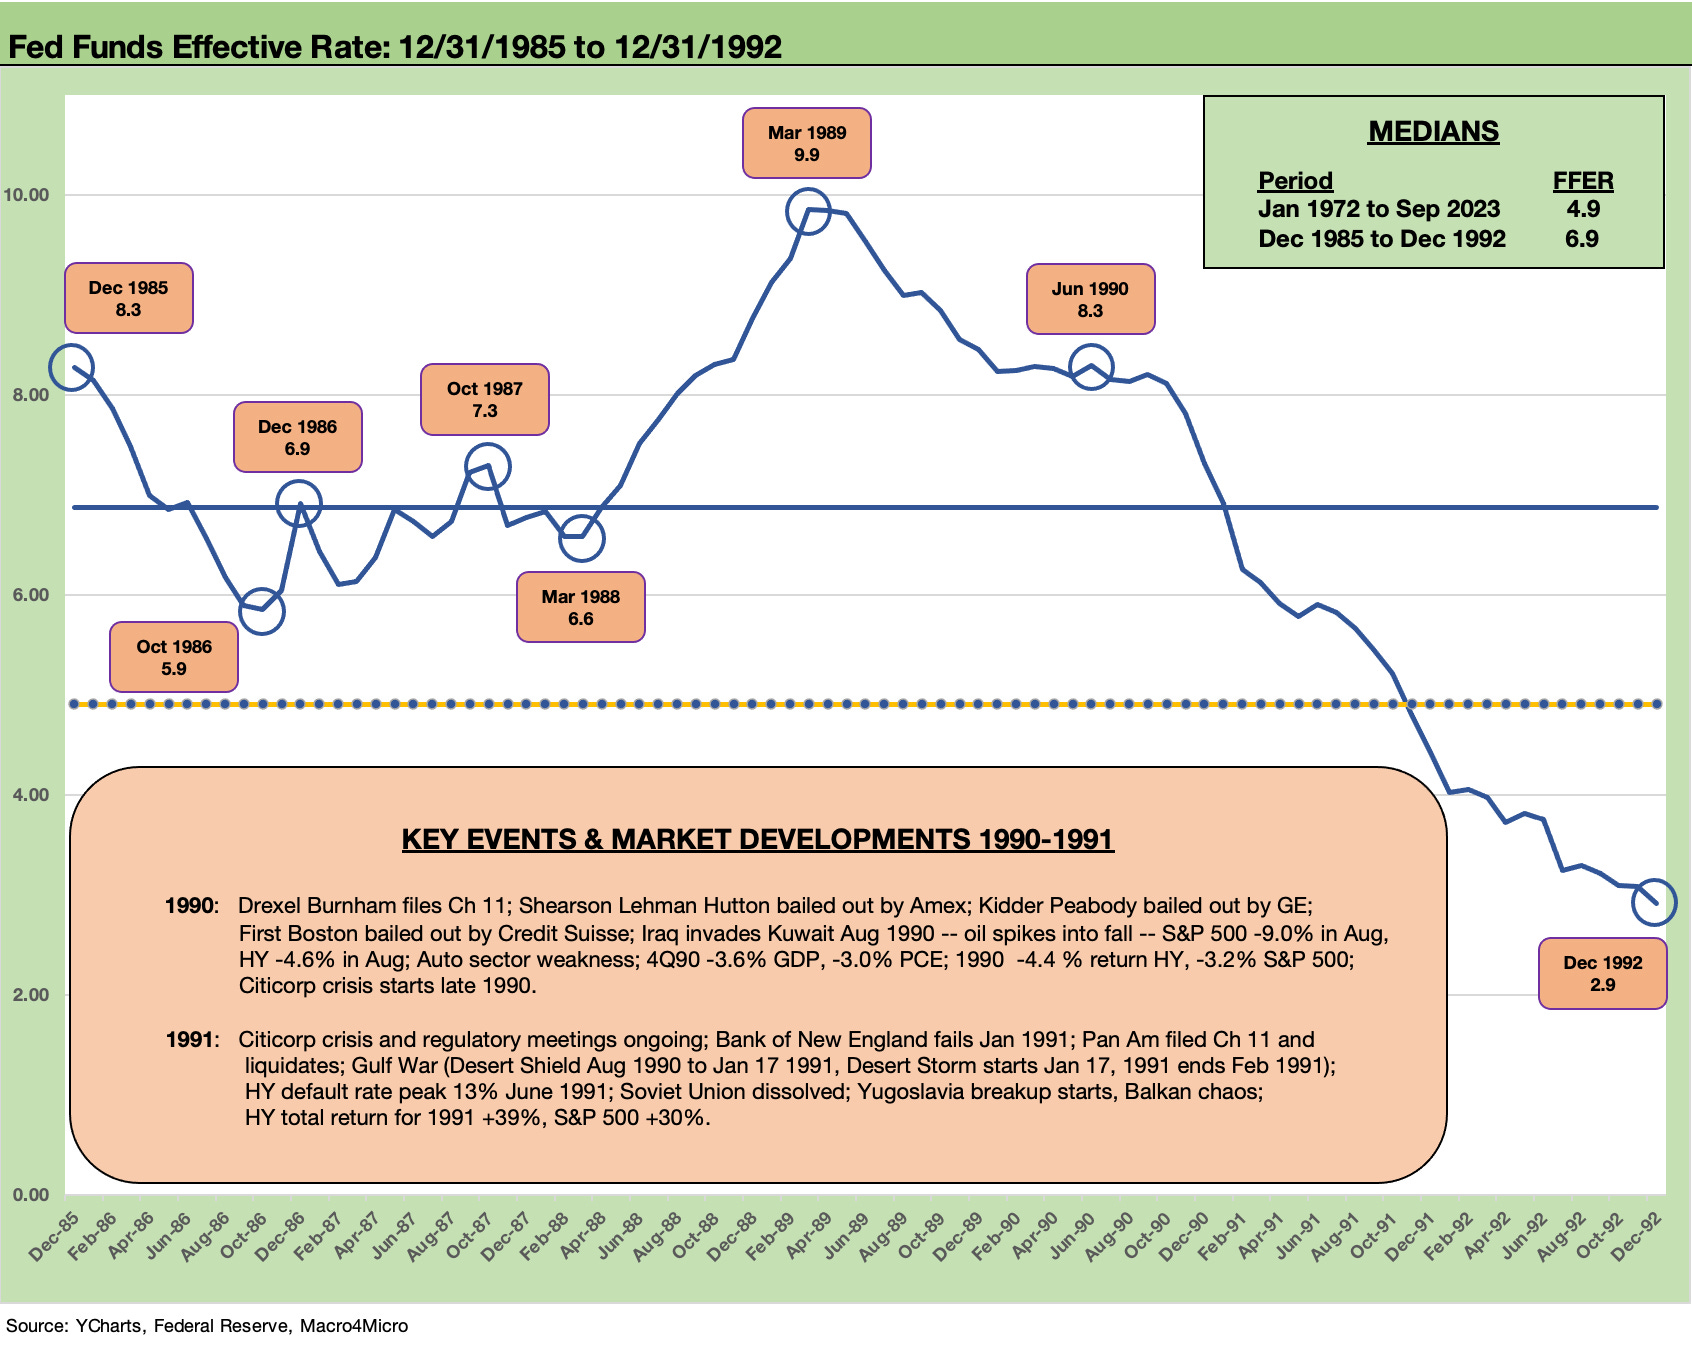
The above chart highlights the Fed funds rate from the end of 1985 to the end of 1992. We included this chart in the prior commentary that looked at 1988-1989 when we tackled the wild transition period from the 1988 credit cycle peak across the 1989 turmoil (see UST Moves: 1988-1989 Credit Cycle Swoon 10-20-23). The chart shows the lead-in and follow-up of the path taken by the Fed during a very eventful period. We replaced the 1988-1989 “Event Box” above with 1990-1991 events.
The increasingly severe financial market strains of 1989 had brought legislation that raised more alarms around bank system health as the market rolled into 1990 and the assets were hitting the fan as detailed earlier in this piece. The year 1990 saw the brokerage sector in upheaval and soon the regional banks were getting hammered as well.
The markets were volatile to the downside in 1990 for many reasons. The easing took fed funds from 8% handles in late 1990 to low 4% handles to end 1991. The notable tail to the easing shows 3% handles and dips below 3% in 1992 and stayed in that range into 1993. That overlaps with the period of the Fed wrestling with the sustained bank system stress points and commercial real estate pain seen across the period. The radiating regional bank problems and continued regional thrift challenges (notably California) are part of a bigger story that overlaps with consolidation in the banks.
The experience of aggressive tightening that came after 1993 in the 1994 mega-tightening will be covered separately when we circle back after the cyclical transition commentaries are posted. The year 1994 somewhat shocked the market since CPI was generally in the 2% handle range but the Fed put 6 hikes on the board taking fed funds from 3% to 5.5% (see Bear Flattener: Today vs. 1994 and Aftermath 10-18-22). The ensuing downward shift and bull flattener into 1995 told a major risk rally story that we will cover separately.
The Fed kept the heat on high in 1990…
The consistent trend as we see above and track further below in the chart plotting “Fed Funds – PCE Inflation” is that fed funds were naturally higher than inflation. That was something you did not see in this recent 2022-2023 monetary cycle by any stretch. In 2022 we saw negative real fed funds rate for a protracted period. We were always surprised how little discussion there was of that fact on the Fed conference calls.
The inflation fighting part of the battle as evidenced in the spring 1989 fed funds peak was in part about the strong economy of the mid to late 1980s and the related pressure on Greenspan to not screw up Volcker’s earlier inflation victory. Greenspan was quite aggressive in using monetary tools to head off any inflation threat. The 9% handle fed funds in 1989 countered the peak 5% handle inflation peak.
With the Gulf War brewing in the summer and fall of 1990, CPI popped on oil from 4% handle CPI in the pre-Iraq invasion summer to 6% handles from Sept to Dec. That kept the 8% handle fed funds averages in place for 10 of the 12 months in 1990 as the economy grew weaker and bank system and capital markets credit quality eroded.
The economic weakness and sustained high rates also did not do wonders for the commercial real estate or residential markets that were already overbuilt and were either still on the back end of regional economic pressures (oil patch) or feeling the adverse effects of bank system strain and credit contraction (Thrifts/S&Ls failing, regional banks ailing badly).
1991 saw a shift toward supporting banks as more wobbled…
The trouble with regional banks and the critical situation at Citibank was a major factor in how Greenspan operated after 1990. By taking fed funds down from an 8% handle in the fall of 1990 to 4% handles in late 1991, the actions bolstered profitability of banks and also served as a catalyst for a wave of mergers. The regional banks grew from regional to mega-regionals.
The case study in the merger wave was North Carolina National Bank, which was aggressively rolling up banks from 1991 onwards as it changed its name to NationsBank on the way to acquiring BankAmerica on the path to being today’s BofA Merrill giant.
The steady easing and bull steepening of the yield curve with the Greenspan easing did wonders for the securities shops as well as the convergence of banks and brokers/securities firms would get underway later in the 1990s. That is a separate story that saw waves of consolidation and competition for expansion in the credit businesses.
The old correlation of credit growth or credit contraction to the direction of the economy was very much at work from the problems of 1990 to the post-1992 boom.
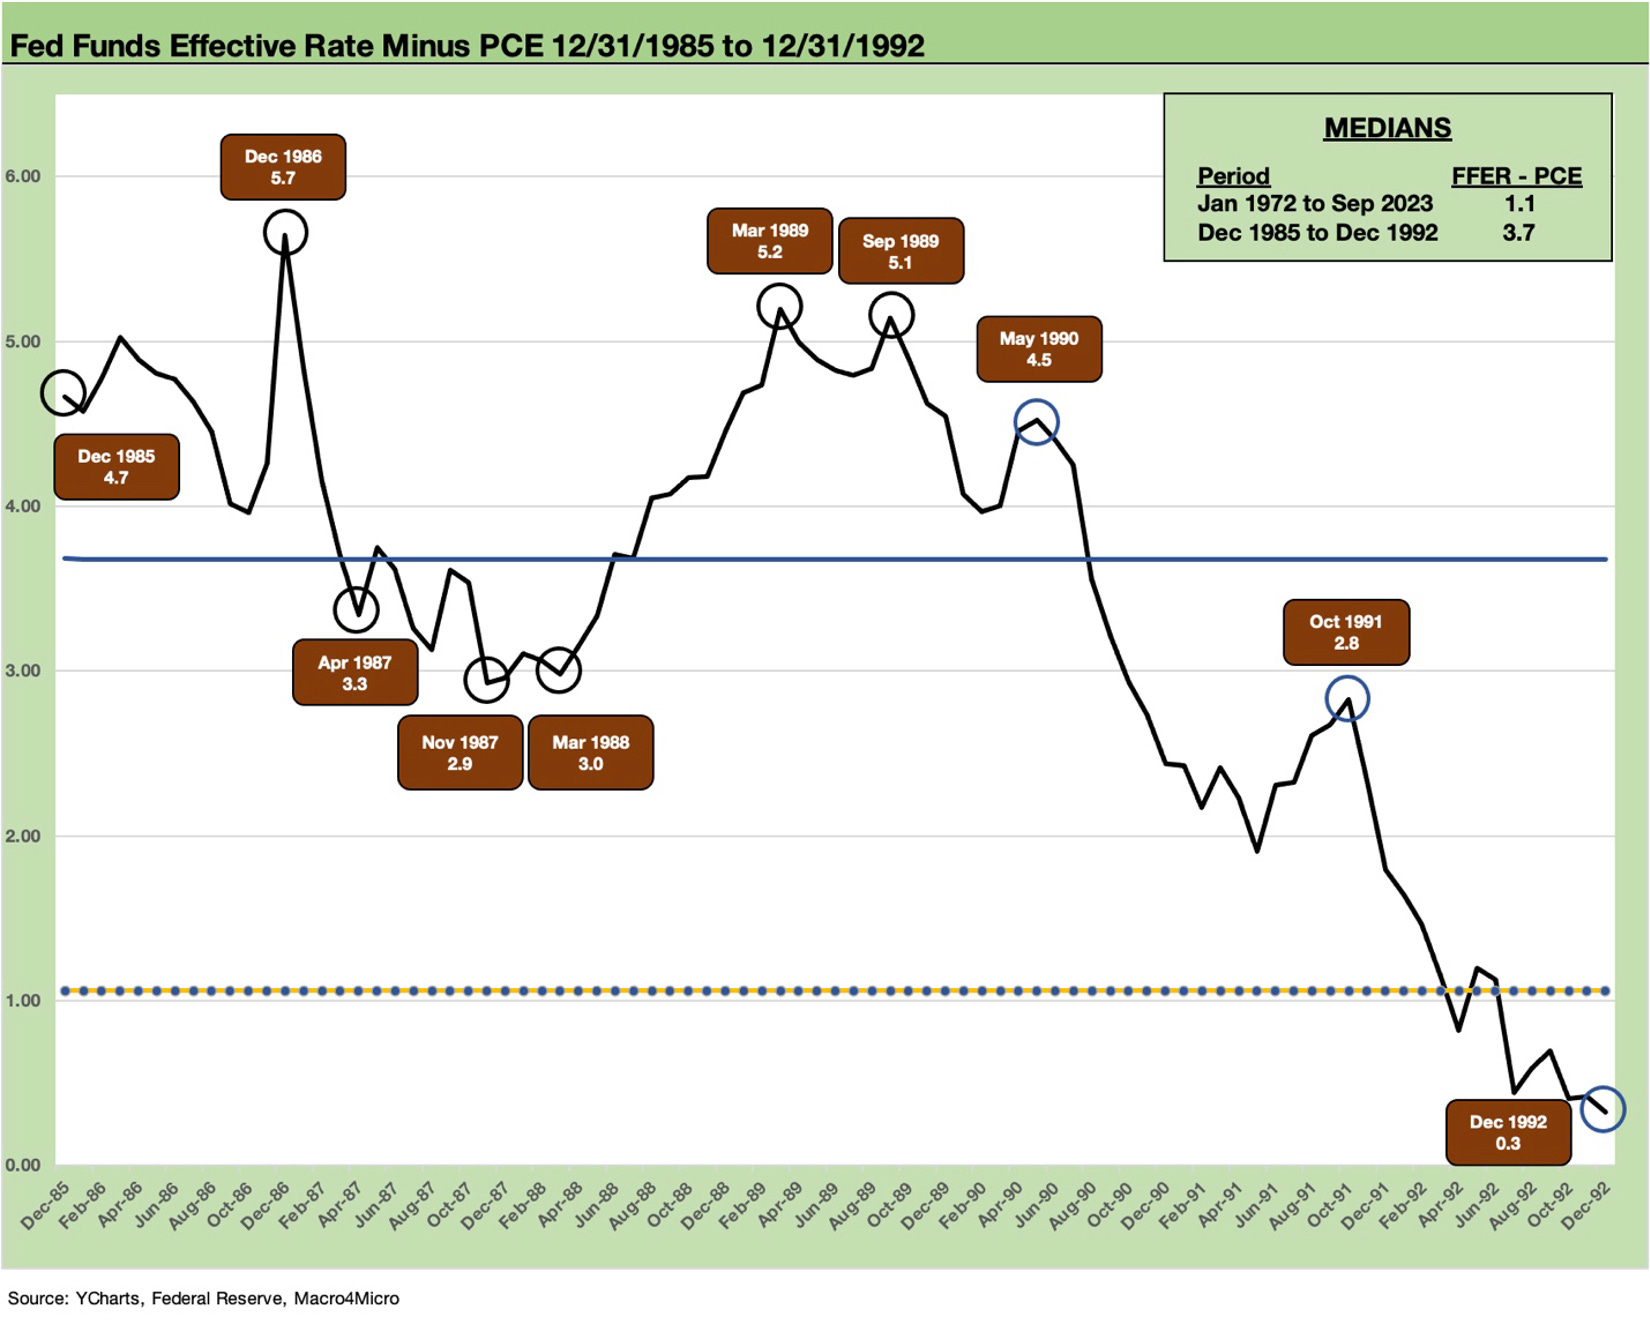
The above chart revisits the topic of positive real fed funds with a look at the time series for “Fed Funds minus PCE Inflation.” We have been routinely looking at this relationship and updating it since last fall when we started posting (see Fed Funds vs. PCE Price Index: What is Normal? 10-31-22, Fed Funds-CPI Differentials: Reversion Time? 10-11-22).
The chart above offers another more focused data point on why a viable battle against inflation usually drives that relationship. The CPI and PCE in the late 1980s was not that high relative to 2022, but then we can go look back at what worked for Volcker, which we addressed in our first timeline review in this series (see UST Moves 1978-1982: The Inflation and Stagflation Years 10-18-23). A sign of how tough Volcker was on inflation is evident in the relationship of fed funds and inflation back in 1986.
We saw Greenspan taking a hardball approach in 1989 above, but then the relationship compressed substantially (but still positive) through the recession and chaos of 1991-1992 as Citibank and the regional banks were getting mauled by asset quality problems.
By the end of 1992, the fed funds vs. PCE relationship was essentially flat. There are some questions of whether Greenspan feared he overdid the easing and tried to overcorrect in 1994 in a mega-tightening move that seemed to be out of left field (see Bear Flattener: Today vs. 1994 and Aftermath 10-18-22). We will revisit the interim periods again (including the pronounced swings across 1994-1995-1996) after we finish posting the cyclical turns and UST reactions.
We will next look at the TMT UST curve across the 1999-2002 credit market default cycle.