
HY Spreads: The BB vs. BBB Spread Compression
With HY OAS at post-2021 lows, we look at where the BB tier is positioned in multicycle context.


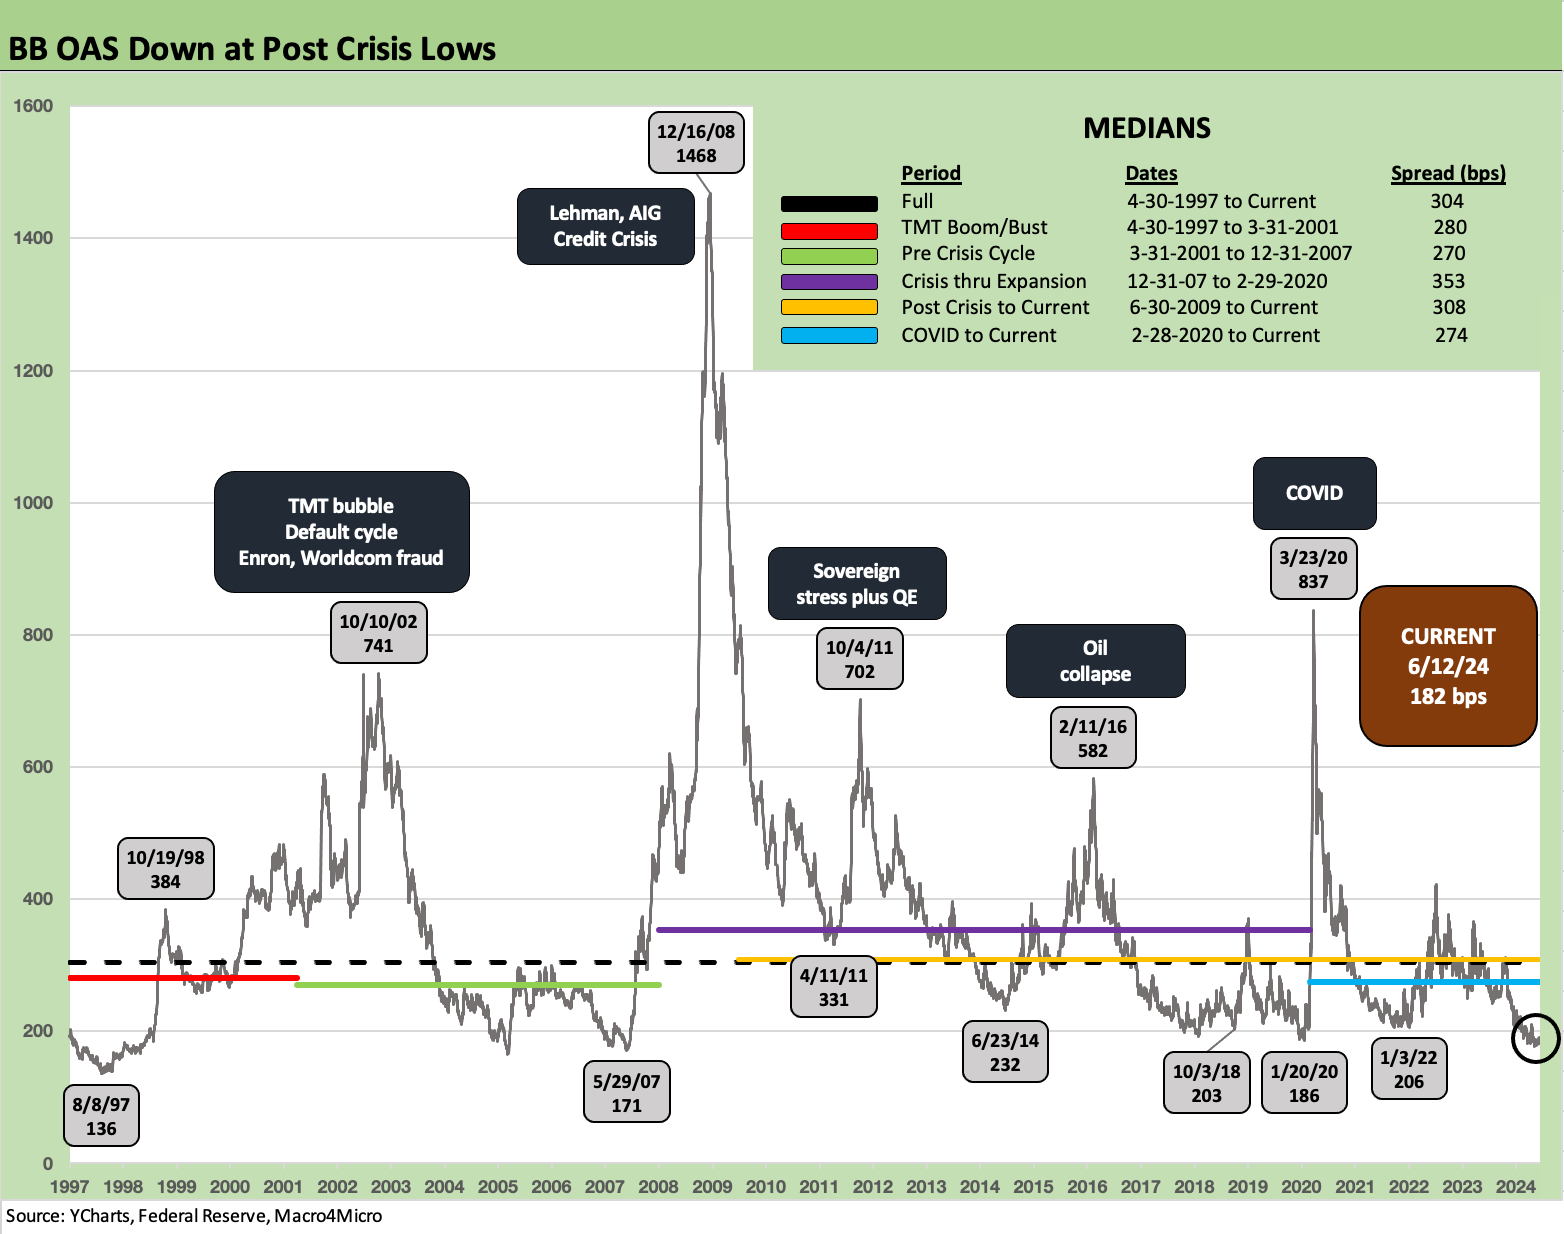
We update the multicycle spread history for some perspective as the BB tier also hits a low modestly above the spring 2007 credit peak and inside anything we have seen since the credit crisis.
On a (slightly) more upbeat note, the quality spread differential between the BBB and BB OAS is more generous than Dec 2019 and wide to the 2007 and 1997 lows.
The BB tier will still be an attractive layer to watch for opportunities as current market coupons roll in during the refinancing and extension cycle with 6% and 7% coupons based on current YTW levels.
We just updated where HY spreads frame in historical context in an earlier piece today (see HY Spreads: Celebrating Tumultuous Times at a Credit Peak 6-13-24), so in this note we look at BB tier credit spread history as the compensation for credit risk remains tight by any standard at a time when there is plenty of discussion on the state of duration returns as well.
The above chart shows the BB tier spreads across the cycles. With BB tier OAS at +182 bps at last night’s close, pricing is inside early 2022 lows (+206 bps) and slightly inside the lows of +186 bps in Jan 2020 before the onset of COVID saw the cycle unravel. BB OAS is materially inside the June 2014 levels (+232 bps). Interestingly, BB spreads did not get close to these levels in the broader Oct 2018 HY cyclical lows. The bottom tick for HY OAS on 10-3-18 saw +203 bps for the BB tier.
As we look back at the tight HY spreads of spring 2007, we see a low for the BB tier of +171 bps (May 2007). The 1997 credit cycle peak saw the BB tier all the way down to +136 bps (Aug 1997) and a long walk from the current +182 bps.
With the BB tier now at $654 billion and 51% of the HY index market value (vs. 38% of market value at the end of 2007), it is a major part of the HY index that is very different from the “old days.” For face value, the current BB tier of $671 billion comprises 49.8% of the HY index face value (vs. 37% at the end of 2007).

The above chart updates the quality spread differential between the BBB tier and the BB tier as a broader measure of recent spread compression in the middle tiers. With the BBB tier ranking among the largest nations in the world in size at $4.1 trillion in face value (over 6x the BB tier), the BBB is really a middle by itself.
The BB tier plays a very important, stabilizing role in the midsection of the credit tiers with so many formerly “IG only buyers” able to step down for a wider range of issuers and industry selection. The BB tier can function as a safeguard for credit allocation against the remnants of the “regulatory arbitrage” effects that historically made “the cusp” a riskier place to operate.
In other words, the BB tier can offer a better risk reward in many cases to play the improving BB names with less long duration paper than the larger cap full curve low BBB names that are more vulnerable to short term repricing risk. The “full curve” names can generate more volatility given the relative shortage of long duration 30Y buyers in HY funds. Names such as Boeing can face some challenging asymmetry.
Even in the face of tight spreads, the current par-weighted coupon in the BB tier is a little more generous at 5.6% but the 6.5% YTW signals some higher new issue coupons ahead as the refinancing and extension continues its slow and steady process after so many years of ZIRP and abnormally low rates.
See also:
HY Spreads: Celebrating Tumultuous Times at a Credit Peak 6-13-24
Trade Flows: More Clarity Needed to Handicap Major Trade Risks 6-12-24
Systemic Corporate and Consumer Debt Metrics: Z.1 Update 4-22-24
Credit Markets Across the Decades 4-8-24
Credit Cycles: Historical Lightning Round 4-8-24
HY vs. IG: Quality Spread Differentials and Comparative Returns 2-6-24
BBB vs. BB: Revisiting the Speculative Grade Divide Differentials 2-5-24
Histories: Asset Return Journey from 2016 to 2023 1-21-24
HY vs. IG Excess and Total Returns Across Cycles: The UST Kicker 12-11-23
US Debt % GDP: Raiders of the Lost Treasury 5-29-23
Wild Transition Year: The Chaos of 2007 11-1-22
Greenspan’s Last Hurrah: His Wild Finish Before the Crisis 10-30-22