
Industrial Production June 2024: Is the Sector Rotation Alive?
Industrial Production and Capacity Utilization added some useful notes to the sector rotation theme music.


The sustained recovery music plays on… Will someone kill it in 2025?
We look at June Capacity Utilization trends that show another relatively favorable set of numbers for the month as the debates around the sector rotation see the market voting with more of the value sectors and mature industry groups, bringing some breadth to the market last in evidence on this scale in Dec 2023.
The CPI numbers have lit up the screens and across a widening range of sectors since last week as tech has given way to small caps with its notorious recent history of very brief but sharp rallies.
Industrial production at the headline level rose by an annualized rate of +4.3% with a +0.6% June following a +0.9% MoM rate in May.
Total capacity utilization for all industries ticked higher as did total manufacturing, but durables were mixed on solid motor vehicles and aerospace with lags in fabricated metals and machinery.
Nondurables were higher with the largest line items all higher and one small downtick in the mix (Plastics and Rubber).
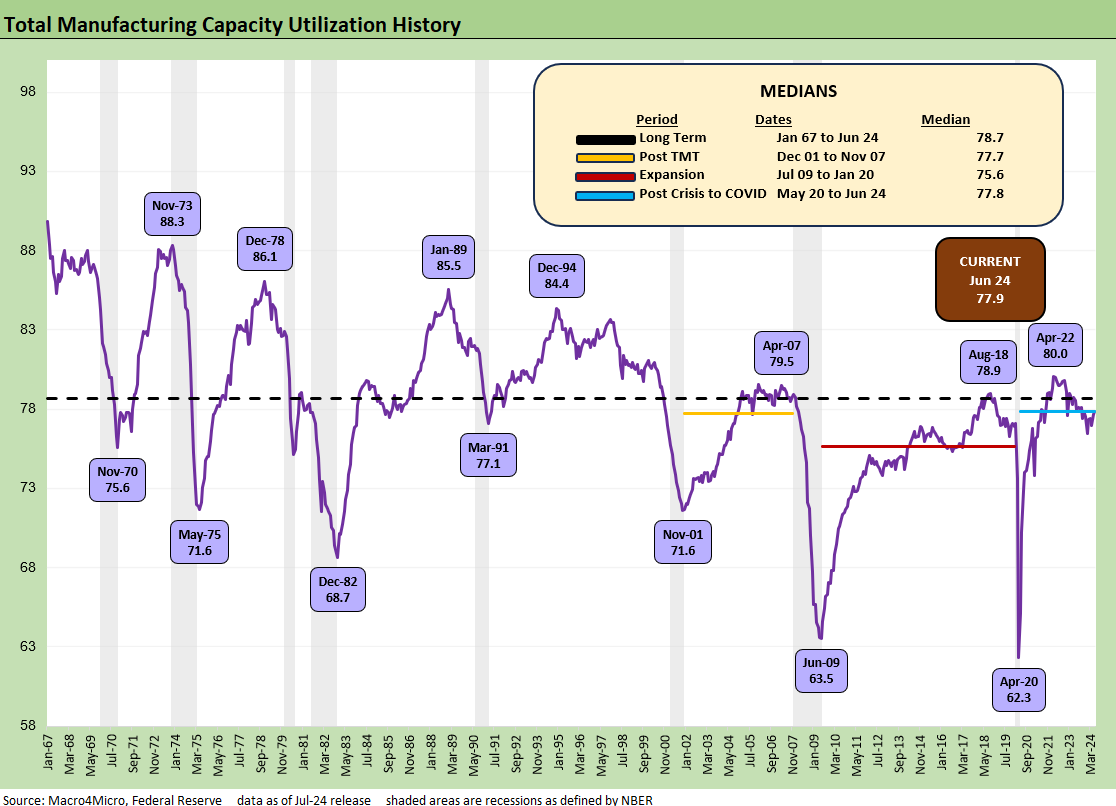
The above chart updates the long-term trend line and medians vs. current capacity utilization rates. We like to use capacity utilization since it fits more easily into the framework of pricing power and industry breakeven volumes. For a given product mix and cost structure, manufacturers have a profit margin framework. Unit cost trends can be driven by variable costs (like manufacturing inputs) or by volumes (the denominator effect of fixed costs spread across a production base).
We have been listening to and reading the rationalizations from the GOP convention interviews and all the “offsets” they see as mitigating risk factors that make an aggressive tariff policy a great plan. All they need is a whiteboard for that to make it work (or a frictionless wheel). They are not the players on the fields though. The manufacturing players are.
If costs rise (think supplier chains facing waves of tariffs), “pricing power vs. earnings dilution” questions come up. (Can you pass it on etc.?). We are still waiting for someone to say “buyer pays” at a podium. Then if some trade partners retaliate and export volumes get hurt for some manufacturers, the ability to reach volumes that bring pricing power or operating leverage face setbacks. Unit cost sensitivity in high fixed cost manufacturing industries is a reality that gets covered by industry analysts. For now, the “tariff man” crowd has the theme music down. The effects on the ground were last seen in 2018-2019. Someone might win but multiple parties will lose for each winner.
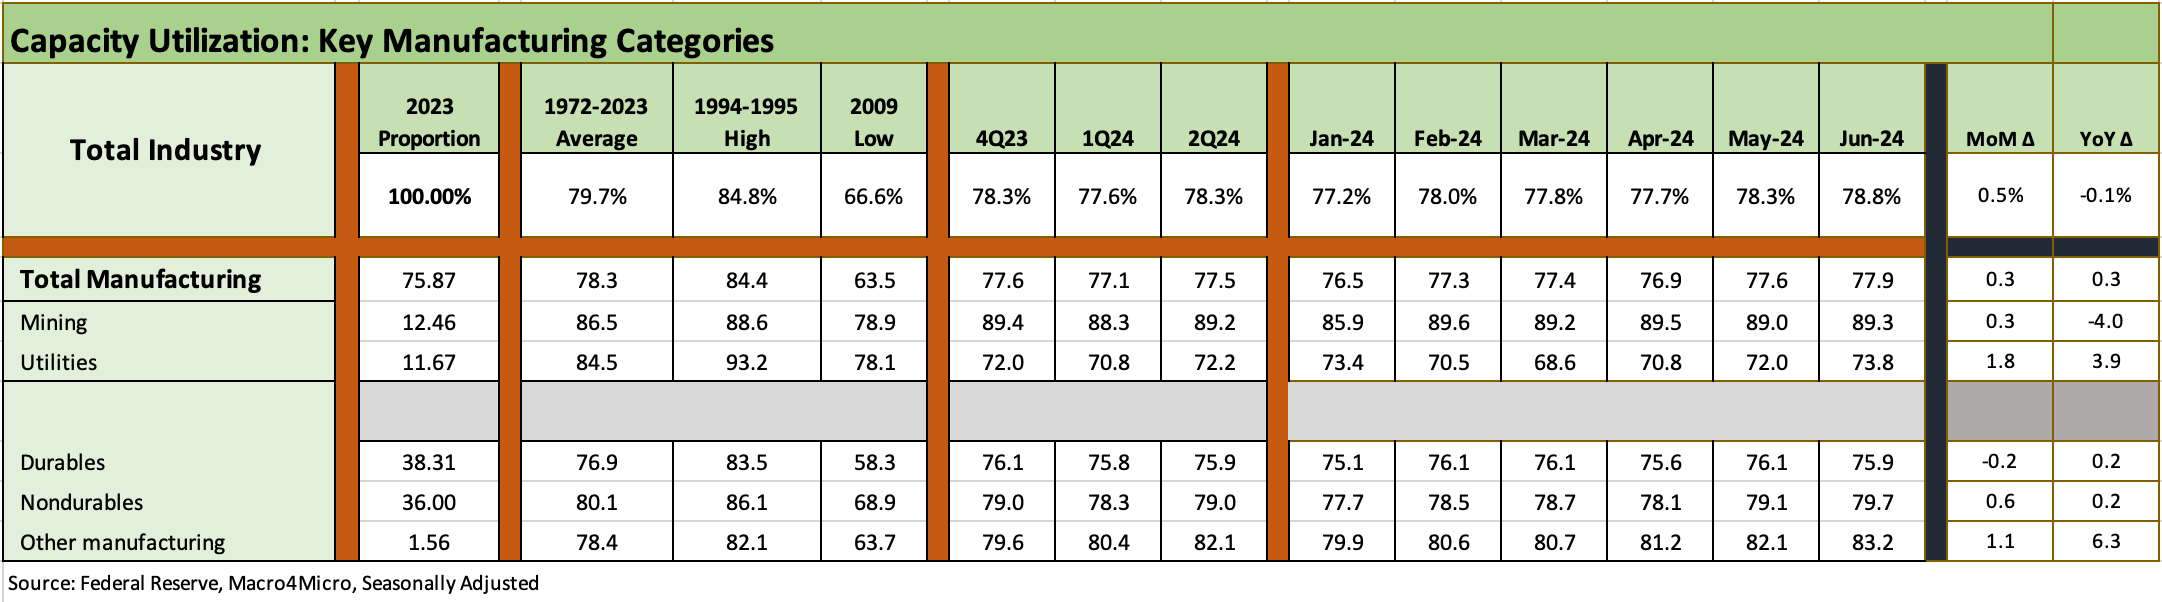
The above chart details the broad categories, and it is hard to argue with “higher beats lower.” The Total Industry line is running below the long-term average, and the same for Total Manufacturing. Durables and Nondurables are also below the long-term average, so this is still not a “manufacturing renaissance” story by any stretch. We also see that underwhelming manufacturing performance in the monthly payroll numbers.
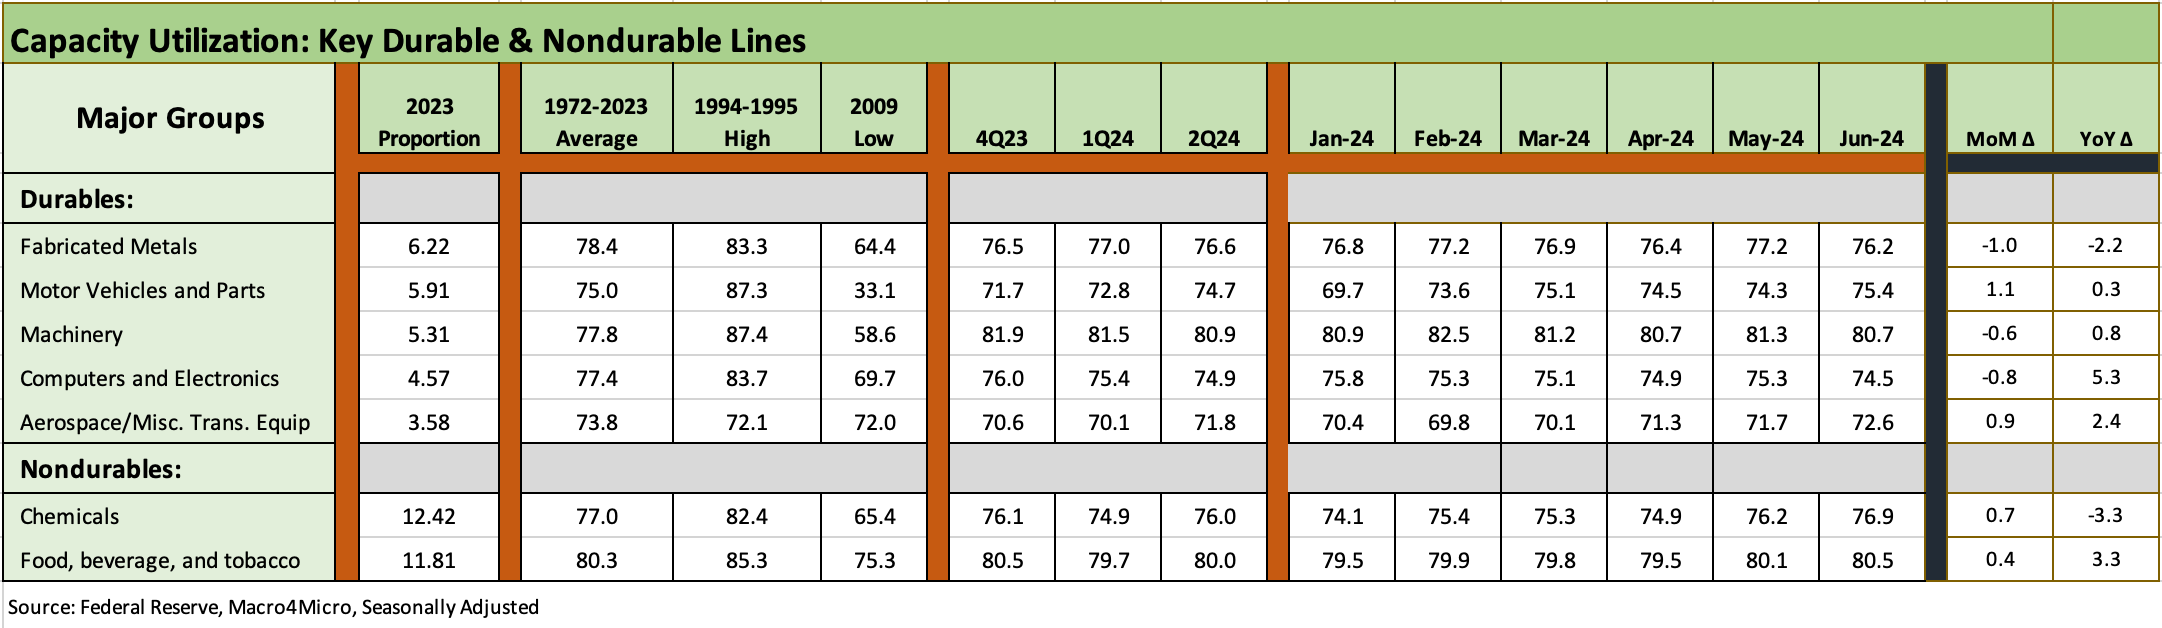
The above chart updates the largest line items in Durables and Nondurables. The Durables lines are mixed with more sequential declines than upticks in this mix. Nondurables performed better, but Durables have a lot more economic multiplier effects just given the nature of supplier chains and end markets.
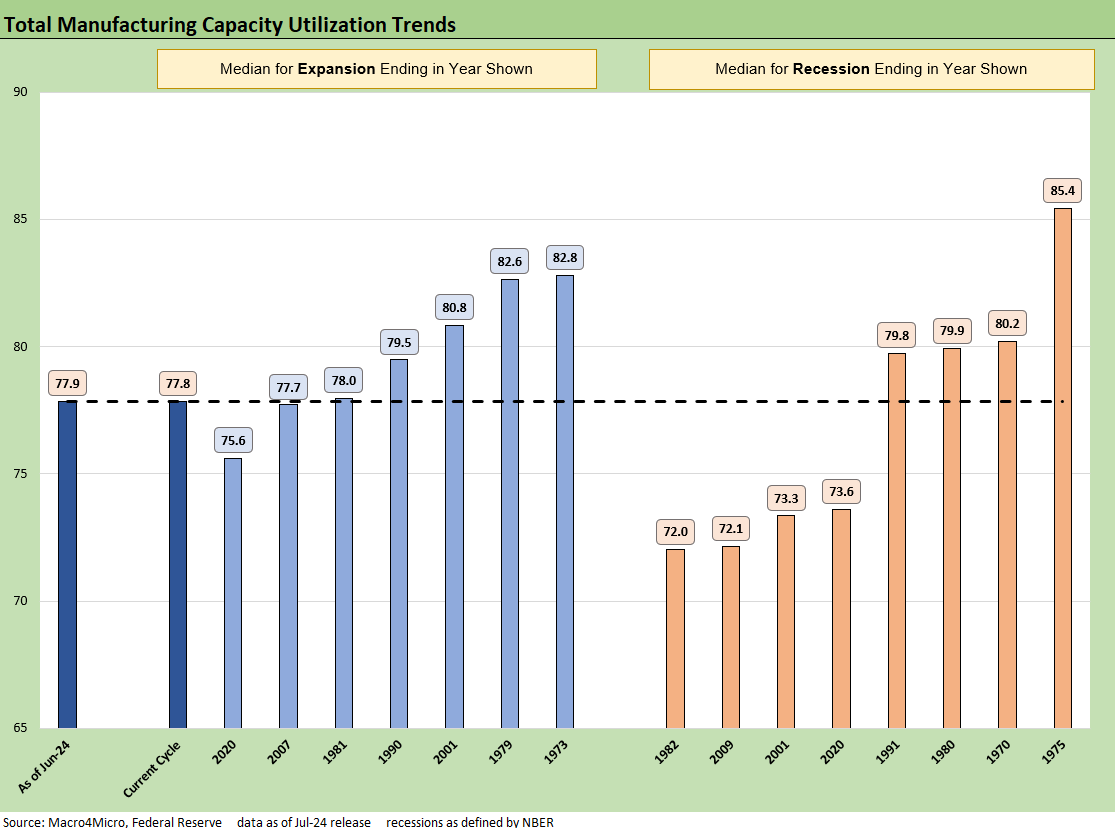
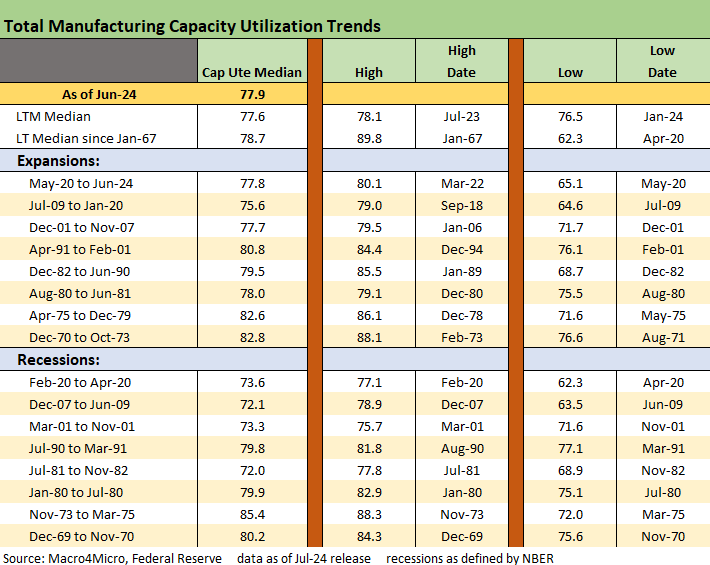
The above chart offers some historical context on where current capacity utilization fits into the cyclical framework of past expansions and recessions. The main takeaway from such historical comparisons is the idea of breakeven volumes and relative margins and where a given cost structure fits into the product mix, pricing structure, and cost base. Recent cap ute levels have been accompanied by materially healthy profitability but often at cap ute levels below past recessions.
The ability to generate higher profitability at lower utilization levels always gets back to how companies structured their operations and supplier chains since the credit crisis or in the face of intensified global competitive pressures. Economically damaging disruptions of those supplier chains will bring winners and losers in the process. We have looked at those topics in past commentaries, and it will remain a hot topic as tariff estimates mount.
The above chart offers a different vantage point with some additional granularity on the expansion and recession timelines.
See also:
Footnotes & Flashbacks: State of Yields 7-14-24
Footnotes & Flashbacks: Asset Returns 7-13-24
Consumer Sentiment: Still Feeling the Heat 7-12-24
Homebuilder Equities: “Morning After” on Rate Optimism 7-12-24
Homebuilders: Equity Performance and Size Rankings 7-11-24
CPI June 2024: Good News is Good News 7-11-24
Footnotes & Flashbacks: Credit Markets 7-8-24
The B vs. CCC Battle: Tough Neighborhood, Rough Players 7-7-24
Payroll June 2024: The Race Gets Confusing 7-5-24
JOLTS May 2024: The Jobs Oasis Still Has Water 7-2-24
Footnotes & Flashbacks: Credit Markets 7-1-24
State Unemployment: A Sum-of-the-Parts BS Detector 6-30-24
The Debate: The China Deficit and Who Pays the Tariff? 6-29-24