
Footnotes & Flashbacks: Asset Returns 7-13-24
We look back at the week’s return profiles after CPI unleashed some pent-up expectations turbocharged by good inflation news.


Budget worries, tariff haters, geopolitical anxiety, and inflation hawks are not flying away yet…
Despite some mixed signals in the first round of major bank earnings and some lingering concerns around the consumer sector fading, the CPI news ignited a rebound in interest-sensitive industries and set off more discussions of sector rotation strategies.
The homebuilders clawed back most of the recent 2Q24 losses, climbing back up the rankings while regional banks saw another one of its periodic rounds of relief rallies.
The long-suffering Small Caps posted price action not seen since the Nov-Dec 2023 Russell 2000 rebound while Midcaps also joined the party in the “sell tech, buy the out of favor” recommendations.
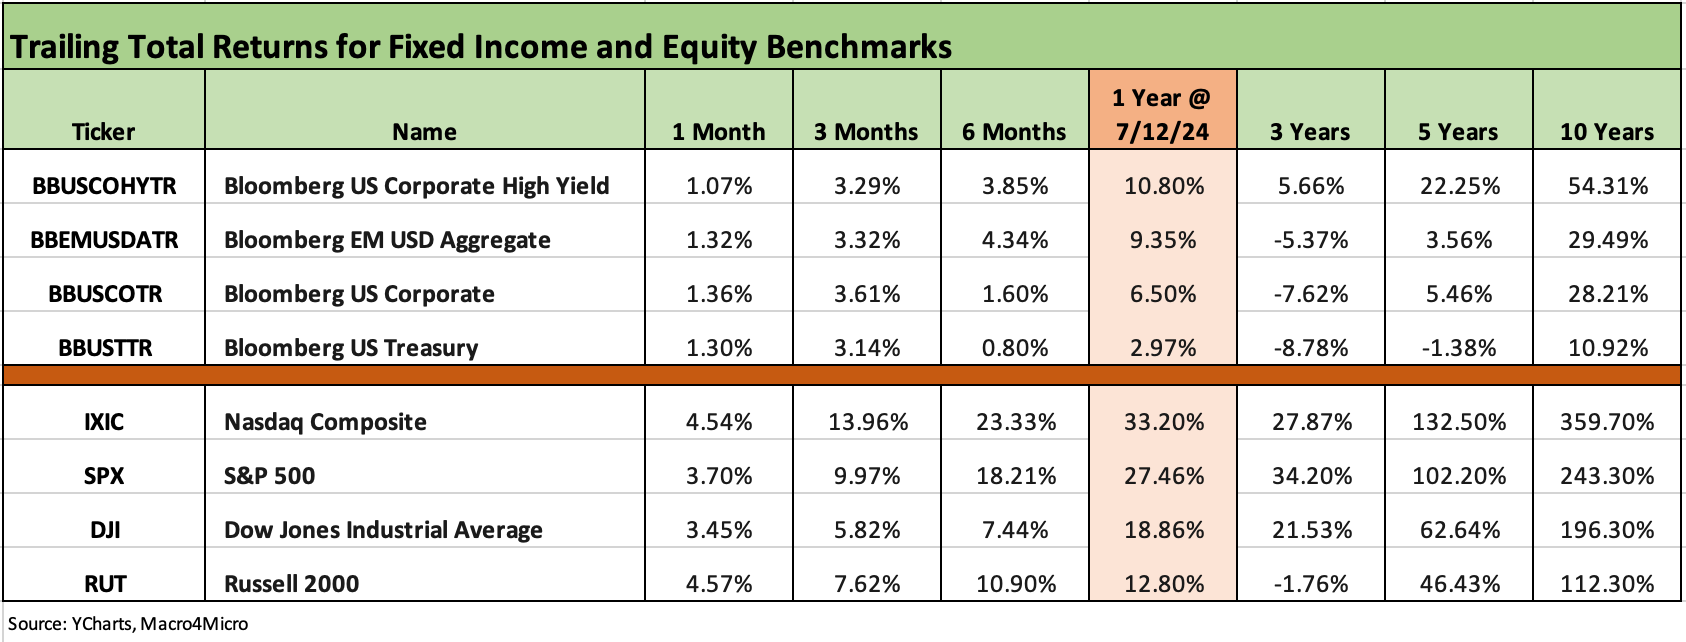
The above chart updates the rolling return time horizons for the main debt and equity benchmarks we watch. The good news for this week is that the lagging US-centric Small Caps rallied back into the positive range for 1-month and 3-months periods. The Russell 2000 sent the above 1-month, 3-month and 6-month columns into all-positive again even if UST is barely in the black over 6 months. All the major stock benchmarks were positive for the week despite some negative hits in tech and negative returns for 5 of the Mag 7.
As we cover in our separate Footnotes publication on State of Yields (to be published later), the YTD rise in rates that unfolded after the Nov-Dec rally is getting chipped away on the back of better inflation numbers and a mix of macro releases that signal a softer consumer. The curve is still setting records for inversion endurance, and the waiting game continues on the Fed’s next move as the 1-year anniversary of the last hike action approaches.
The guidance coming out of the banks was mixed on the first round of mega bank releases so far, and the expectation of improved net interest margins is more about hope on future FOMC action than the reality of run rates. Provisioning trends are not sending favorable input from what we have seen so far, but next week holds a lot more news across a broader range of banks and financials.
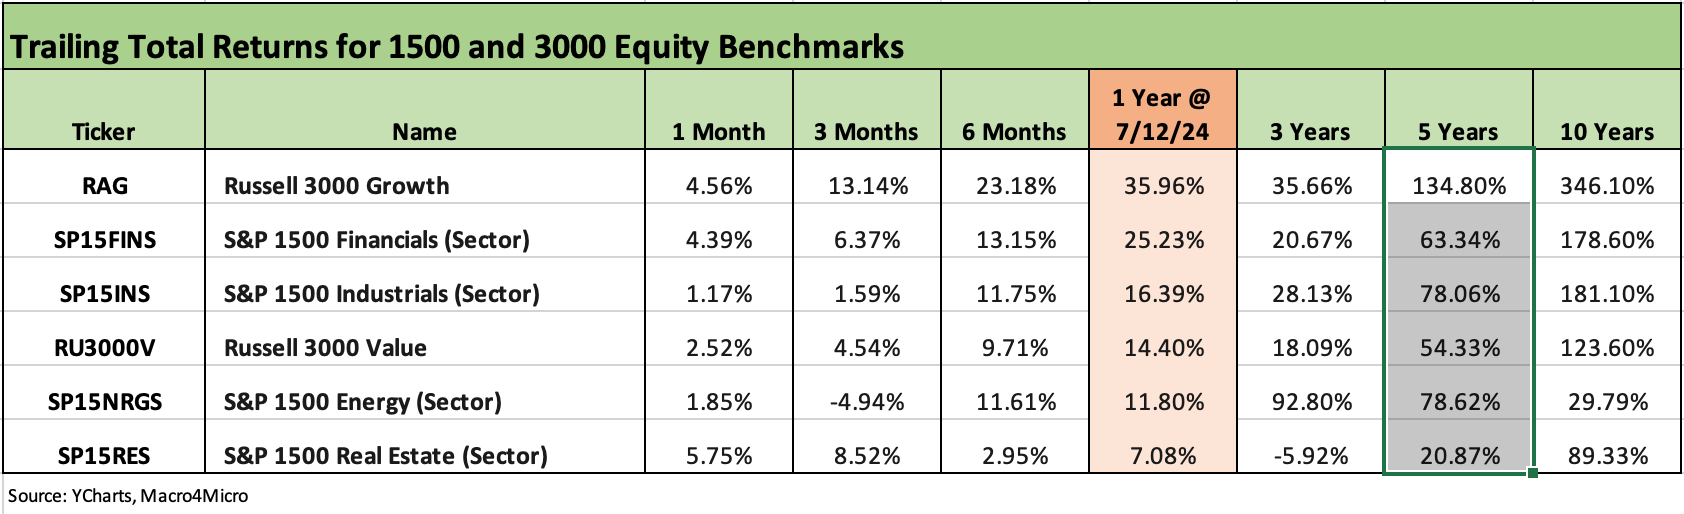
The above chart updates the 1500 and 3000 series, and there is plenty of strength in the rolling 1-month numbers. Last week’s rolling 1-month saw Industrials and Value both in negative range and the same for 3-months in both. For this week’s update, both the 1-month and 3-months for Industrials and Value are positive. The Energy line remains negative over 3-months, but that has been whittled down.
The rolling return visual
In the next section we get into the details of the 32 ETFs and benchmarks for trailing periods. Below we offer a condensed 4-chart view for an easy visual before we break out each time period in the commentary further below. This is a useful exercise we do each week looking for signals across industry groups and asset classes.
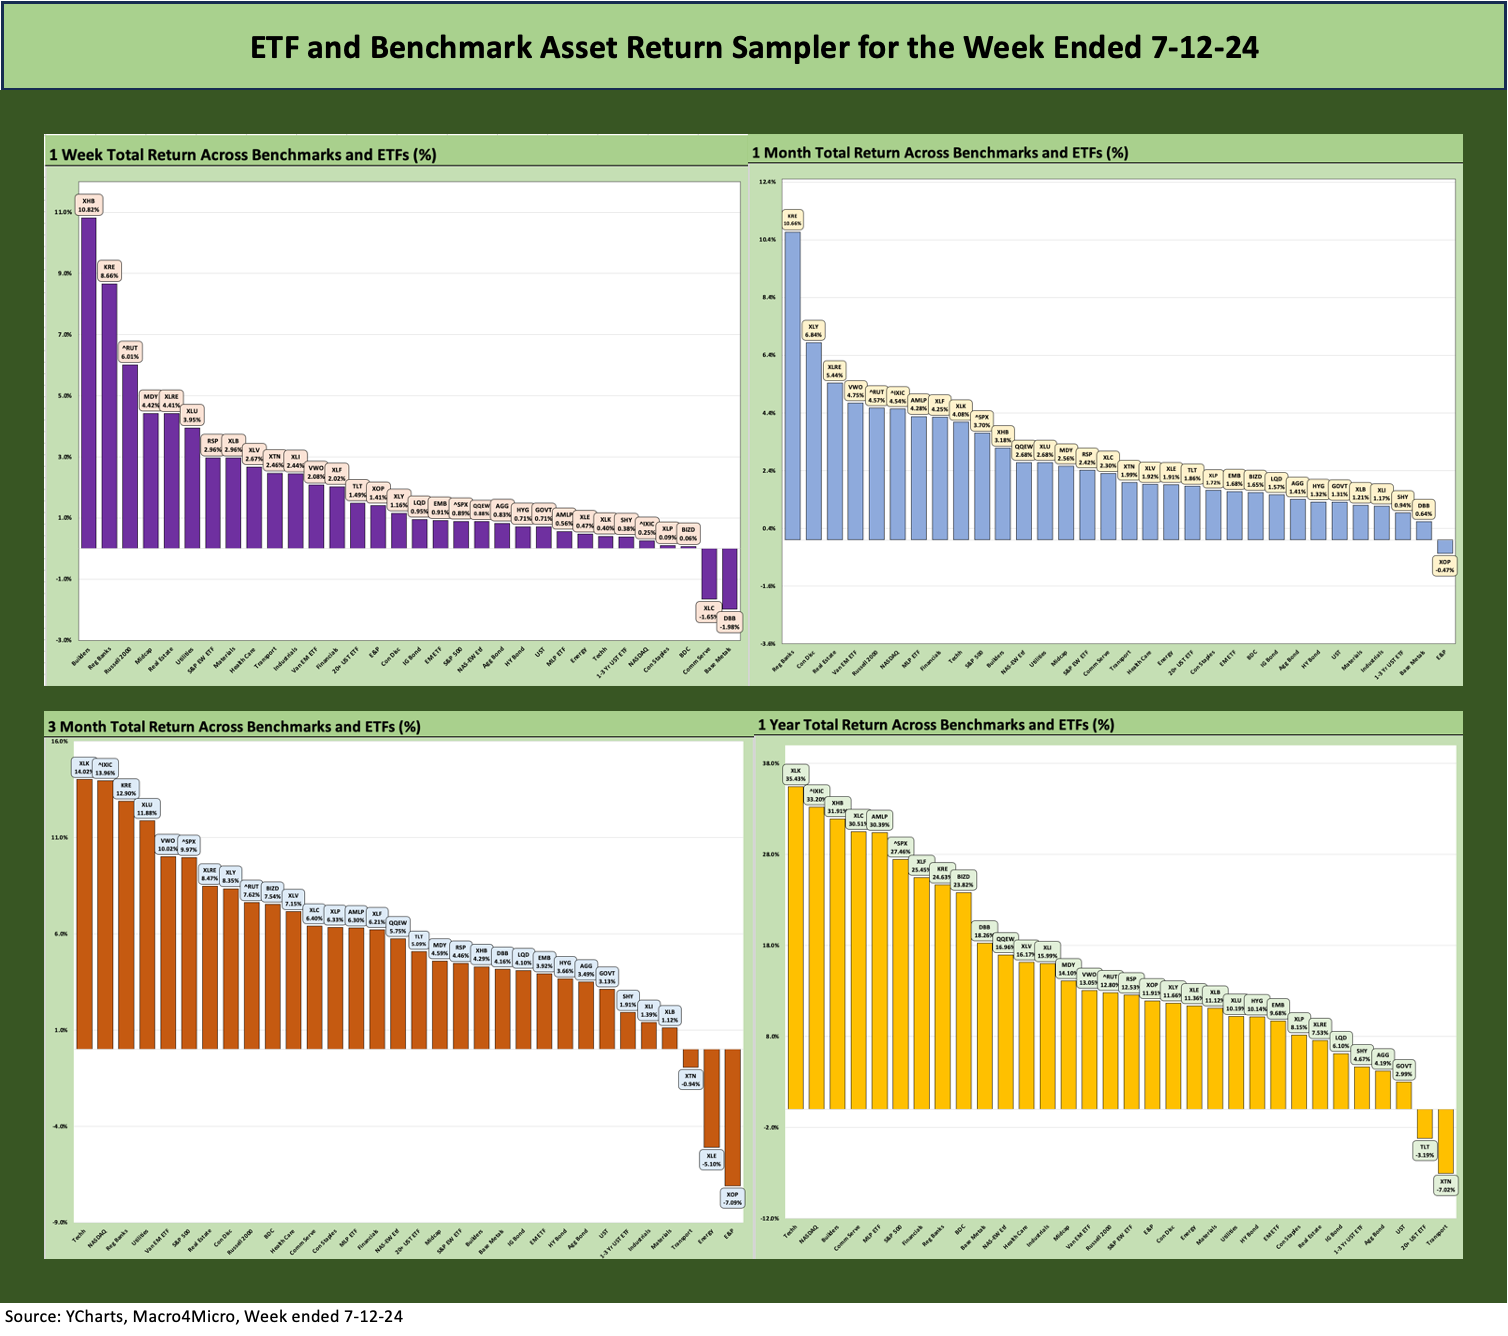
The above chart shows a material shift towards the positive side of the balance in 1-week, 1-month, and 3-months while the LTM remains in a 30-2 score in favor of positive. For 3-months, the “red” side of the ledger is two Energy ETFs with E&P (XOP) on the bottom and the broad Energy ETF (XLE) in second to last and Transports (XTN) rounding out the negative returns. For LTM, the lonely two in negative range include Transport again (XTN) and the long duration UST 20+Y ETF (TLT) struggling to get back into the black after the favorable UST moves this past week.
The Magnificent 7 heavy ETFs…
Some of the benchmarks and industry ETFs we include have issuer concentration elements that leave them wagged by a few names. When looking across some of the bellwether industry and subsector ETFs in the rankings, it is good to keep in mind which narrow ETFs (vs. broad market benchmarks) get wagged more by the “Magnificent 7” including Consumer Discretionary (XLY) with Amazon and Tesla, Tech (XLK) with Microsoft, Apple, and NVIDIA, and Communications Services (XLC) with Alphabet and Meta.
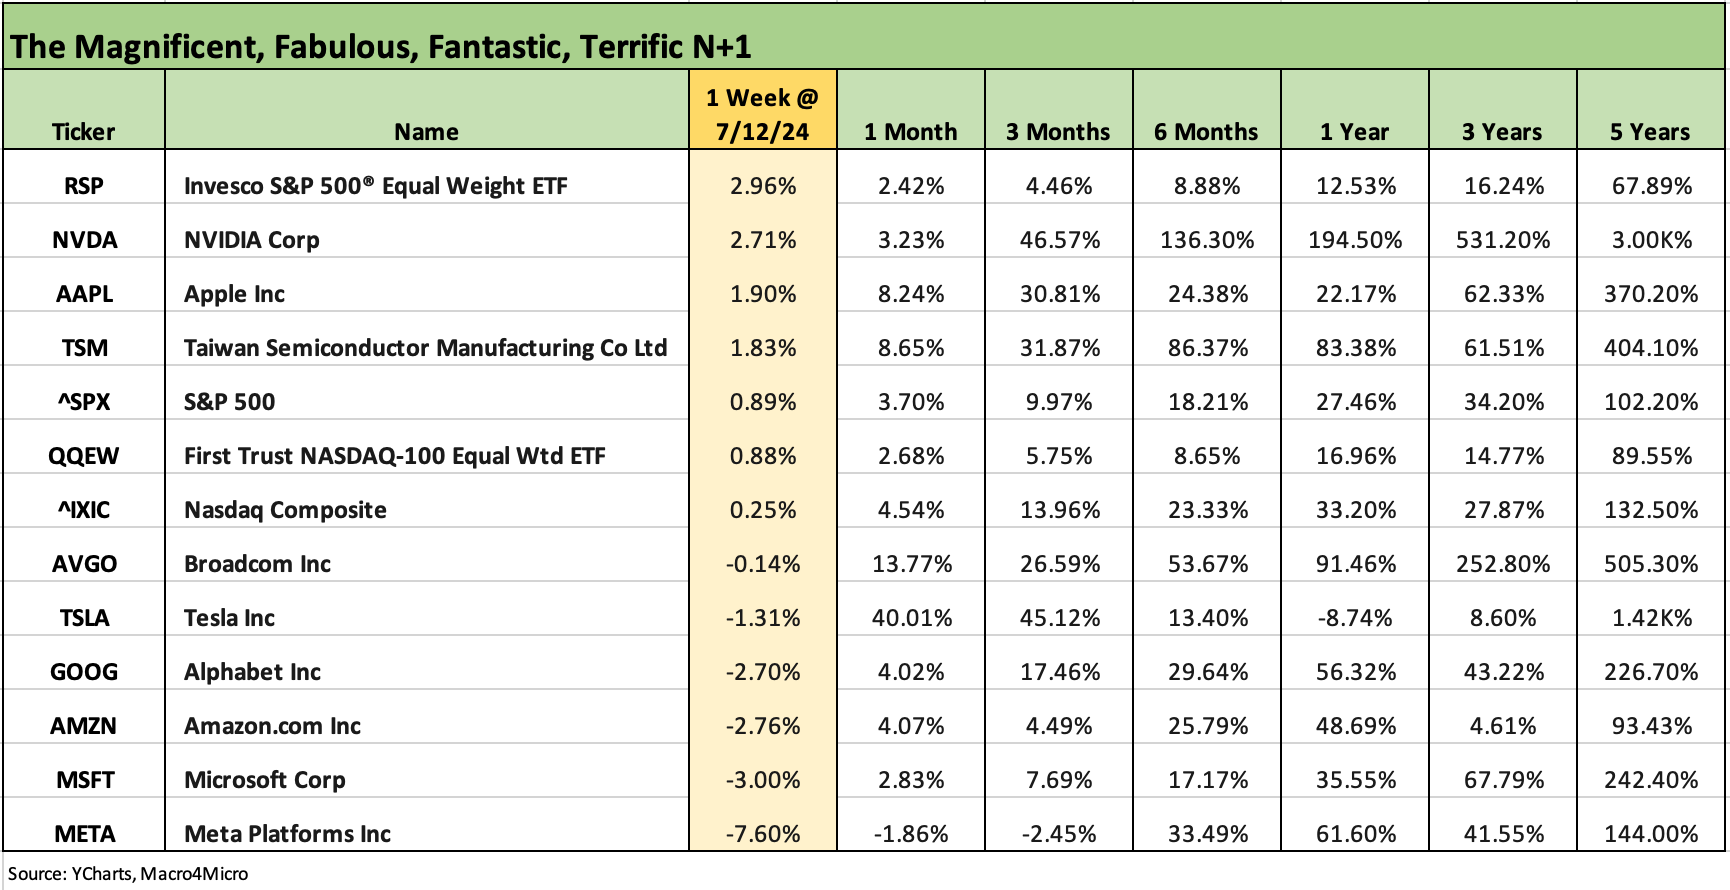
The above chart shows some Mag 7 pain that drove the Equal Weight S&P 500 to #1 in this mix with a weekly return comfortably ahead of the broad market S&P 500 benchmark. We see 5 of the Mag 7 in negative range on the week with only Apple and NVIDIA in positive territory.
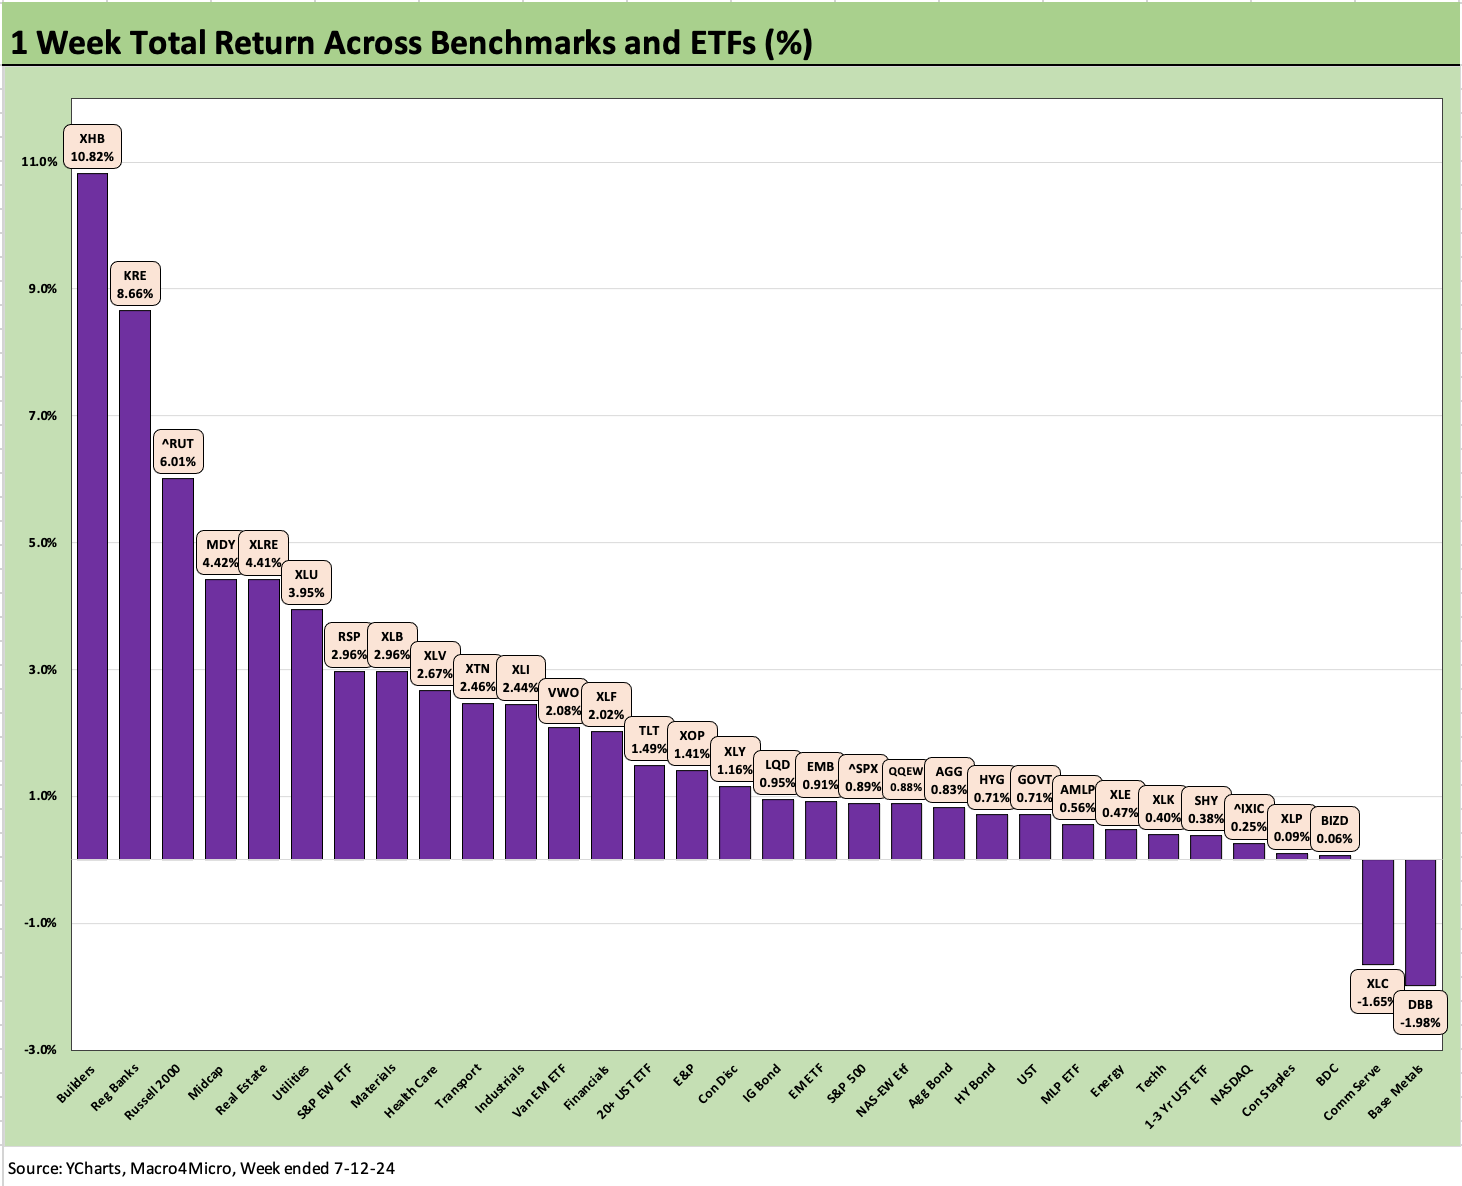
The 1-week returns underscore the rebound of the Homebuilder sector during the week with the Homebuilder ETF (XHB) well ahead of the pack at +10.8%. Thursday was a wild day for price action after a very rough stretch for the builders (see Homebuilders: Equity Performance and Size Rankings 7-11-24, Homebuilder Equities: “Morning After” on Rate Optimism 7-12-24). The sell-off during 2Q24 was easy enough to justify on the stubborn mortgage rates and some tangible signs of consumer sector pressures rising.
The transmission mechanism from an FOMC cut (or two) in the fall to a lower 10Y UST and big savings in 30Y fixed rate mortgages is not as easy as might be assumed given a steep inversion and massive deficits and soaring interest costs to fund. There is no question the CPI news was a major positive with a deflation number printed MoM at -0.1% and a lot of favorable numbers in the mix (see CPI June 2024: Good News is Good News 7-11-24).
We also see the easing theme and rate bullishness giving some life to the Regional Banks (KRE) and Real Estate equities (XLRE) during the week. For regionals, a few fed funds cuts are not going to miraculously make select commercial real estate exposures more valuable nor would it suddenly cure tenant risks if the UST cut bullishness gets swept up in recession scenarios.
On the rate rally and commercial real estate exposures, having Trump at the helm with his ambitions to subjugate Fed policy making to the White House would at least put a good friend of commercial real estate at the helm. Lowering rate materially by coercion while bringing a deluge of tariffs to the macro picture are topics we have touched upon in the past, but the dollar bears would come out of hibernation, and the inflation hawks would start clawing at bond investors’ eyes. A combination of lower rates and steep tariffs would bring some highly uncertain chemistry.
Sitting on the bottom for the week was Base Metals (DBB) and the Communications Services ETF (XLC) as Meta and Alphabet took it on the chin. All the bond ETFs were positive for the week with the long duration UST (TLT) making it up into the second quartile. The short duration UST 1Y to 3Y ETF (SHY) was positive but in the bottom quartile while the remaining bond ETFs were in the third quartile, in descending order of returns across LQD, EMB, AGG, HYG, and GOVT.
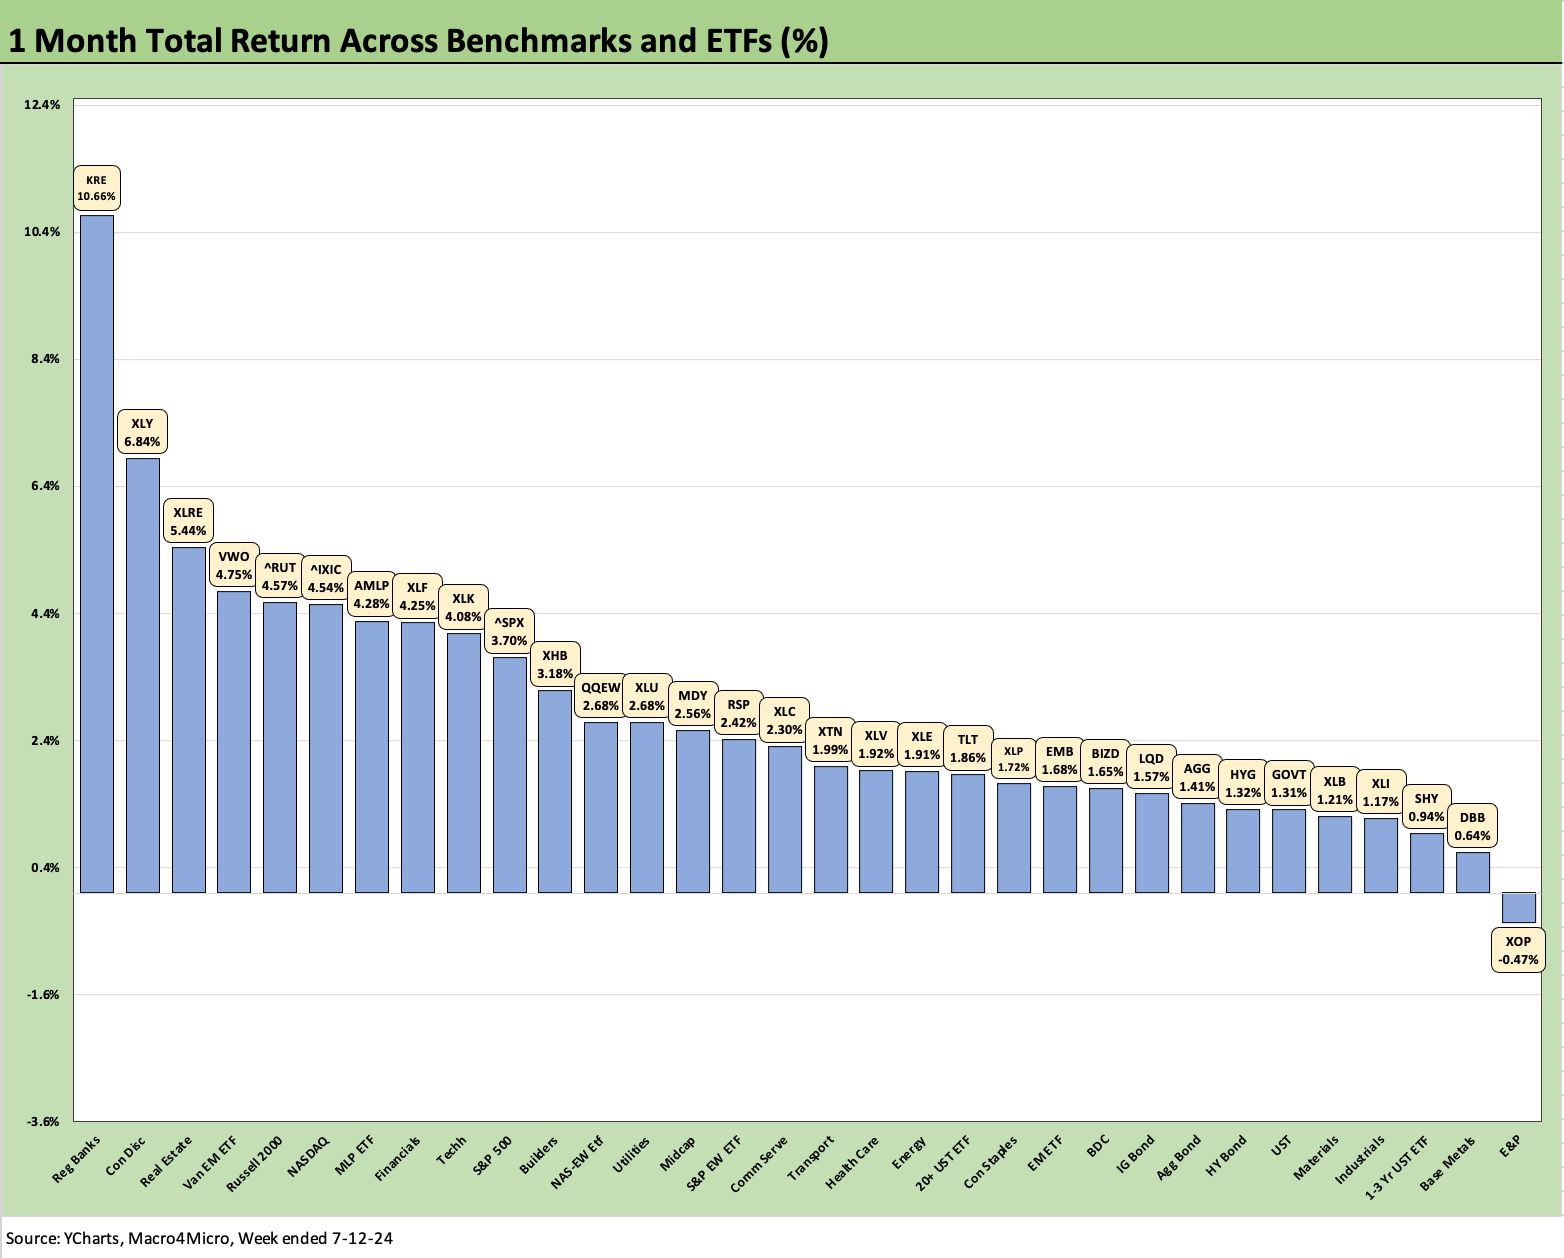
The rolling 1-month results are easy enough to frame visually at 31-1 and only the E&P ETF (XOP) in negative range. The top quartile is a diverse group while the low end showed a mix of bond ETFs and a few equity laggards. With so many equity lines rallying, bonds were down the leaderboard. We see 4 of the bond ETFs positive but in the bottom quartile in ascending order of SHY, GOVT, HYG, and AGG. We see the other 3 bond ETFs in the third quartile across LQD, EMB, and TLT.
The biggest winner on the 1-month at #1 was the Regional Bank ETF (KRE) at +10.7%. The broad Financials ETF was at the bottom of the top quartile for the 1-month period. KRE has risen into the top 3 for the rolling 3-months and for the LTM stretch has moved up to the low end of the top quartile. KRE has generated a very strong comeback in the face of some very ugly headlines and gloomy “asset shock” predictions in the market. Those regional earnings reports are anxiously awaited.
We see Small Caps Russell 2000 (RUT) rallying and moving into the top 5 for the 1-month period with Midcaps further down in the bottom of the second quartile. The leaders include Consumer Discretionary (XLY) with Tesla’s recent pyrotechnics. We also see EM Equities (VWO) and NASDAQ in the leader group.
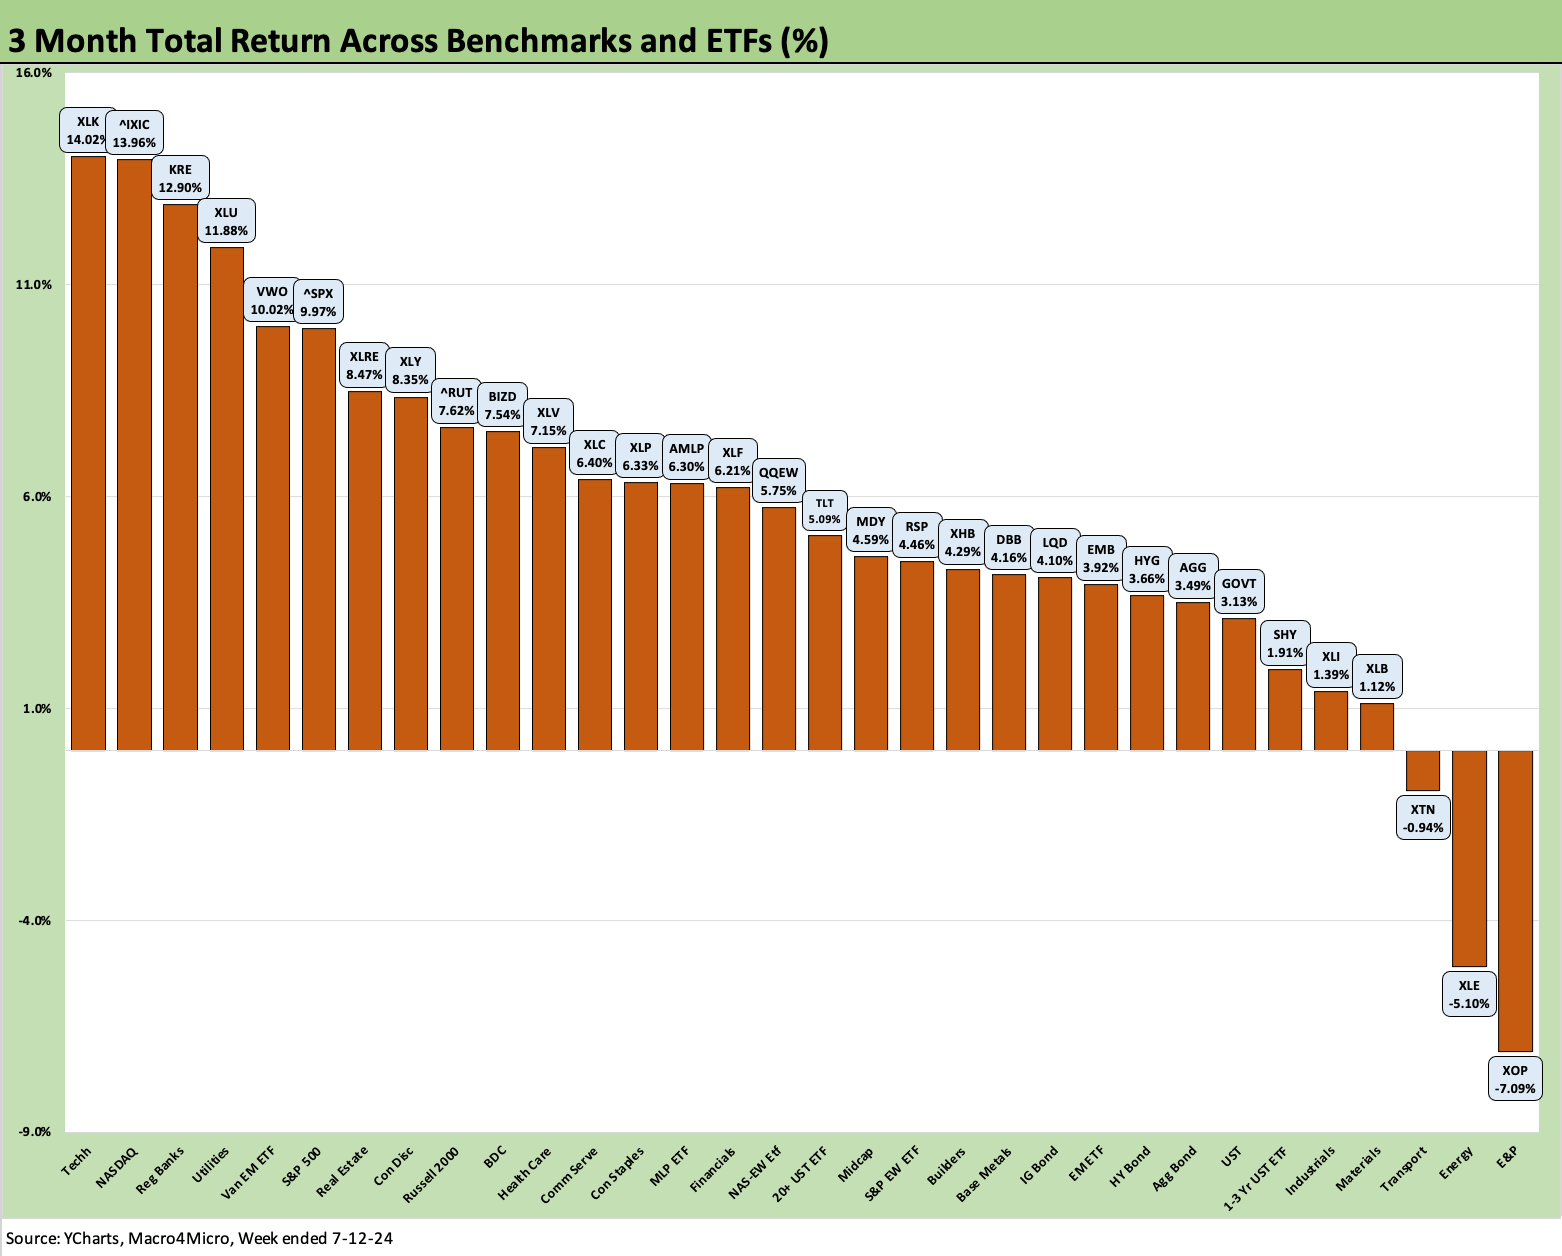
The 3-month returns show the scoresheet at 29-3 with two energy ETFs (XOP, XLE) in the red with Transports (XTN). The top quartile is still heavy on the tech side of the mix and the benchmarks/ETFs with outsized Mag 7 influence (NASDAQ, S&P 500, XLK, XLY). The UST curve has lent support to Utilities (XLU) and Real Estate (XLRE) while EM Equities (VWO) has been in the mix. The top 5 asset lines over 3-months all posted double-digit returns with the S&P 500 at #6 rounding up to 10%.
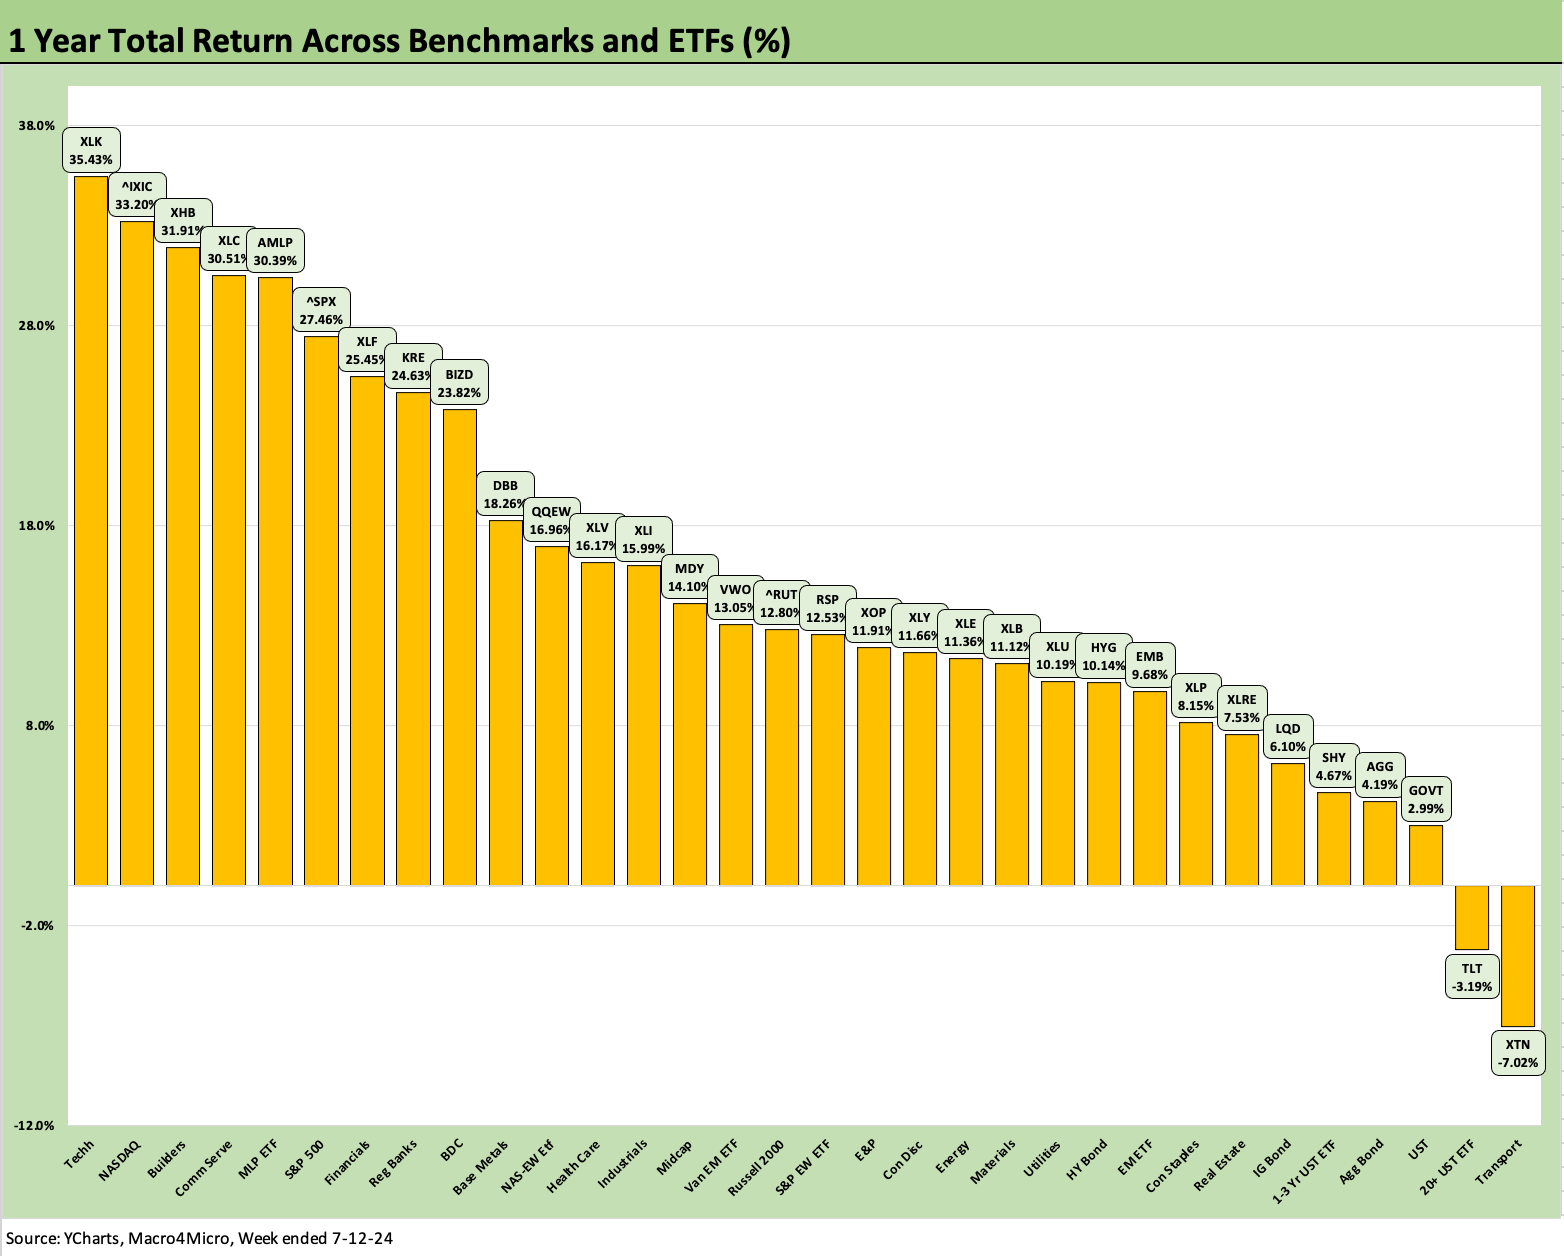
The LTM return score keeps seeing 30-2 with this week showing only the long duration UST (TLT) and Transports (XTN) still in the red. We see 23 of the 32 benchmarks and ETFs in double digit return range. We see 5 above 30% and 9 above 20% for this LTM time horizon.
The top of the list includes Tech (XLK) at #1, NASDAQ (IXIC) at #2, and Homebuilders (XHB) at #3 as builder constituents in XHB just fought their way back into the top tier with a banner week after dropping out of the running LTM top quartile last week.
The bottom of the top quartile includes the broad Financials ETF (XLF) and Regional Banks (KRE), and they will get a lot of focus in earnings reports this week around net interest margin expectations and provisioning trends. The asset quality concentration risks of the regionals always leave investors locked in for hints of trouble.
This past Friday was the big bank kickoff, but this week brings the remainder of the banking giants (BAC, GS, MS) along with some key major regionals (PNC, USB) and consumer banks (DFS, SYF). On Friday, Wells Fargo took a notable beating at -6.0% on the day. Wells had issued ugly guidance in new interest margin trends and scaled back in outlook.
As more banks report, there is still a bit of mystery in the process of figuring out lower funding costs vs. lower asset income and how that dovetails with quality trends, provisioning needs (and adequacy), and loan demand among other factors. Bank analysts do not have an easy job.
Looking back at the bond ETF returns across the LTM period, we see only TLT in the red but 5 of the 7 bond ETFs in the bottom quartile (TLT, GOVT, AGG, SHY, LQD) with EM Sovereigns (EMB) and HY (HYG) in the lower end of the third quartile.
See also:
Consumer Sentiment: Still Feeling the Heat 7-12-24
Homebuilder Equities: “Morning After” on Rate Optimism 7-12-24
Homebuilders: Equity Performance and Size Rankings 7-11-24
CPI June 2024: Good News is Good News 7-11-24
Credit Crib Note: KB Home 7-9-24
Footnotes & Flashbacks: Credit Markets 7-8-24
Footnotes & Flashbacks: State of Yields 7-7-24
Footnotes & Flashbacks: Asset Returns 7-7-24
The B vs. CCC Battle: Tough Neighborhood, Rough Players 7-7-24
Payroll June 2024: The Race Gets Confusing 7-5-24
JOLTS May 2024: The Jobs Oasis Still Has Water 7-2-24
Footnotes & Flashbacks: Credit Markets 7-1-24
State Unemployment: A Sum-of-the-Parts BS Detector 6-30-24
The Debate: The China Deficit and Who Pays the Tariff? 6-29-24
PCE, Income and Outlays: Practicing Safe Growth? 6-28-24
Trade Flows: More Clarity Needed to Handicap Major Trade Risks 6-12-24
Miscellaneous histories:
Systemic Corporate and Consumer Debt Metrics: Z.1 Update 4-22-24
Credit Markets Across the Decades 4-8-24
Credit Cycles: Historical Lightning Round 4-8-24
Histories: Asset Return Journey from 2016 to 2023 1-21-24
Credit Performance: Excess Return Differentials in 2023 1-1-24
HY vs. IG Excess and Total Returns Across Cycles: The UST Kicker 12-11-23
Inflation Timelines: Cyclical Histories, Key CPI Buckets 11-20-23