
Footnotes & Flashbacks: Credit Markets 7-8-24
We look at a slice of credit market valuation trends as everyone gears up for 2Q24 earnings season and another round of CPI and PPI.


Ticking tariffs…
We drilled down into the CCC tier profile in a detailed commentary posted on Sunday (see The B vs. CCC Battle: Tough Neighborhood, Rough Players 7-7-24), but we move up the spectrum to look more closely at the IG vs. HY relationship in this week’s Footnotes.
The BBB vs. BB tier YTD excess returns are almost in a dead heat as we enter a period where the range of potential policy outcomes remains very wide in terms of how they would flow both into macro risks and micro-level industry effects (many negative).
The compression of some important differentials such as HY-IG have eased somewhat the past week, but BB-BBB OAS differentials remain down near post-COVID lows even if well above the Dec 2019 lows.
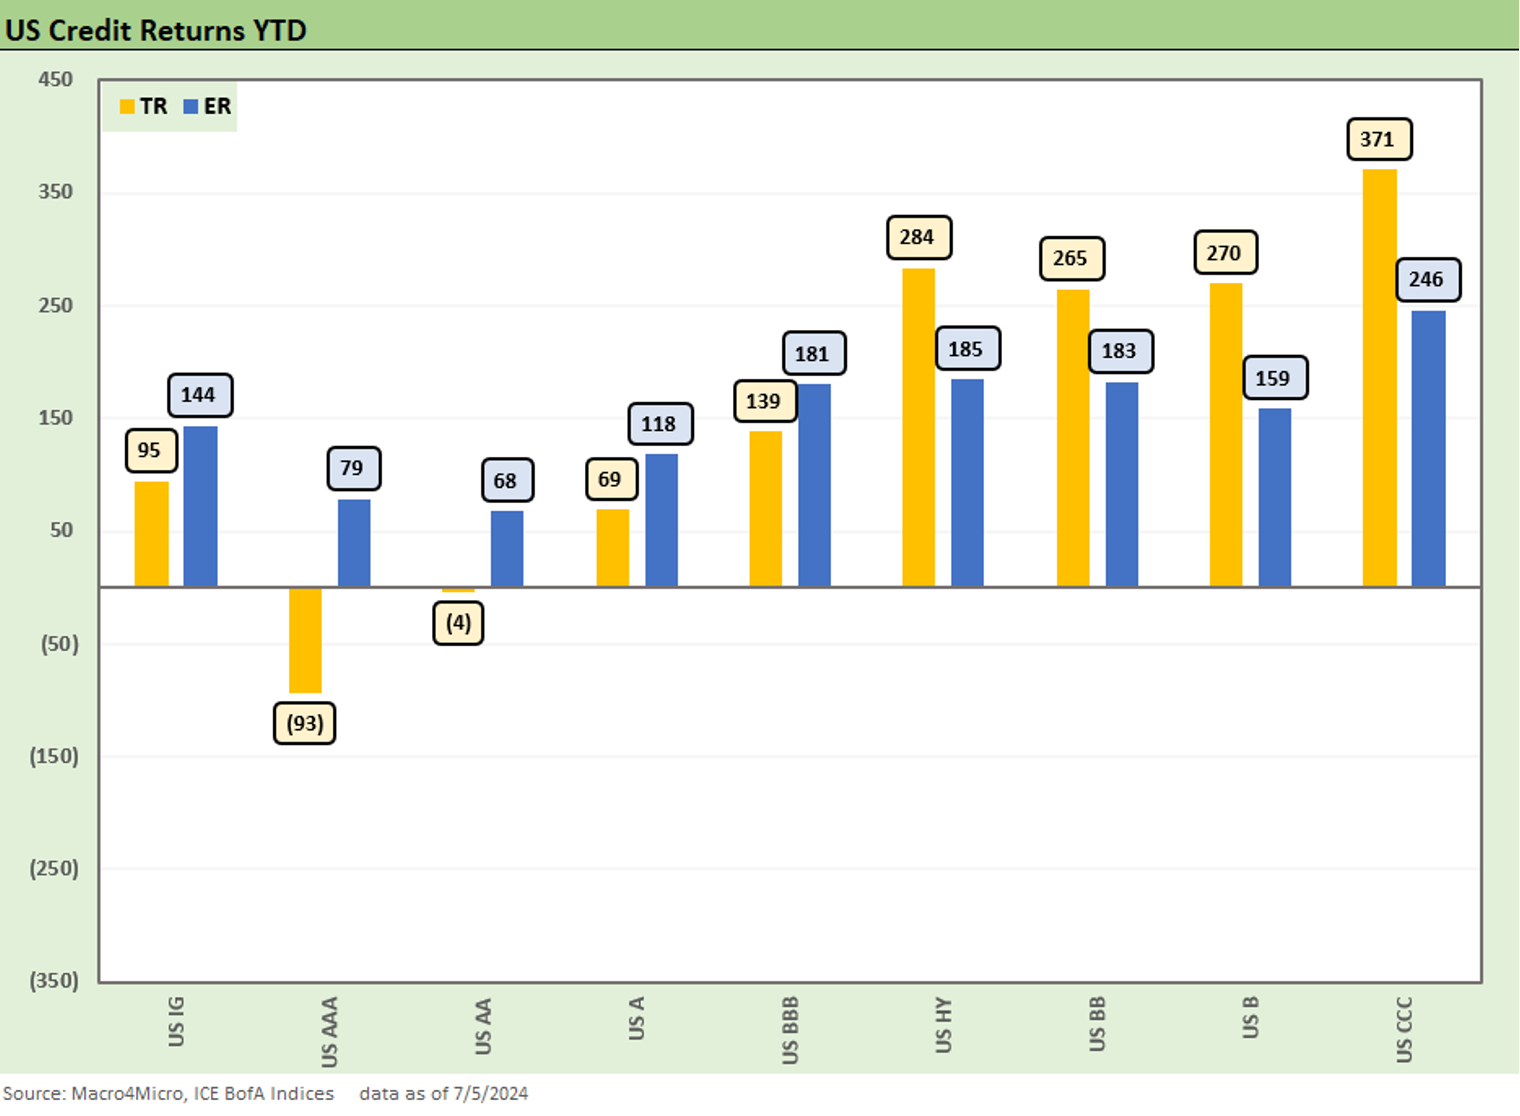
The above chart lines up the credit tiers from AAA to CCC from left to right. For each credit tier we detail the YTD total returns (yellow bar on the left) and YTD excess returns (blue bar on the right). The negative impact of the UST shift is apparent enough in the weak IG Corp returns with sub-1% IG benchmark total returns and negative total returns in the long duration AAA index to slightly negative in the AA tier.
The excess returns are positive but the “line up by height” approach would show the B tier excess returns are disappointing vs. BB and the BBB vs. BB tier comparison not showing much incremental compensation for moving down into the BB tier from BBBs.
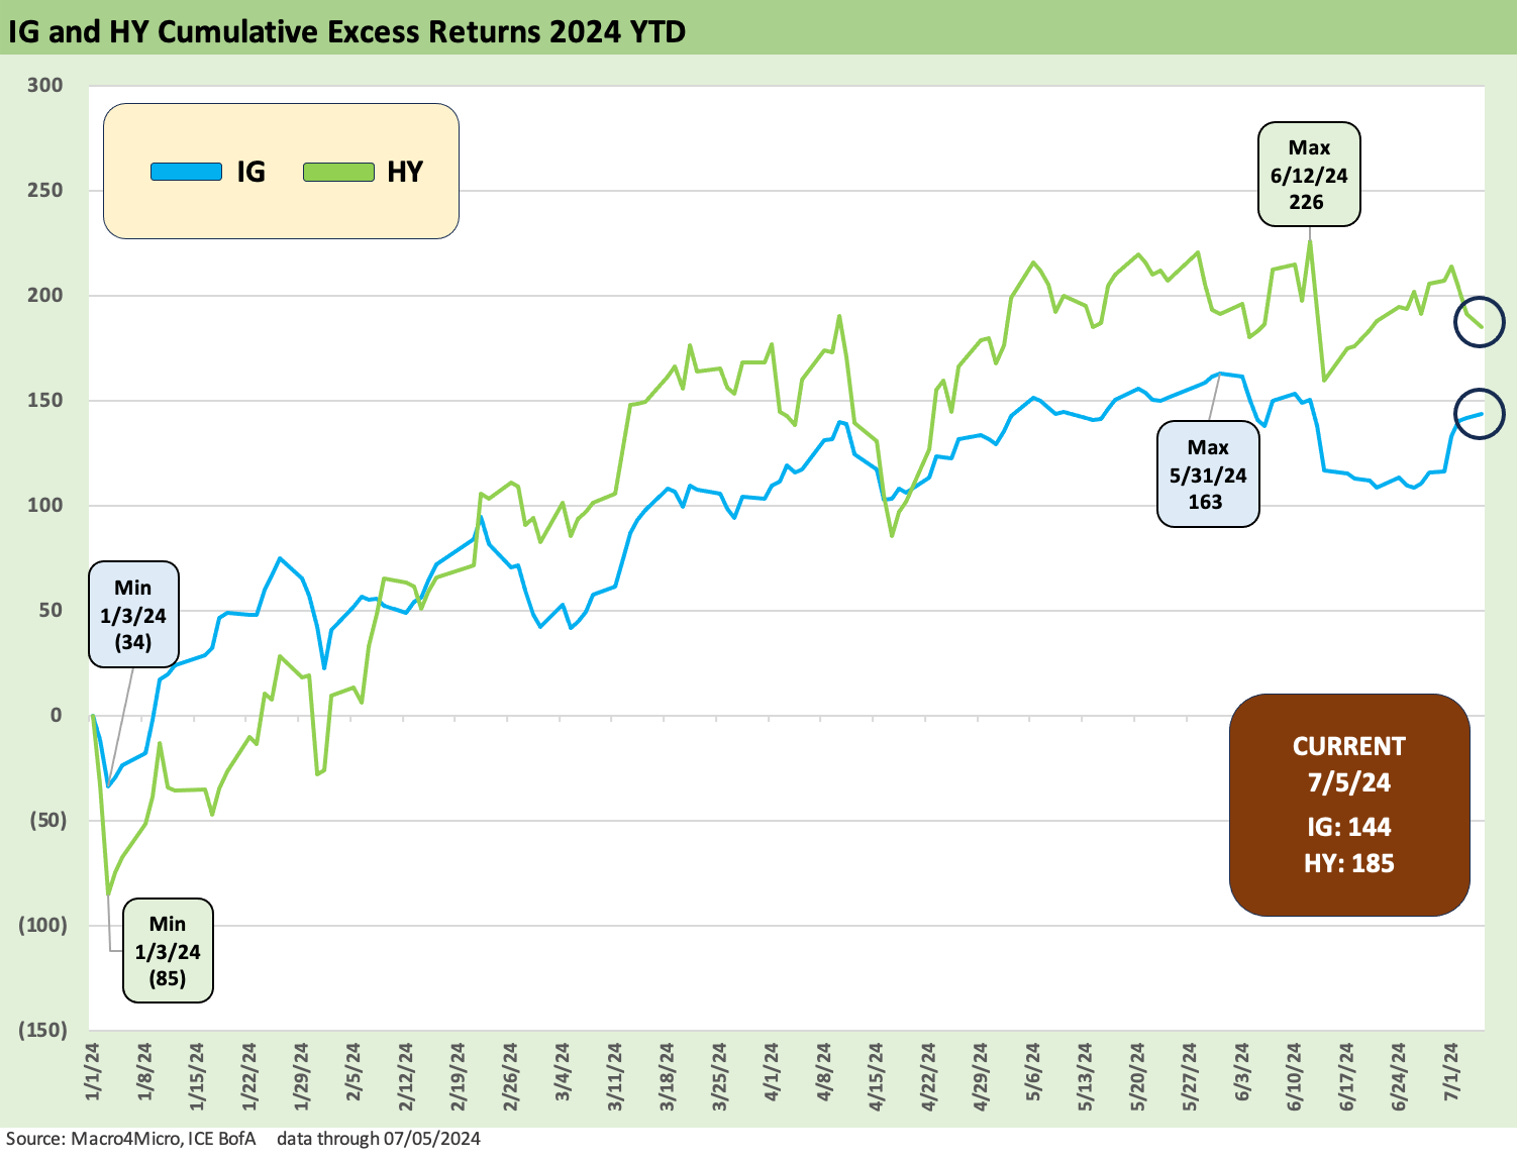
The above chart plots the running excess return differentials of IG vs. HY, and the compression is evident in the modest additional return delivered by a HY index with high single B par-weighted credit quality vs. the low single A par-weighted IG index. Credit risk has been winning in 2024, but risk handicapping gets tricky from here. We should get some good color from the major banks to end this week and into next. The trick is the wide gap in policy risk that comes later.
The question is whether “the excess return is enough” as we head into what will be a very tumultuous and toxic election that will only be more emotionally polluted by Inauguration Day (no matter who wins). After all, the debt ceiling deal will be over in Jan 2025, and the crazies will be loose. We just don’t know how many and the relative numbers yet. After the Supreme Court decision, the hard left will be angrier than ever and the hard right extremist wing will be steady state nuts as usual.
The policy agenda we discuss regularly in other commentaries will not play out in gentle fashion without more headlines (see Payroll June 2024: The Race Gets Confusing 7-5-24 for some background on what Project 2025 is looking to do with financial data from the government). Our main worry is trade wars from an economic and market standpoint although there is a lot more than that narrow (if potentially very harmful) policy area.
Our view is the market is not paying investors enough to take HY risk these days given the basket of uncertainties and wide range of scenarios. Investment time horizons are usually longer and asset class constraints a reality of the business, so the defensive and upper tiers of HY are much more resilient and the refi and extension timelines ahead will bring a good dose of favorable re-couponing of HY bonds that will be attractive to lock in. The potential for volatility in UST rates and monetary policy make for a 4D mix of variables (remember Trump wants to subjugate the Fed to his controlled appointees in Treasury). The scenarios you can spin make your head hurt.
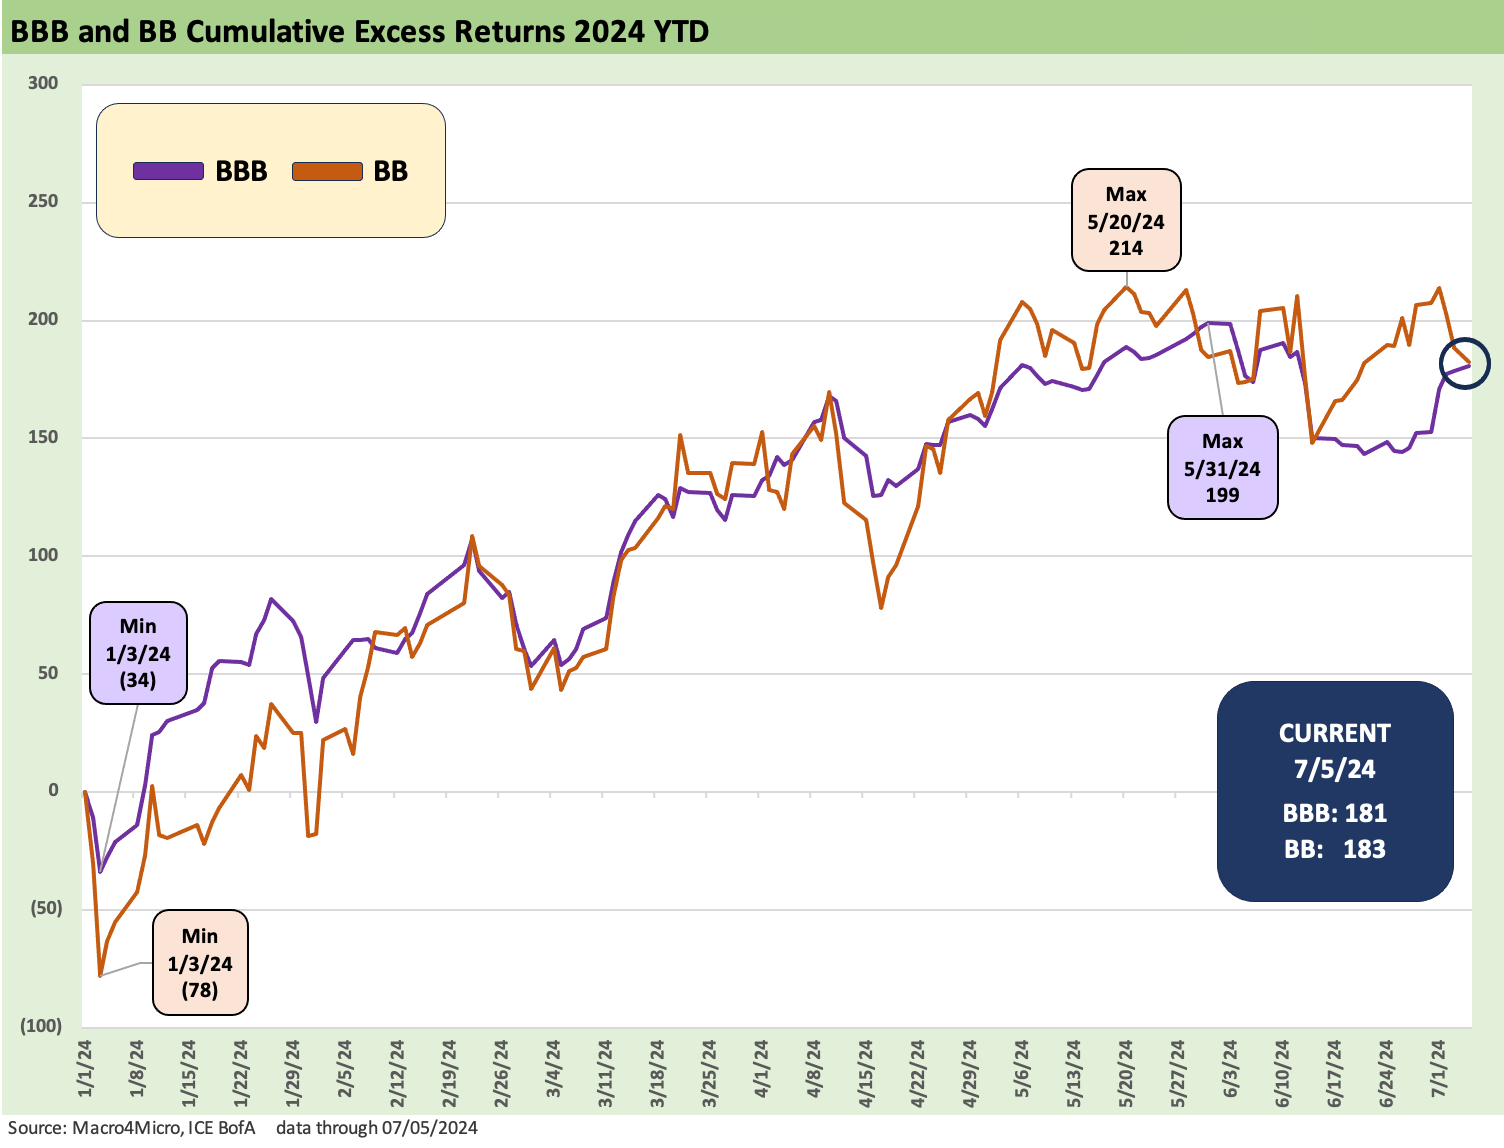
The above chart updates the running excess return differentials for BBB vs. BB, and they are running neck and neck through July 5. That somewhat defies the rule of “getting paid more for additional credit risk.” The idea of taking a fresh look at the BBB vs. BB mix by name and sector is a standard part of investor duties anyway, but the spread compression and return compression raises some flags around relative value of BB vs. BBB. BB looks too narrow vs. BBB although on the cusp issuer selection reigns supreme.
The BB tier is the largest in HY and the BBB tier is one of the largest nations on the planet at this point, so there is a lot of room to maneuver on the rising stars and falling angel risk exercise. The cusp analysis is a separate drill, and there is quite a diverse range in this composite from high BBB names to low BB names. The returns are not flattering, but the BB tier at this point and the BBB tier cusp risks are also well known when an abundance of long dated paper lurks in BBBs (e.g. Boeing).
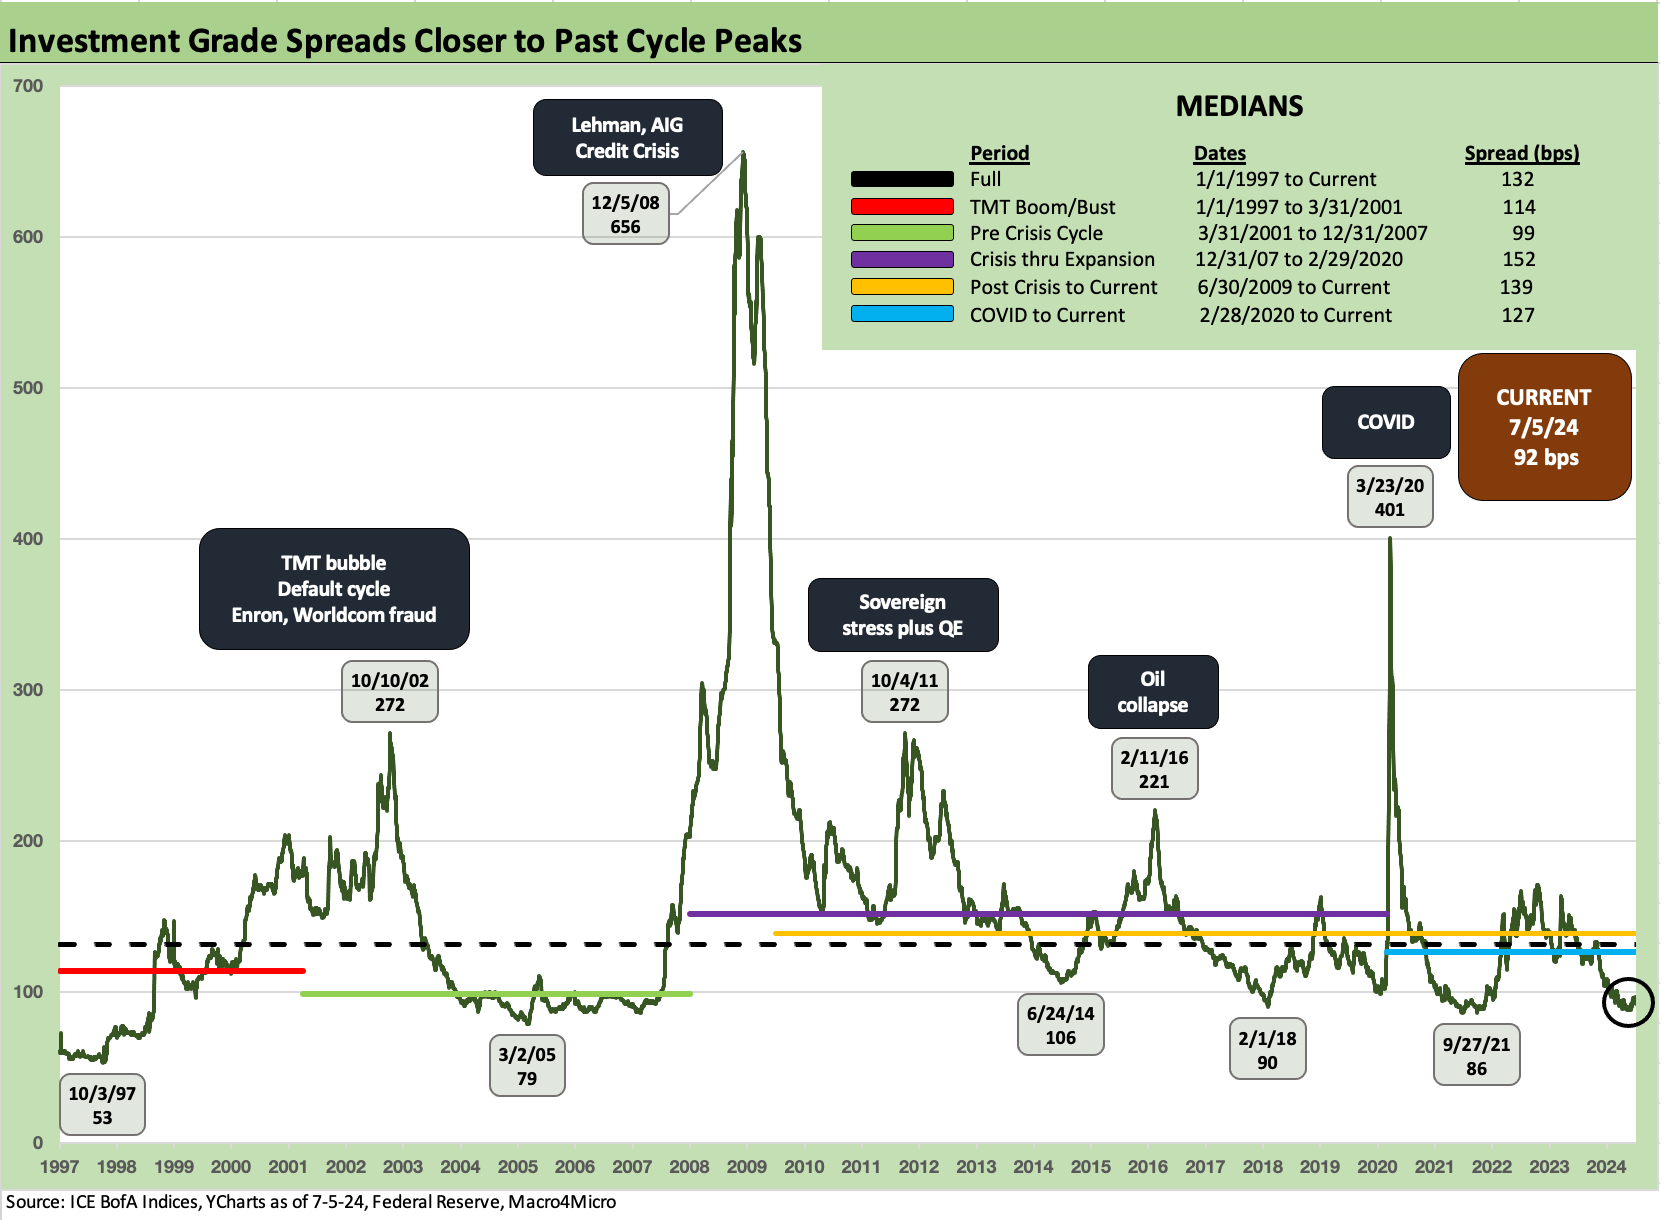
We have regularly updated the histories of IG and HY and don’t need to replay too much of the compression themes. The +92 bps IG OAS is modestly above the lows of Sept 2021 (+86 bps), Feb 2018 (+90 bps) and below the June 2014 levels (+106 bps). The March 2005 level of +79 bps had more distance while the +53 bps low of Oct 1997 was in a different zone. We highlight that 1997 saw +70 bps by year end in IG, which closes the gap modestly.
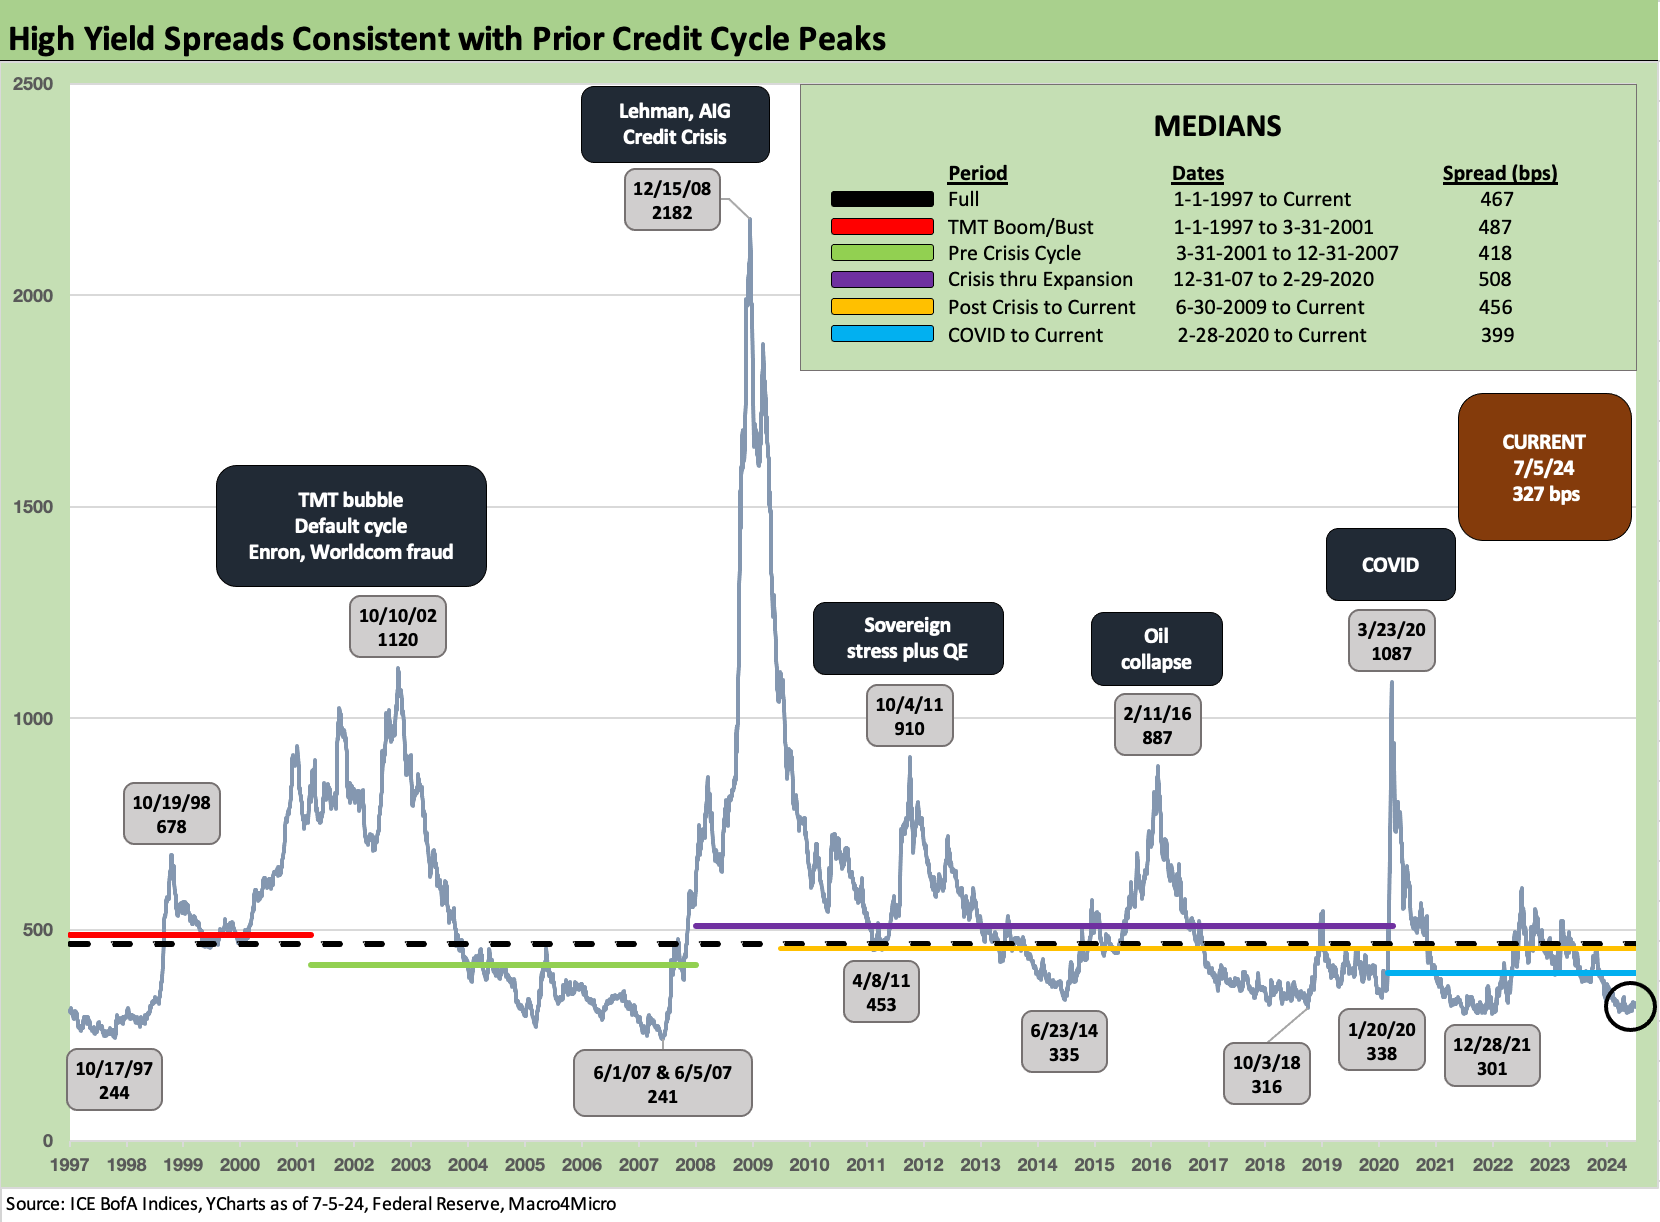
We have covered the HY OAS topic a lot and given it some context vs. earlier cycles and relative to other credit assets. We also like showing the HY OAS vs. the 5Y UST as a frame of reference for a view on the proportionate risk premium (see separate chart).
The +327 bps HY OAS is in the range of the June 2014 and Oct 2018 lows but remains notably wide to the June 2007 and Oct 1997 lows. Those 1997 and 2007 yield curves had more in common with current UST levels than the ZIRP year UST profiles.
The June 2007 lows of +241 bps at the start of the month come with the qualifier that June 2007 ended the month at +298 bps. For Oct 1997, the calendar year ended at +296 bps. That narrows the gap between extreme compression periods.
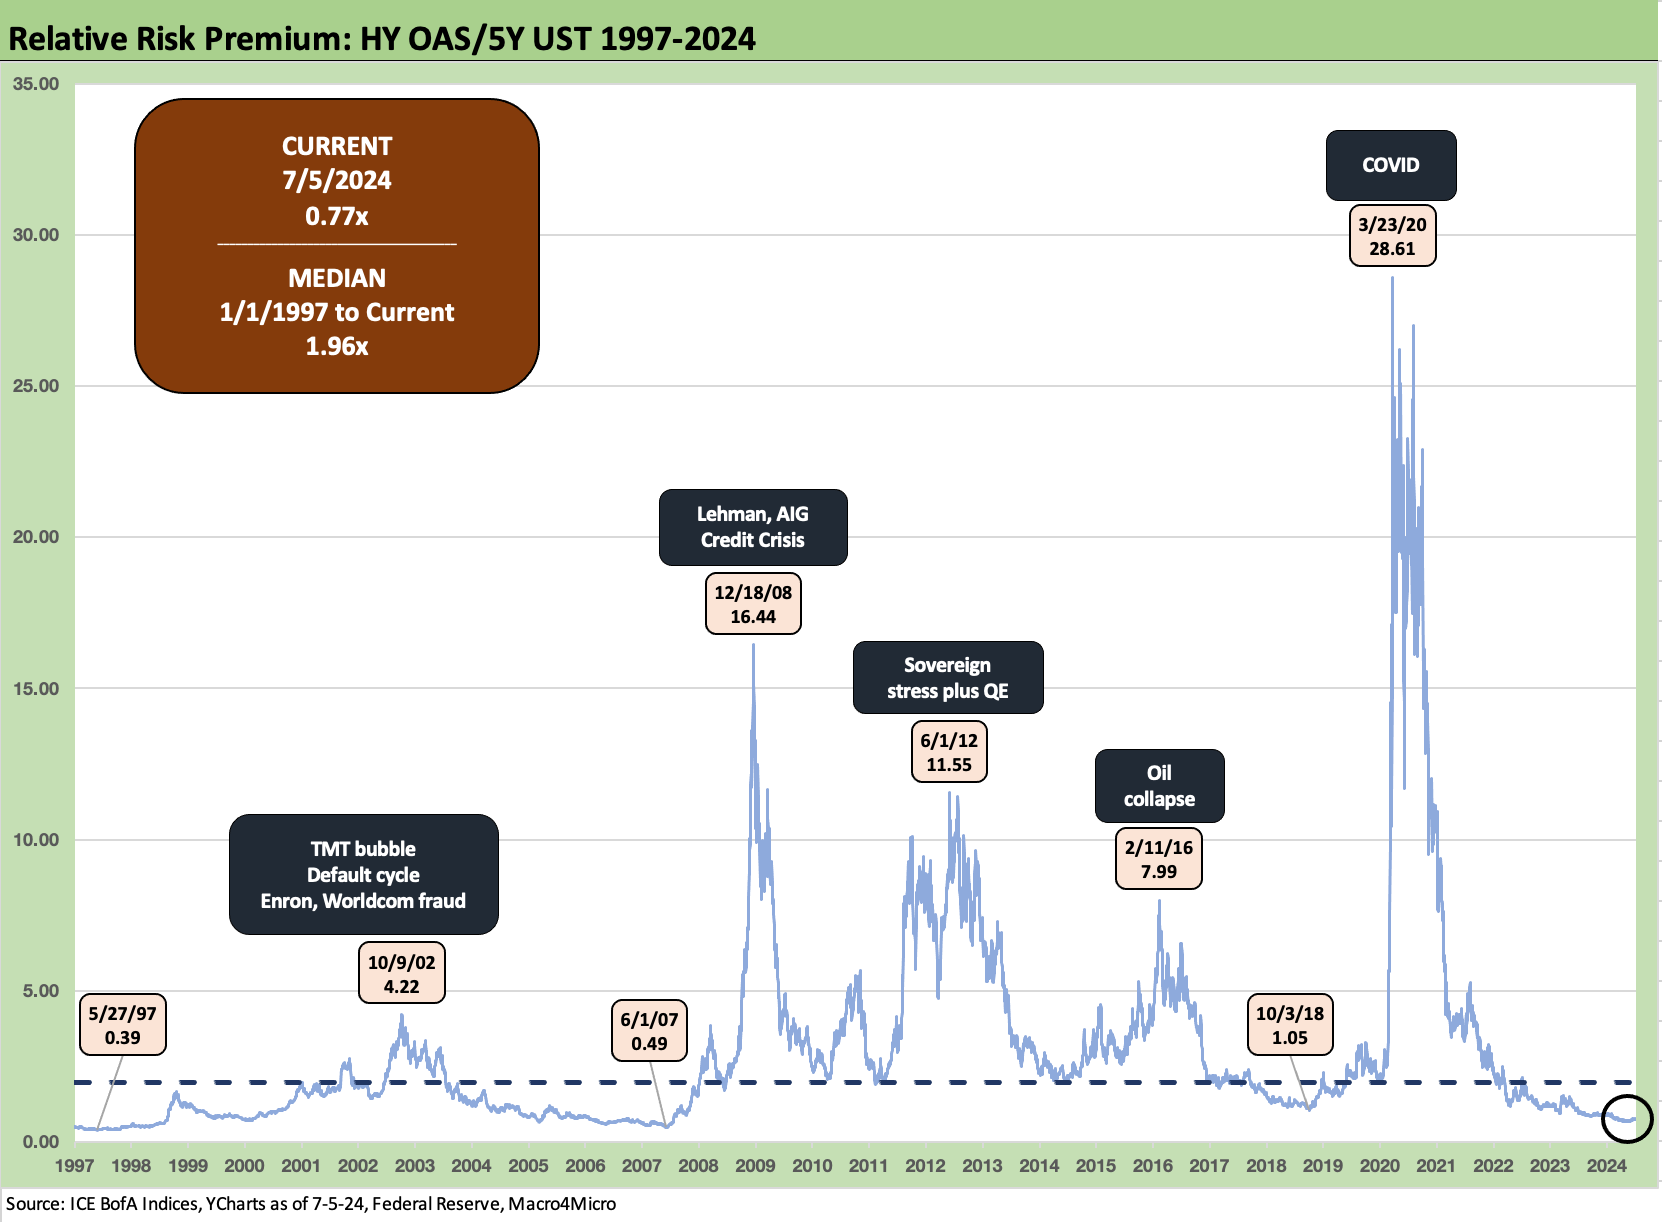
The above chart frames HY OAS vs. a duration relevant UST (for HY, the 5Y UST). HY OAS/5Y UST translated into the 0.77x ratio vs. the long-term median of 1.96x. We see 1.05x at the 10-3-18 HY OAS low but the risk premium remains well above the 0.49x of early June 2007 and 0.39x of May 1997. We get a sense of an ugly default cycle relationship with the Oct 2002 highs of 4.22x.
The post-crisis ZIRP and low UST curves before the 2022-2023 tightening action show very high ratios in part on the “low denominator effect,” but we always highlight that “low denominator is a key investment alternative in risk free bonds.” This is the essence of the reach-for-yield dilemma as investors ponder relative yields vs. minimum expected yields for a given bundle of risks (credit risk + duration risk).
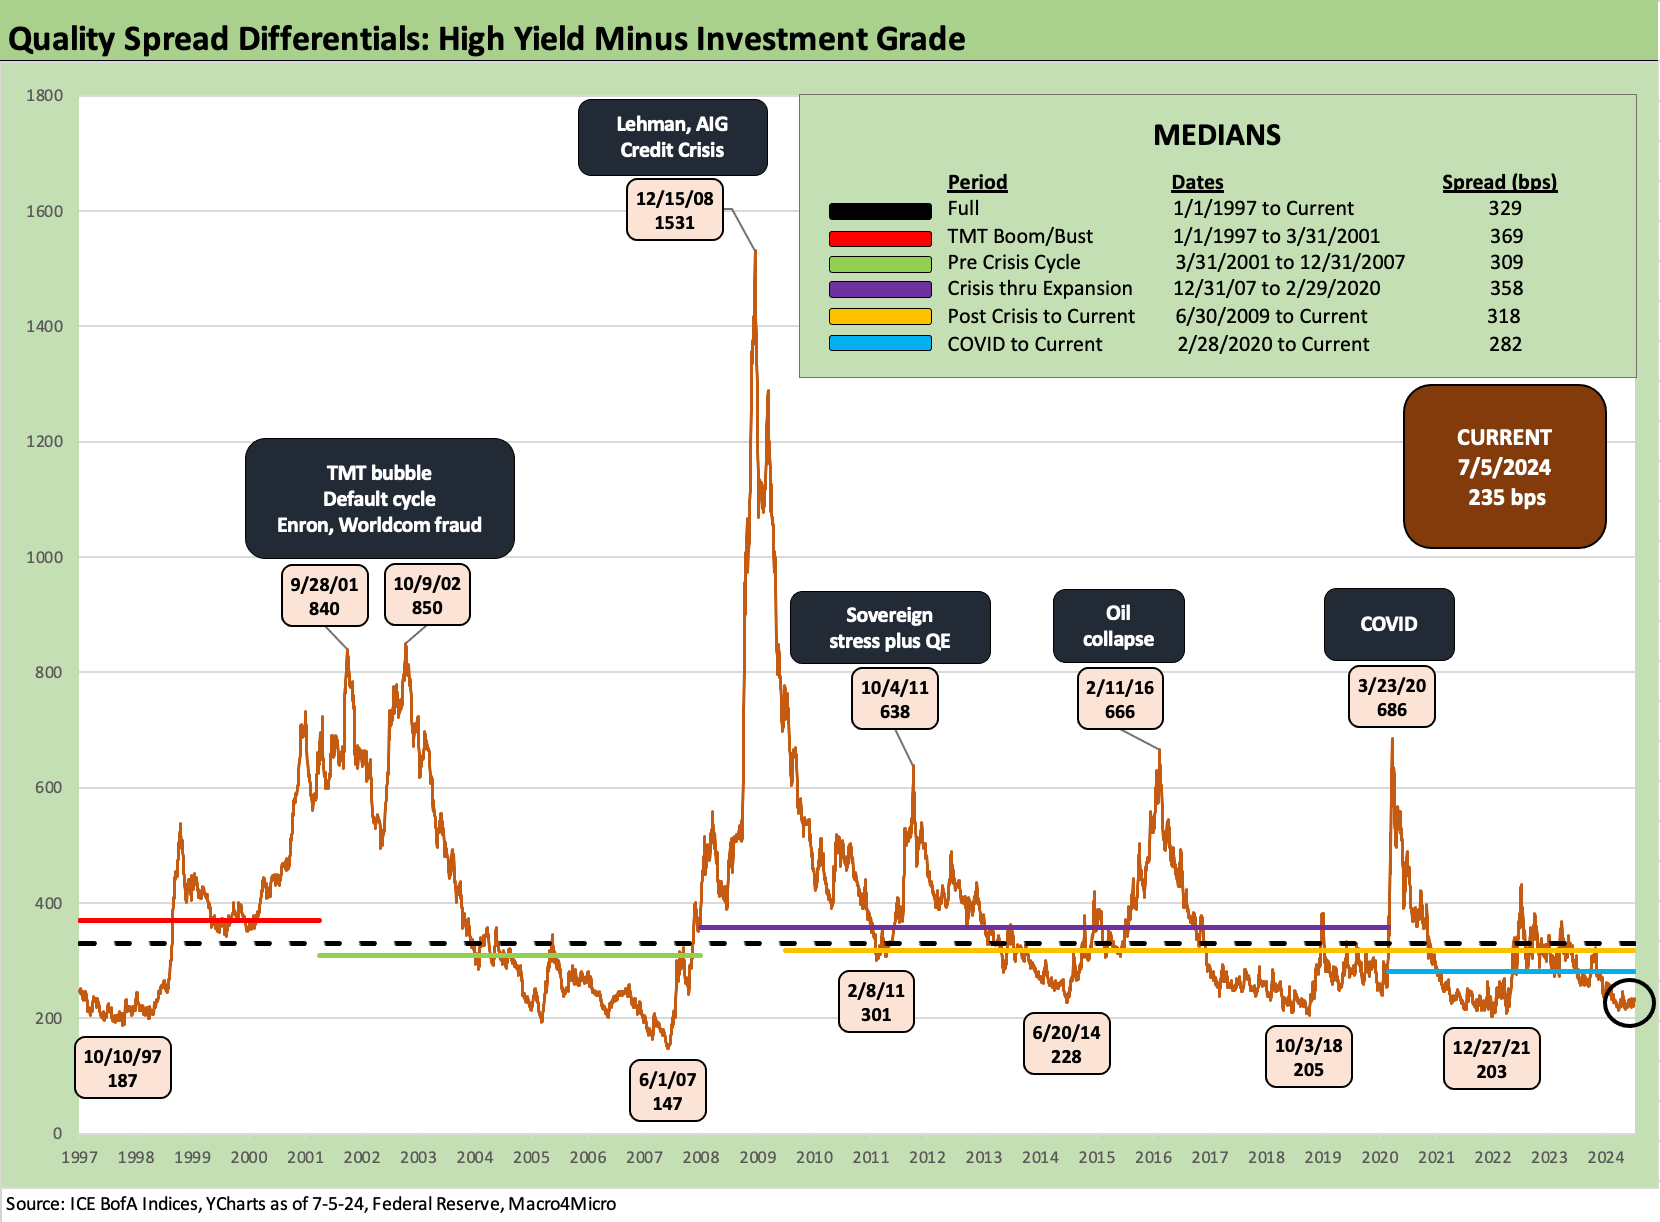
The time series for “HY OAS minus IG OAS” of +235 bps widened out this past week from recent lows. The current level has also moved away from some of the lows seen including 2021, 2018, and 2014 noted in the chart. The +147 bps differential of early June 2007 is a reminder that June 2007 was a true bubble with that HY OAS set against a much riskier mix of credit tiers and problem HY issuers than what we see today.
The +187 bps in Oct 1997 can say the same thing on the higher risk mix in the TMT bubble, but the deals got worse from there and the default cycle started well before the recession and stock market peaks. The +86% total return on the NASDAQ in 1999 was one for the ages.
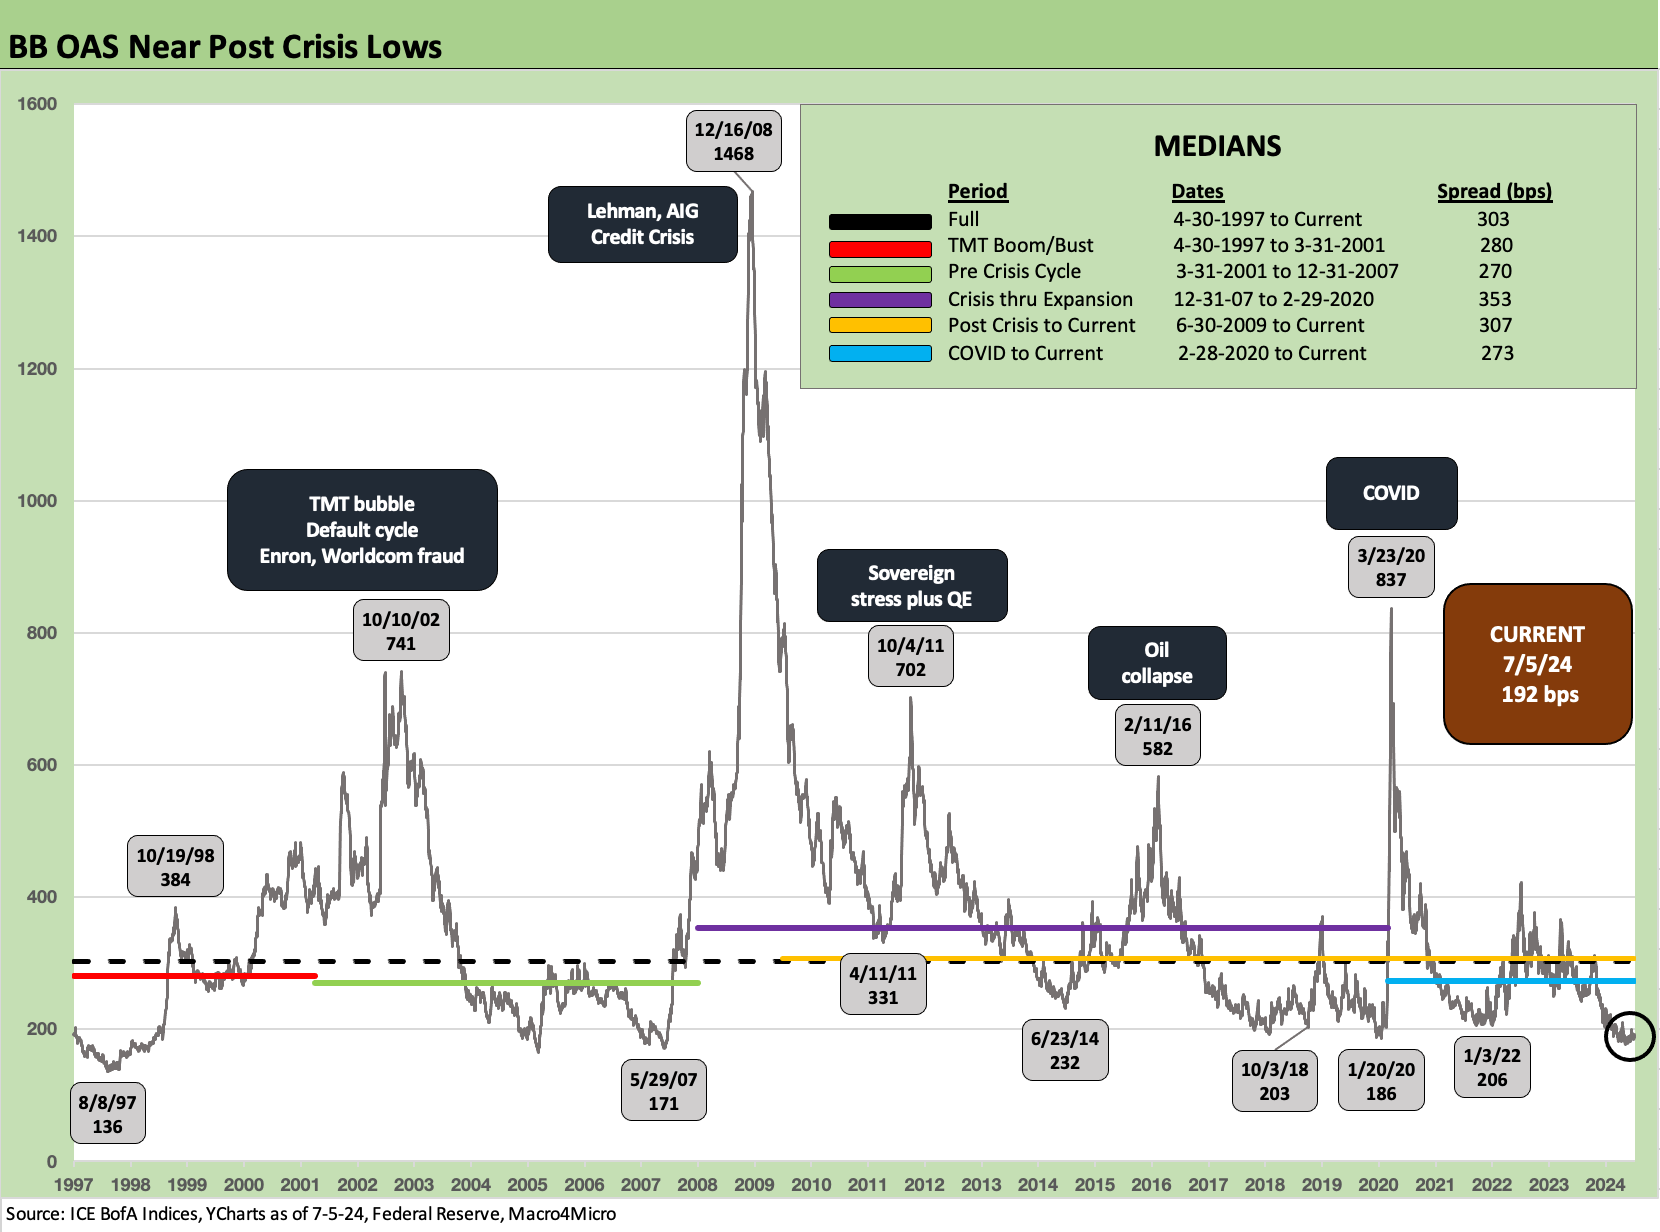
The BB tier OAS history is detailed above, and BB spreads of +192 bps OAS to end last week was inside the pre-tightening, early 2022 lows and modestly above the early 2020 pre-COVID lows of +186 bps.
The BB tier is still clearly a very long way from the Aug 1997 lows of +136 bps and less distant from the May 2007 lows of +171 bps. The June 2014 lows of +232 bps and Oct 2018 levels of +203 bps make for useful comps. June 2014 marked the first cyclical low for HY spreads (the CCC tier even hit par for the first time), but early Oct 2018 was the cyclical low of the post-crisis and pre-COVID HY cycle.
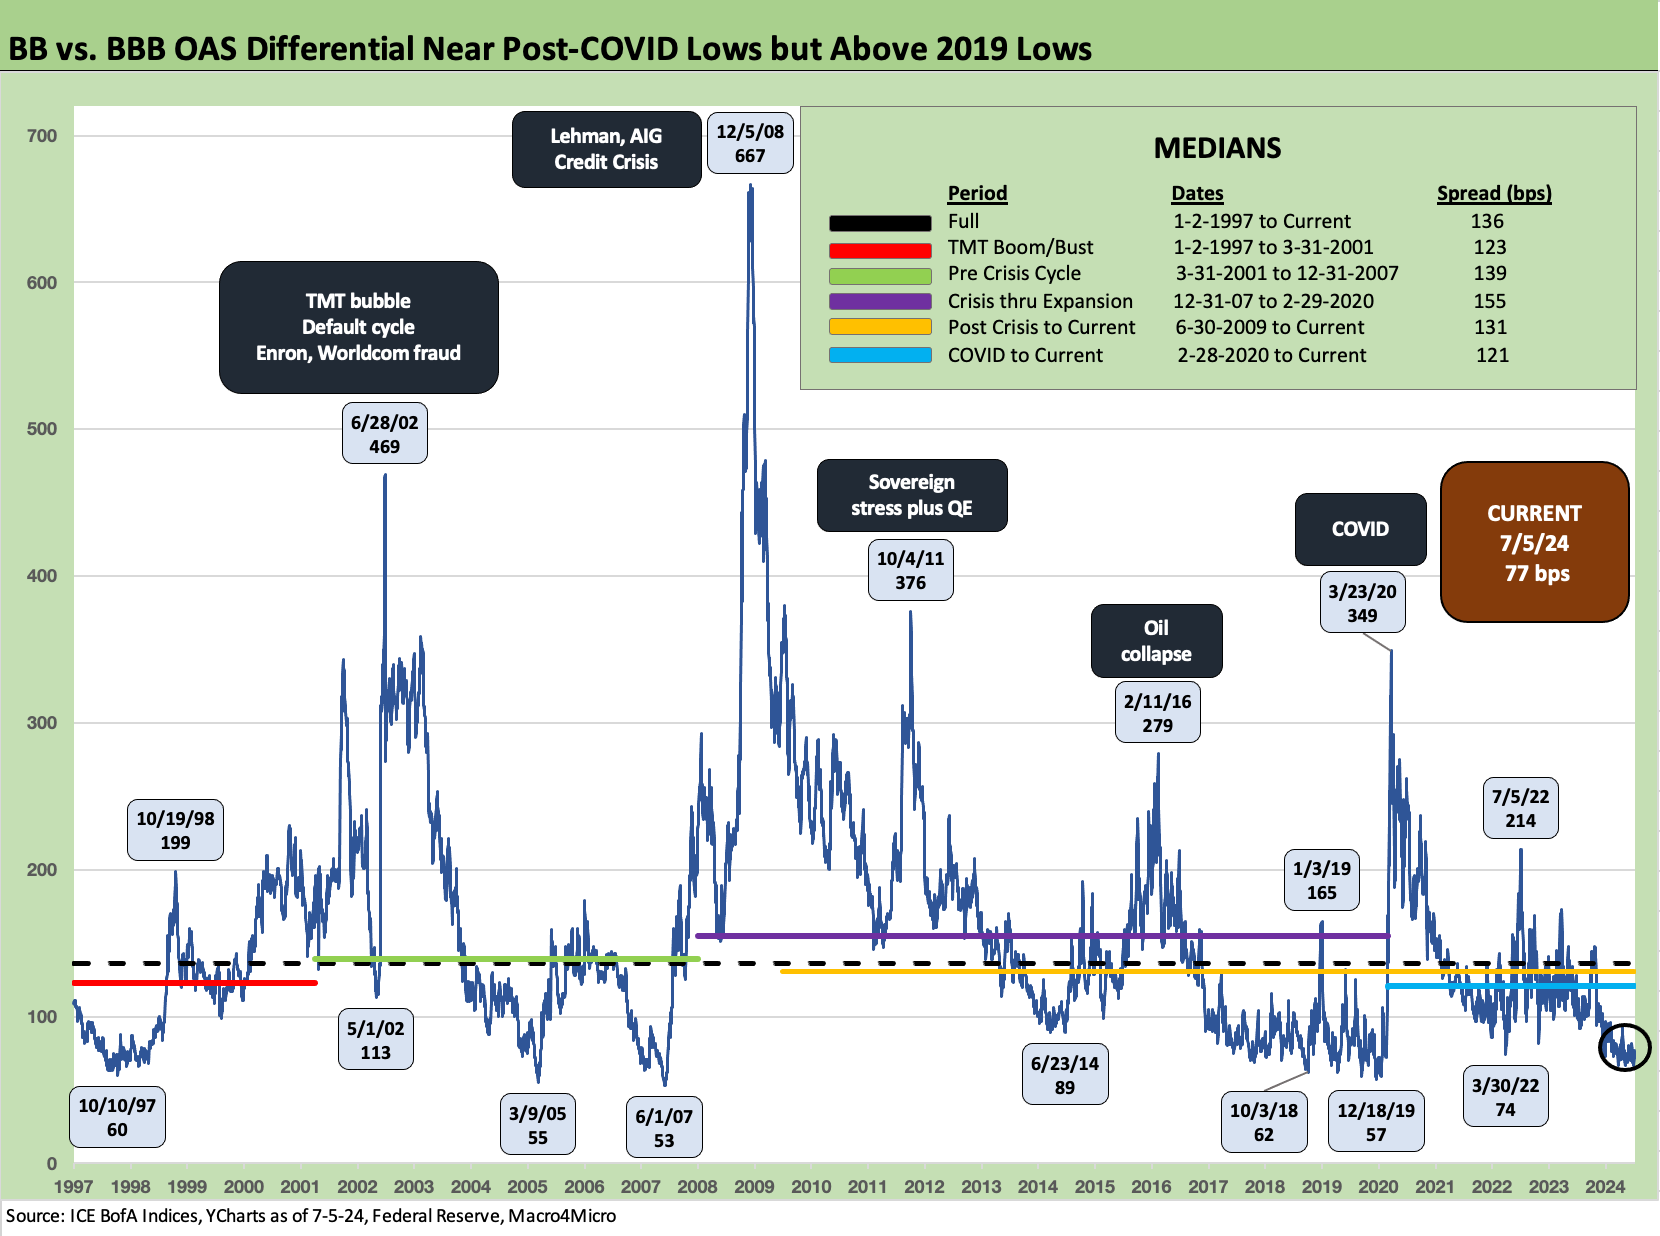
The above chart looks at the BB minus BBB spread differential across the cycles since the TMT cycle of the late 1990s. Among notable trends in the relationship is that the tightening cycle did not roil the relationship much since the current +77 bps is only slightly above the March 2022 differential of +74 bps after ZIRP had ended (effective 3-17-22). The BB vs. BBB quality spreads had hit a low back in late 2019 at +57 bps as the HY index and the BB tier had both run to dollar price par-plus highs into 2020 before COVID crushed the market.
As we look back across time, we see a +60 bps differential back in the Oct 1997 credit peak, which was a month when IG OAS briefly touched +53 bps. That was a frothy market to say the least.
In June 2007, a notoriously bubbly month, the BB-BBB differential had touched down to +53 bps after hitting +55 bps in March 2005 (the auto downgrades came later that year including some GM warnings shortly after the lows).
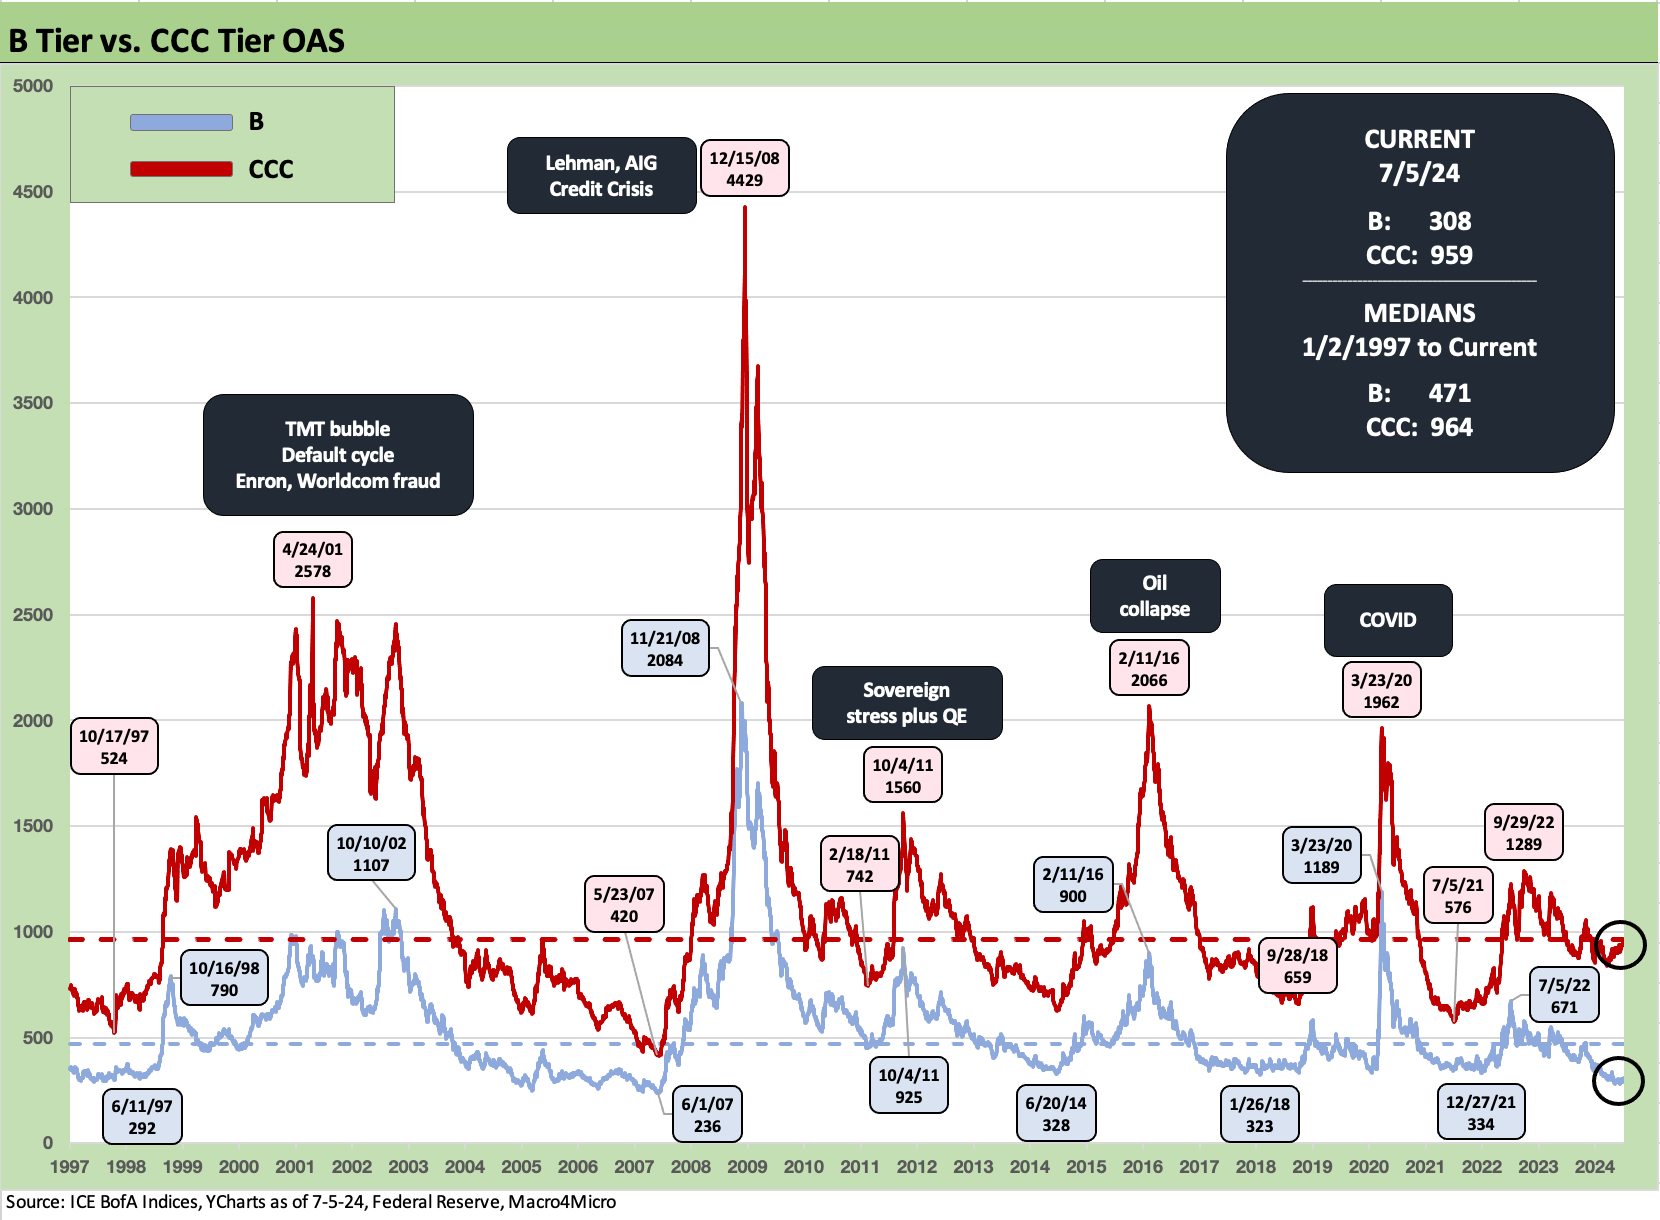
The above chart updates the B tier vs. CCC tier as of Friday close (7-5-24). We did a deep dive into the history of the lower tier relationships in a recent commentary (see The B vs. CCC Battle: Tough Neighborhood, Rough Players 7-7-24). We refer the reader to that analysis for more discussion, but the main story is that the asymmetric risk in the B vs. CCC relationship has been a wild ride over the cycles with each cycle having its own unique set of industry and issuer dynamics.
The current CCC mix comes with a story where the burgeoning private credit markets dominate more of the buyout space. That means that the HY bond index and the CCC tier are not as loaded with the type of leveraged transactions that have provided a lot of wild action in past credit cycle breakdowns.
There are also less of the types of binge-borrowing growth industries that were dependent on forward valuation stories to justify a level of cash bleed and excess borrowing to reach their equity valuation promises. The most notorious were the debt-fueled telecom capex boom of the late 1990s and the upstream energy debt excess of the post-crisis years.
The current CCC tier headaches and weak B/CCC liability management battles are playing out more with legacy borrowers rather than the typical sources of past spread spikes on the low end.
Some notes on yields…
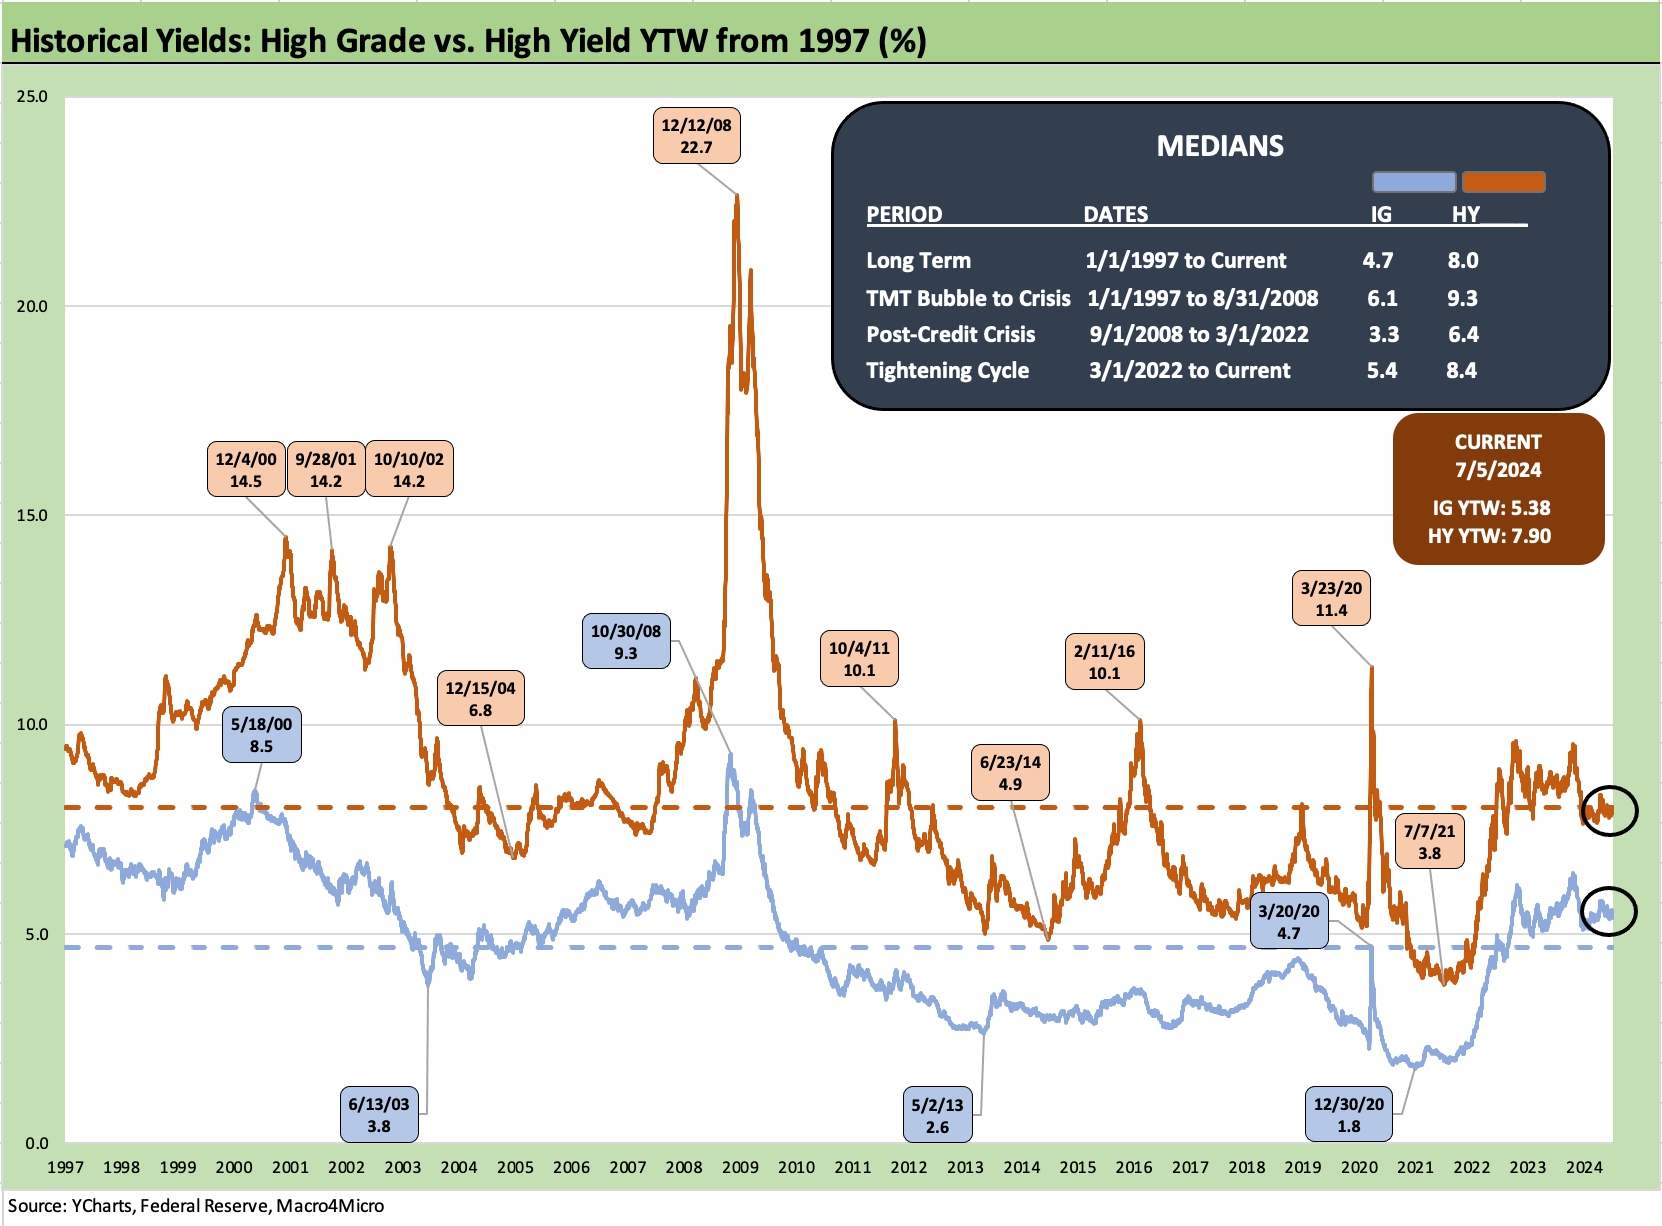
The above chart updates the running IG Corp and HY benchmark yields across time. The more logical and appropriate median to use as a comp is the pre-crisis timeline outside the world of ZIRP and QE since that is how the markets are operating now. That means the 9.3% YTW for HY and the 6.1% for IG are good frames of reference for the 5.38% IG YTW and 7.90% HY YTW to end last week. The current markets have lower UST curves as a feature but also include tight spreads as covered above.
When we drop in all those ZIRP and minimal UST rate backdrops, including the “normalization years,” the long-term median drops to 8.0% for HY (where the market is now in HY) and 4.7% for IG (below where the market is now). The logic in using ex-ZIRP comps is that the new normal HY index yield will be higher as spreads go through the inevitable spread pressures and widen from the current compression stage.
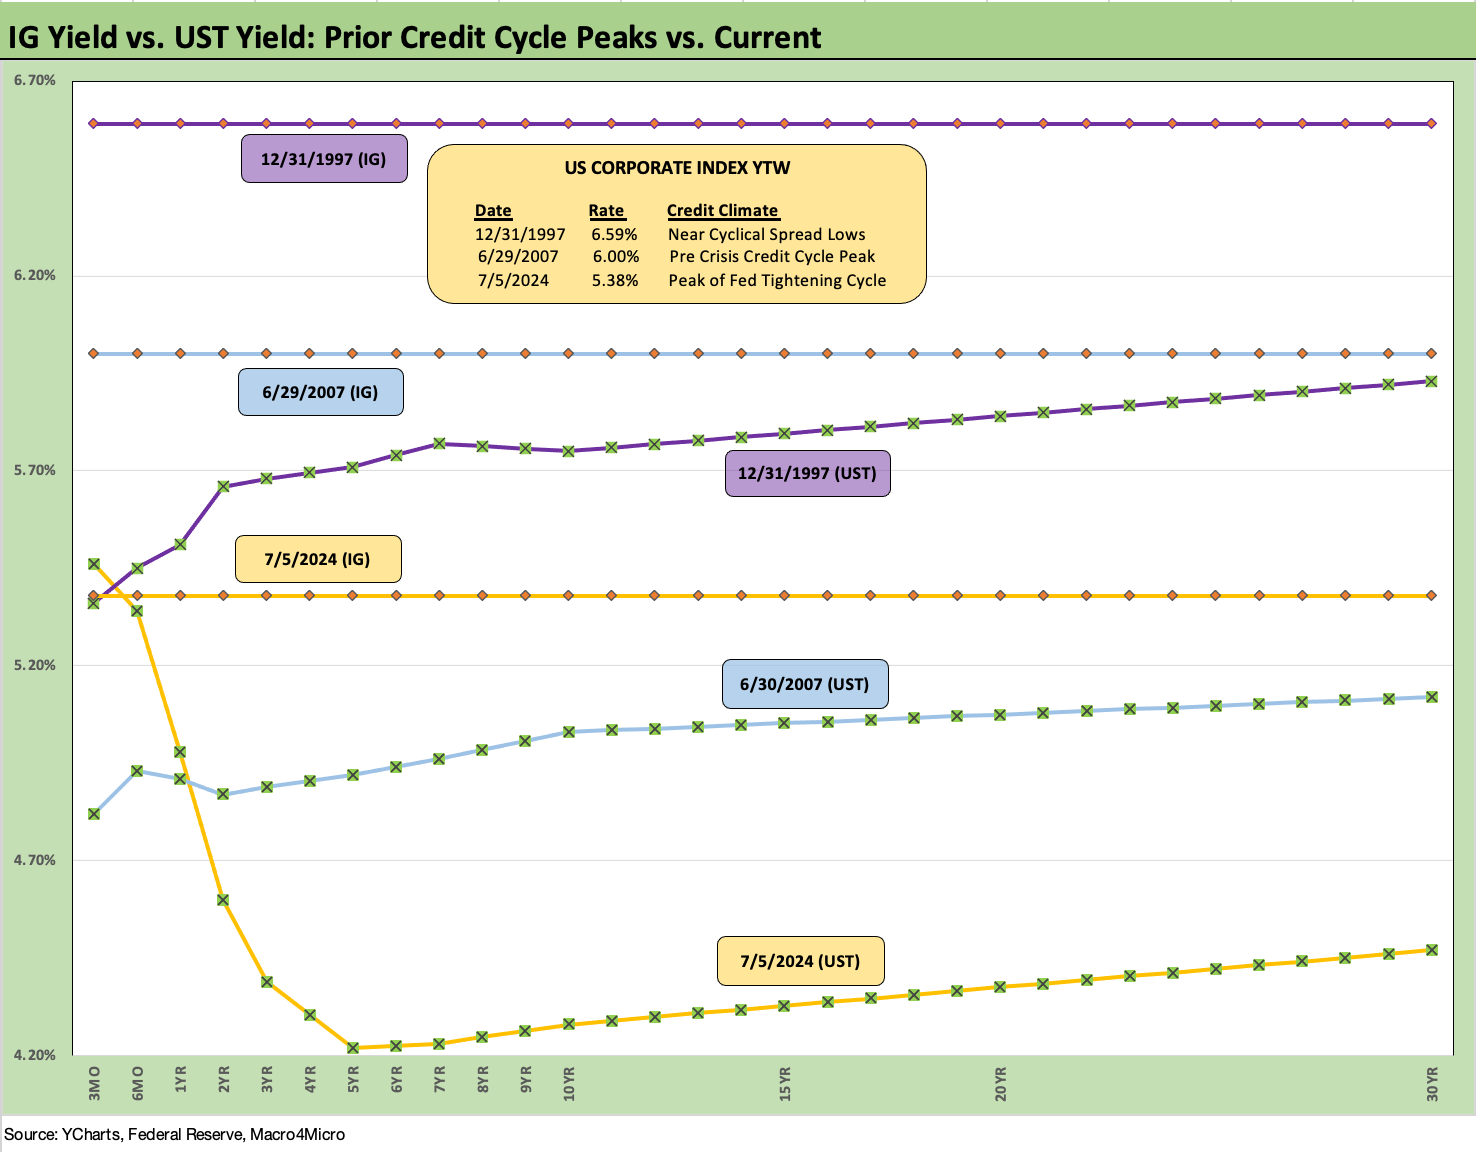
The above chart is one we like to use regularly for a gut check on prior credit market peaks in IG and HY. We use late 1997 and mid-2007 as good examples of credit excess to frame the yields then vs. now. As we cover above in the spread sections and as we detail in our historical yield charts across the non-ZIRP credit cycles (see Footnotes & Flashbacks: State of Yields 7-7-24), the UST curve today is in fact quite low for all of the bitching and moaning one hears about the Fed and rates. Similarly, spreads are compressed by any standards even if they have been tighter in some past cyclical lows.
Since IG yields cling more to the UST levels than HY, we see all-in yields below those prior credit market peaks. The 5.38% is below the 6.0% of June 2007 and the 6.6% of Dec 1997. The interesting twist in this market is the discounted index (92.5 at 7-5-24) and lower coupons. What happens is you get more in accretion income relative to coupon vs. past cycles as the market is coming out of ZIRP-years coupons into a tightening cycle. As more current coupon deals arrive, finding demand in IG will not be a challenge given pension needs and cash income investors.
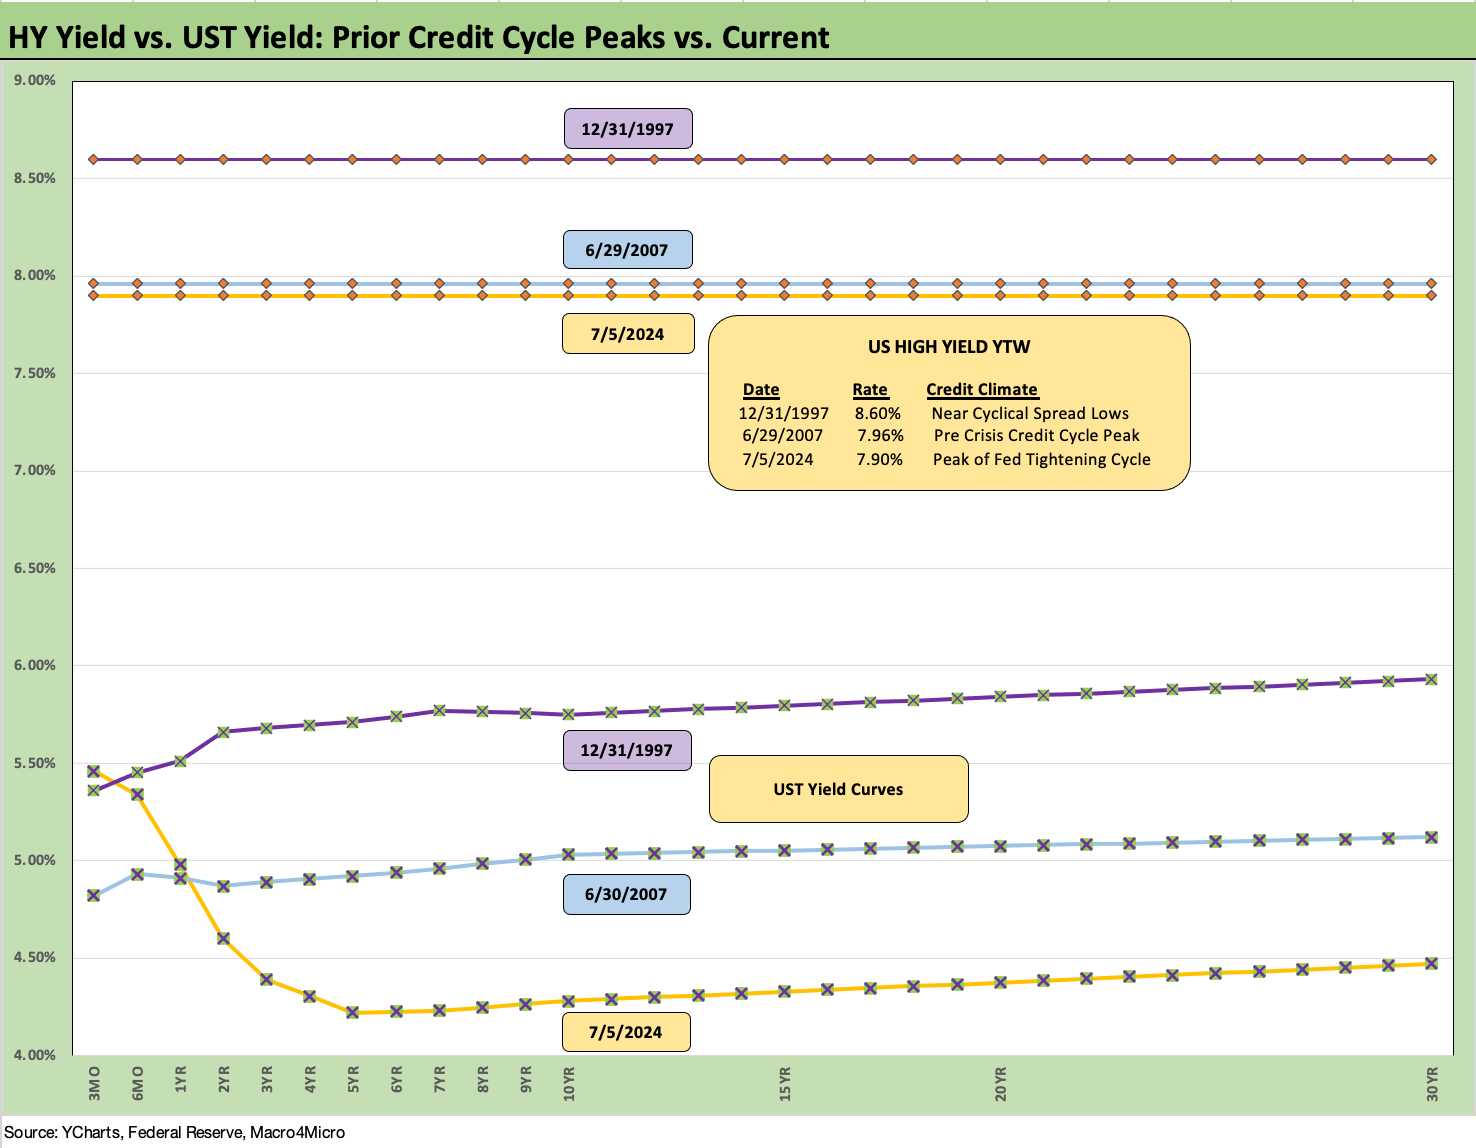
The above chart does the same drill for HY that we did in the prior chart for IG. We plot the HY index yields on the horizontal lines and include the UST curves from each period.
For the shorter duration HY asset class (shorter than IG that is) the inversion and UST curve uncertainties open up risks and opportunities. The biggest opportunity is the pull-to-par upside on a refinancing and rolling into a new current coupon bond in names you like. The risk is stagflation, rates rise again, and spreads gap.
The “spread pressure” worry is constant across cycles, so nothing new there. What is new this time around is the risk of stagflation and recession on bad policy and notably a breakdown in supplier chains for those issuers that are more exposed to such risks.
For example, a blanket large scale tariff policy broadly or just targeting China would be a bullet for more than a few retailers and the same for manufacturers who depend on global supplier chains. It is easy to talk yourself into defensive exposure when you consider some of the tariff idiocy running across the headlines (Can Trump really be that reckless and that dumb?). Extreme tariff programs are very predictably damaging to unit costs, margins, pricing strategies, and even production disruptions. We just can’t tell how damaging yet.
Contributors:
Glenn Reynolds, CFA glenn@macro4micro.com
Kevin Chun, CFA kevin@macro4micro.com
See also:
Footnotes & Flashbacks: State of Yields 7-7-24
Footnotes & Flashbacks: Asset Returns 7-7-24
The B vs. CCC Battle: Tough Neighborhood, Rough Players 7-7-24
Payroll June 2024: The Race Gets Confusing 7-5-24
JOLTS May 2024: The Jobs Oasis Still Has Water 7-2-24
Footnotes & Flashbacks: Credit Markets 7-1-24
State Unemployment: A Sum-of-the-Parts BS Detector 6-30-24
The Debate: The China Deficit and Who Pays the Tariff? 6-29-24
PCE, Income and Outlays: Practicing Safe Growth? 6-28-24
HY Spreads: The BB vs. BBB Spread Compression 6-13-24
HY Spreads: Celebrating Tumultuous Times at a Credit Peak 6-13-24
Trade Flows: More Clarity Needed to Handicap Major Trade Risks 6-12-24
Miscellaneous histories:
Systemic Corporate and Consumer Debt Metrics: Z.1 Update 4-22-24
Credit Markets Across the Decades 4-8-24
Credit Cycles: Historical Lightning Round 4-8-24
Histories: Asset Return Journey from 2016 to 2023 1-21-24
Credit Performance: Excess Return Differentials in 2023 1-1-24
HY vs. IG Excess and Total Returns Across Cycles: The UST Kicker 12-11-23