UST Moves: 1988-1989 Credit Cycle Swoon
The 1988 credit cycle peak transitions into a volatile 1989.
As we continue our UST series on cyclical transition periods, we move into the late 1980s as the calendar year peak for the credit cycle of 1988 started to give way in 1989 to the effects of excess in credit risk, too many LBOs, and too much friction between the layers of bank loans and bonds back in the Glass-Steagall days.
These were years when OTC HY secondary markets were very thin/inefficient and making markets only in your own deals was considered respectable (sort of) with the response of “no bid” not unusual by the time 1990 rolled around.
The financial sector saw the peak of the S&L crisis in 1989 with the “Financial Institutions Reform, Recovery, and Enforcement Act” legislation of the summer capturing the flavor of the increasingly troubled markets with hung LBO bridge loans ticking on the balance sheets of some major securities firms.
The cumulative effects of an oil patch crisis were weighing on important regional economies and especially the Texas bank and thrift system but were soon to be joined by a geographically wider crisis that was evident for years after that in California.
We continue our UST curve series with a look at the late 1980s/early 1990s. In our first two parts of the series, we provided an overview (see Yield Curve Lookbacks: UST Shifts at Cyclical Turns 10-16-23) and then a look at the wild Volcker years (see UST Moves 1978-1982: The Inflation and Stagflation Years 10-18-23). The next leg of the journey is in the tumultuous late 1980s that moved into the first HY default spike and some systemic bank strains.
The yield curve chart above captures the tightening cycle and upward shift from 3Q88 to 4Q88 to 1Q89. Then the problems started to mount with easing and a downward shift to 2Q89 and then 4Q89. The shifts in Fed policy and the reshaping and shifting level of the UST curve moved quickly. That also came at a time when a new Fed chair was going to get his first cyclical test and taste of the first inflation creep since Volcker won his war.
The 1988-1992 story line is a two part drama (at least)…
We will break this transition timeline into two commentaries with distinct cyclical turning points. This commentary focuses on 1988-1989 events. The second leg of the review will zero in on the 1990-1991 action that saw the onset of the official NBER recession period by the summer (July 1990). The year 1990 also came with a wave of financial system stress from the securities firms and later beyond 1990 to regional banks facing a commercial real estate meltdown and some major money centers (notably Citibank).
The period of economic weakness in 1990 ran alongside the de facto collapse of several brokerage firms and then the Gulf War warmup period that drove another oil spike and CPI pop. The early August invasion of Kuwait by Iraq infected the consumer sector and delivered concentrated pain to some industries (airlines, autos). That was the period when Greenspan took his first deep dive into heavy duty easing that extended well into the next expansion (see Greenspan’s First Cyclical Ride: 1987-1992 10-24-22).
The timing (year, quarter, etc.) for the “credit cycle” peak of the late 1980s can be debated, but we set 1988 as the credit peak calendar year. Whether it be economic growth rates, excessive credit risk, or aggressive deal flow in the market, 1988 was a booming year with credit driving growth and fees driving earnings for the underwriters.
The cycle started to unravel in 2H89, and the seemingly unlimited risk appetite in 1988 was a contributor. The auto sector was feeling weakness in late 1989, and sustained economic fallout in the energy-driven regions were still feeling a range of headwinds including asset quality problems, bank credit contraction (and bank/thrift failures) and pressure on residential and commercial real estate.
NBER later selected July 1990 as the cyclical peak and start of the recession that continued through the March 1991 trough as framed by NBER. That was a recession length of only 8 months (see Business Cycles: The Recession Dating Game 10-10-22). Greenspan and the Fed obviously saw things differently as we cover below in the fed funds trend line.
Curve shifts and creeping inflation…
The turmoil of the late 1980s was arguably the first major inflation and cyclical test for Alan Greenspan, who took the helm in August 1987. The stock market crash of Oct 19, 1987 was 36 years ago as of this past week, but we still don’t see that event as a big test for a major monetary policy challenge. The year 1987 still ended up in the black for the full year, and the following periods saw a solid rebound in stocks with the S&P 500 posting over a +16% total return in 1988 and just under +32% in 1989 even as the credit markets were weakening badly late in the year.
The year 1989 was one of those years that later reinforced to those in the equity market to “watch credit.” The year 1999 in the TMT bubble saw an even more disconnected performance of equities and credit. The year 1999 saw a +86% total return with NASDAQ with the HY default cycles underway after a near EM contagion and LTCM crisis in late 1998. We will cover that in later pieces. The 2007 period saw a more compressed lag period on stocks waking up to credit stress, but credit markets led in the summer and equities only felt the full effects in the fall. That is for a later commentary in this series.
For many, the stock market crash of 1987 is as convoluted and inexplicable today as it was then even if there are plenty of theories. I was sitting at my desk at Lehman Brothers taking in the theories across the ensuing periods for that -22.6% drop on “Black Monday.” After hearing more than enough about “portfolio insurance” I gave up. The unpredictability of equity derivatives may have given the market its first taste in Oct 1987, but many a wonk and Poindexter wannabe have failed to deliver a widely embraced explanation for the crash. The bull market soon got back on track.
The year 1987 is not part of this cyclical transition analysis (we will look at the “between years” after we wrap the cyclical transition years), but it was a strong year for risky credit and aggressively leveraged bonds. HY asset class total returns in 1988 climbed into double digits to over +13% before plunging to +2% handles in 1989 and negative in 1990.
The market had seen a sustained rise in fed funds and a bear flattener from the front end across 1988 with fed funds peaking in the spring of 1989. As we cover below, the rate of fed funds rising higher made for a material differential vs. CPI and PCE vs what we see today. That “fed funds vs. inflation” relationship is one to consider as we look back at the 1980s and early 1990 transition and how the Fed fought inflation then vs. now (see Fed Funds vs. PCE Price Index: What is Normal? 10-31-22).
In contrast to the brief 1987 stock crash, the stress that unfolded in 1989 and into 1990 was far more understandable. The term asset bubble always gets tossed around, but excessive credit risk, inadequate capital, short term funding dependence for brokers (mostly commercial paper), the asset-liability mismatches with inventory in the small clubby world of sell side trading desks, and the Dodge City regulation in the brokerage industry back during the Glass-Steagall world all started to add up into trouble in 1989. When firms started disappearing and desks were getting locked down in 1990, that secondary liquidity effect was much worse. We will address some of those issues in the next commentary.
CPI reared its head again in the late 1980s…
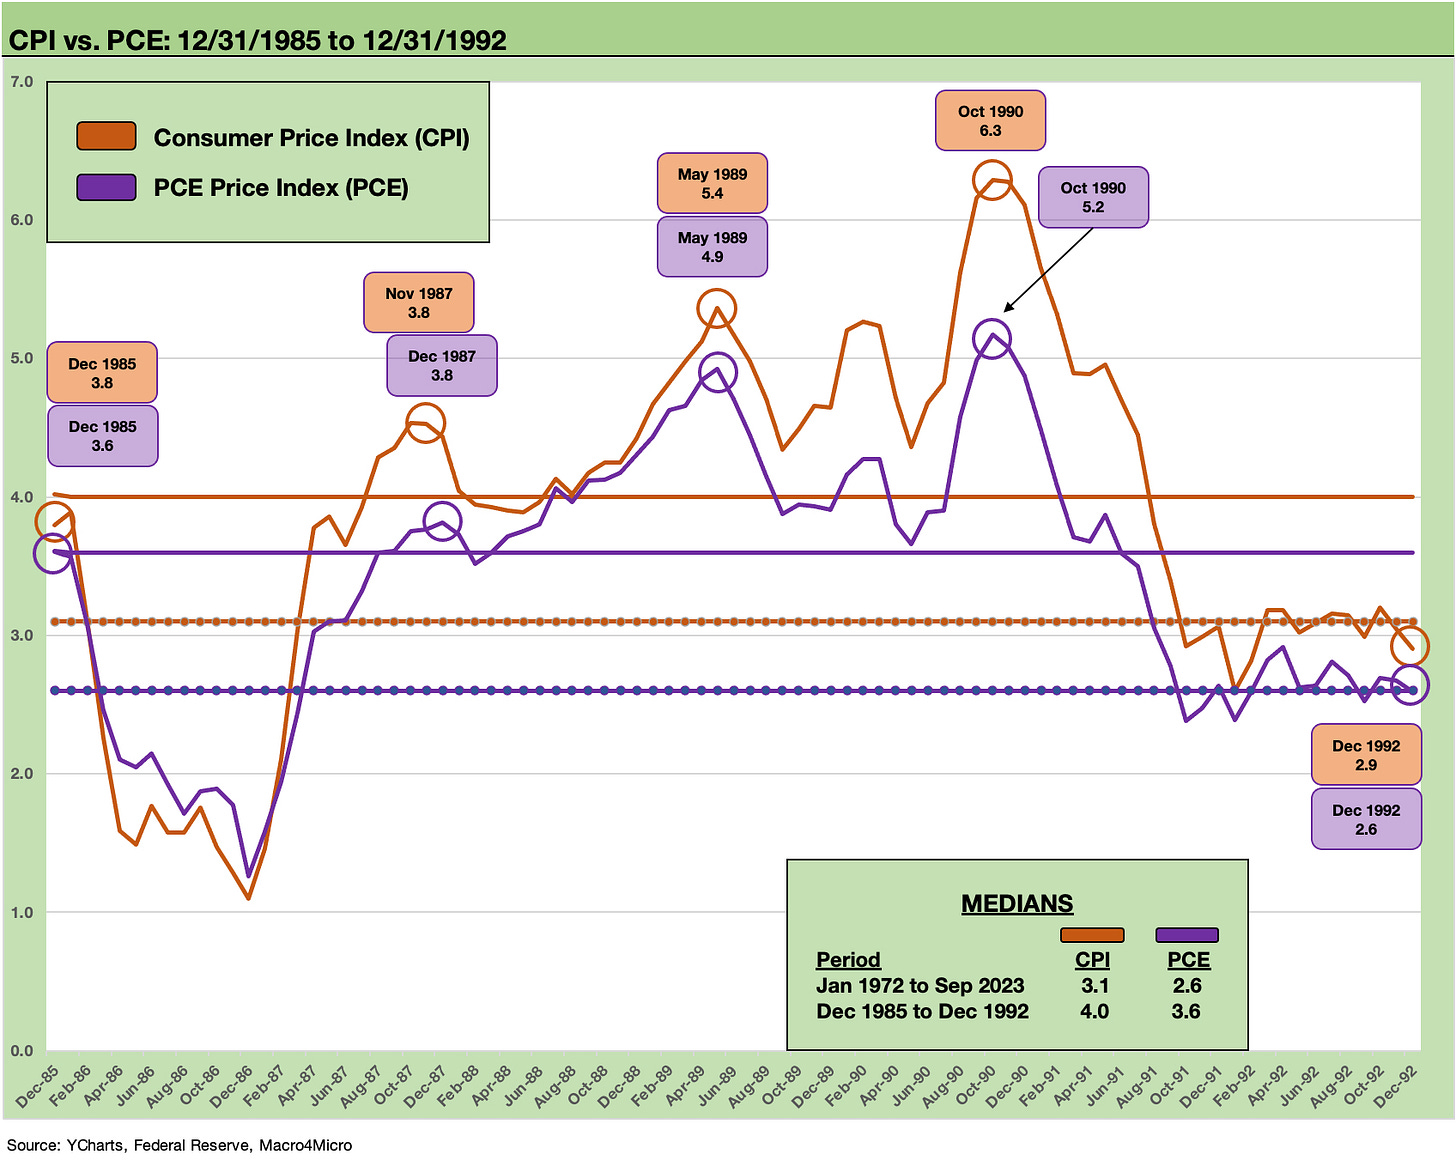
The above chart tracks the CPI and PCE numbers from the end of 1985 and the +1% handles in CPI across the busy ride of the late 1980s into the early 1990s, where we saw a +6% handle high with the anxieties around what the Gulf War might do to oil (the nerves went away quickly after the first day of the war).
While this piece looks more narrowly at 1988-1989, we included some before and after years in the time horizon from the CPI rise into the tightening cycle and then on to the other side as recession kicked in and Greenspan sprang into action. The Greenspan easing will be covered in the next commentary that looks into the 1990 recession and aftermath.
The box in the chart above details the CPI and PCE medians for the short-term time horizon from 1986 to 1992 as well as the long-term medians from 1972 to Oct 2023. We will use this chart again in our next commentary on the 1990-1992 transition. CPI was rising across 1987 from a +1% handle to start the year to +4% handles to end it. CPI remained biased toward +4% handles in 1988 (10 of 12 months) into 1989 before hitting the magic +5% rate by spring.
The Fed actions in 1989 show the Fed reversing course from sustained tightening across 1988 into 1Q89 back into accommodation mode as 1989 continued. After an extremely ambitious few years of higher corporate sector leverage and an oil patch crisis after 1986, the problems were starting to pick up at a lag.
The monetary response under the “new guy” (Greenspan)…
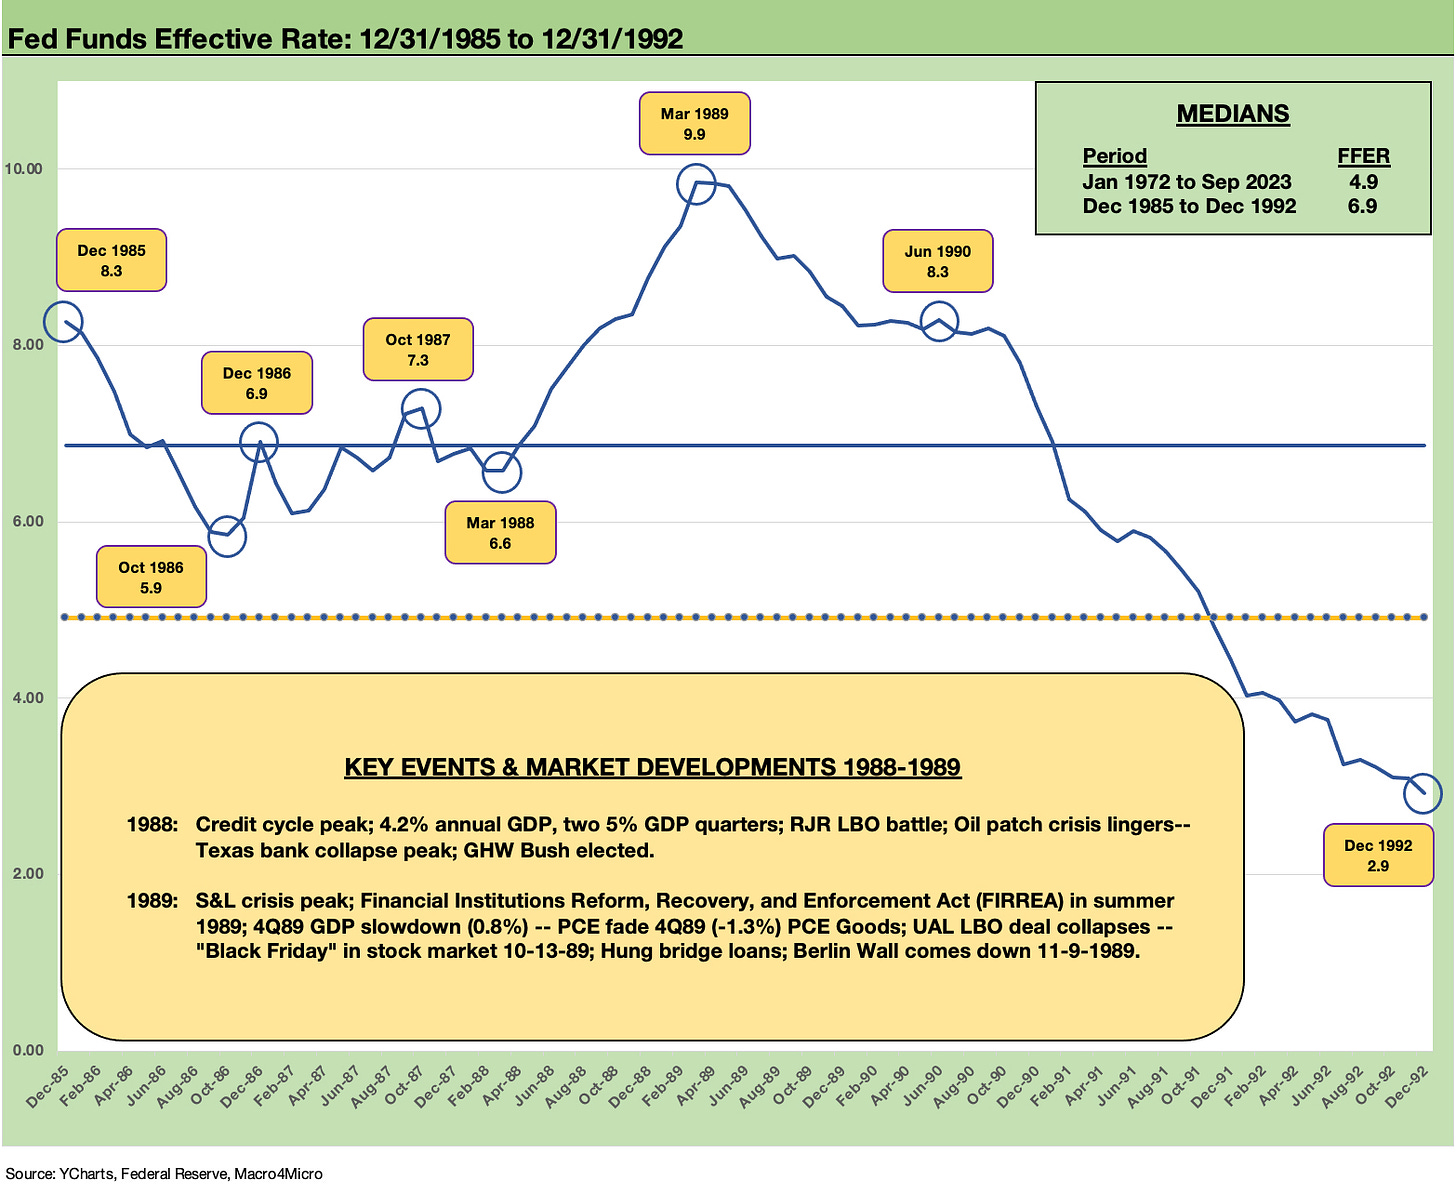
The above chart plots the fed funds pathway across 1986 through 1992. We also highlight some of the events that took place and a few other developments. The year 1988 was a banner year for equity and credit, but then gave way to a wave of bad news and volatility as 1989 wore on. For 1988, the record LBOs (RJR battle in Oct-Nov) and seemingly unlimited credit appetites was the main theme. The cascading oil patch collapses and Texas bank failures were bigger story for that neck of the woods.
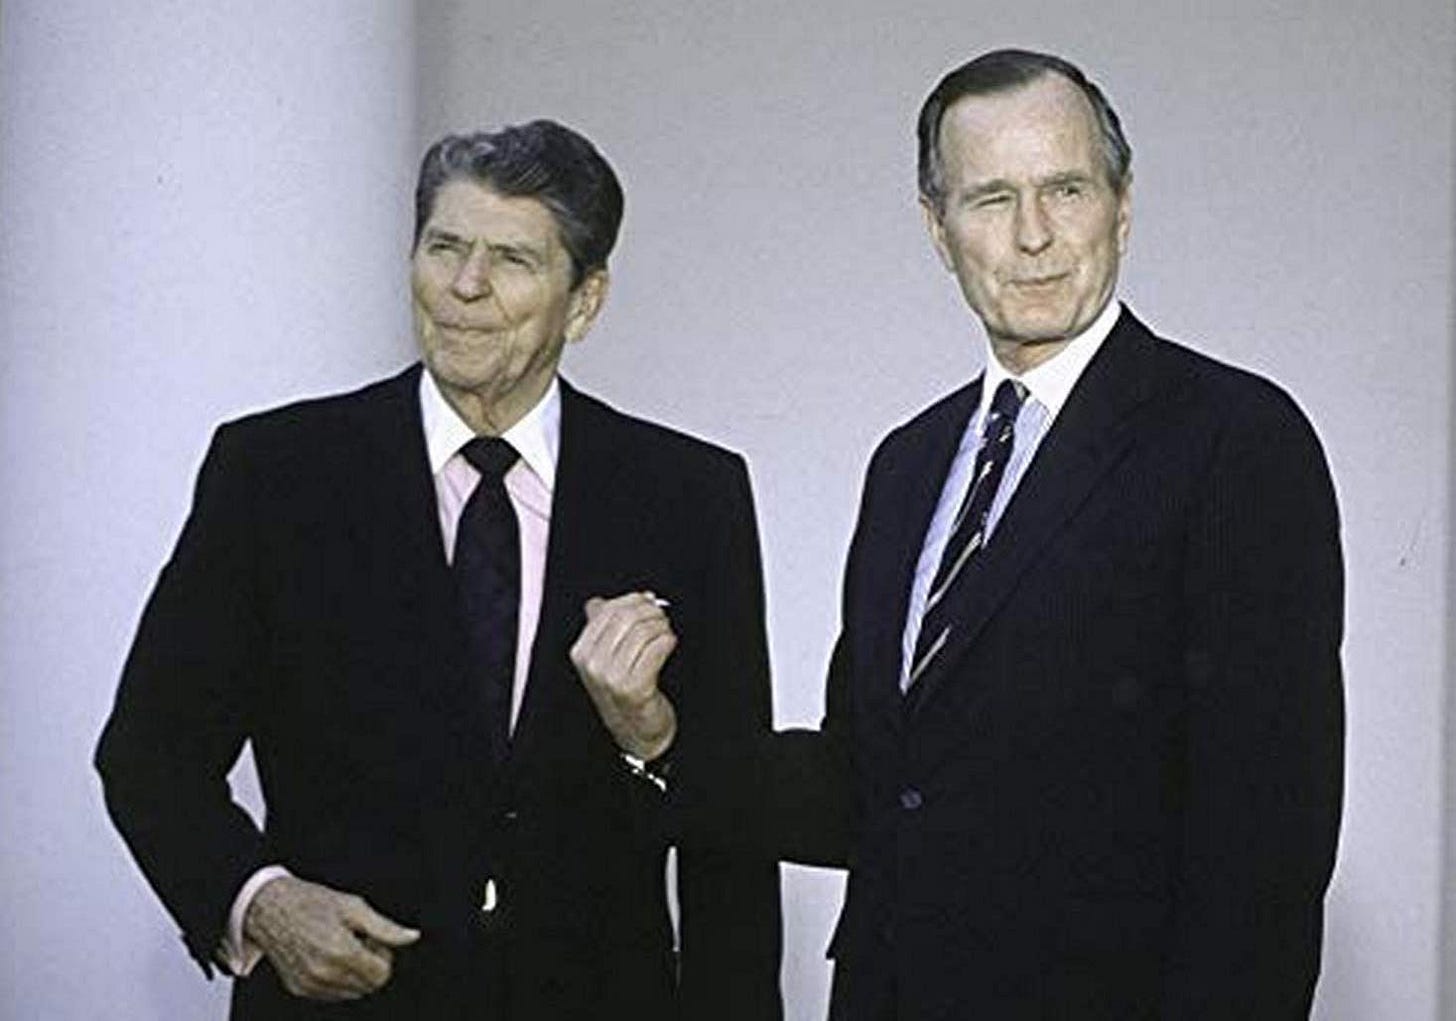
For 1989, the pace of the 2H89 swoon was memorable with the S&L meltdown as the headline winner. After his second term ended, Reagan left on a good note with a strong growth year under his belt. Bush inherited some credit risks that were simmering to the surface and would react more violently in 2H89 while equities still turned 1989 into what was mostly a conga line (+31% total return on S&P 500). The equity markets seem to not care about the credit markets. We saw that sort of lagged awareness around financial market risks in the following decade after a booming stretch in the 1990s.
As a reminder, the official end of the recession per NBER was March 1991 (note: they reached that decision in Dec 1992). Deciding the recession was over in March 1991 during Dec 1992 after an election (Clinton beat Bush with only 43% of the vote) needs a footnote. Given the catchy value of the phrase “It’s the economy stupid” that was in vogue at the time, we can say that waiting until Dec 1992 to announce the recession was over in March 1991 was a very “Cambridge thing to do” to a conservative Yale guy in Bush (NBER’s main office location was in the bastion of Harvard liberalism). George HW Bush could have used the phrase “end of recession” in his campaign.
The fed funds in the high +9% area in the spring of 1989 was consistent with the tendency in the Volcker years to “pile on” with fed funds well in excess of inflation. In this case in 1989, Greenspan followed this approach. In contrast, high positive real fed funds never arrived in the recent 2022-2023 inflation wave. The Fed took a long time to even reach positive fed funds in 2023 (see Fed Funds-CPI Differentials: Reversion Time? 10-11-22). After Greenspan arrived (August 1987), we see fed funds peak in the spring 1989 when CPI had hit the low 5% area.
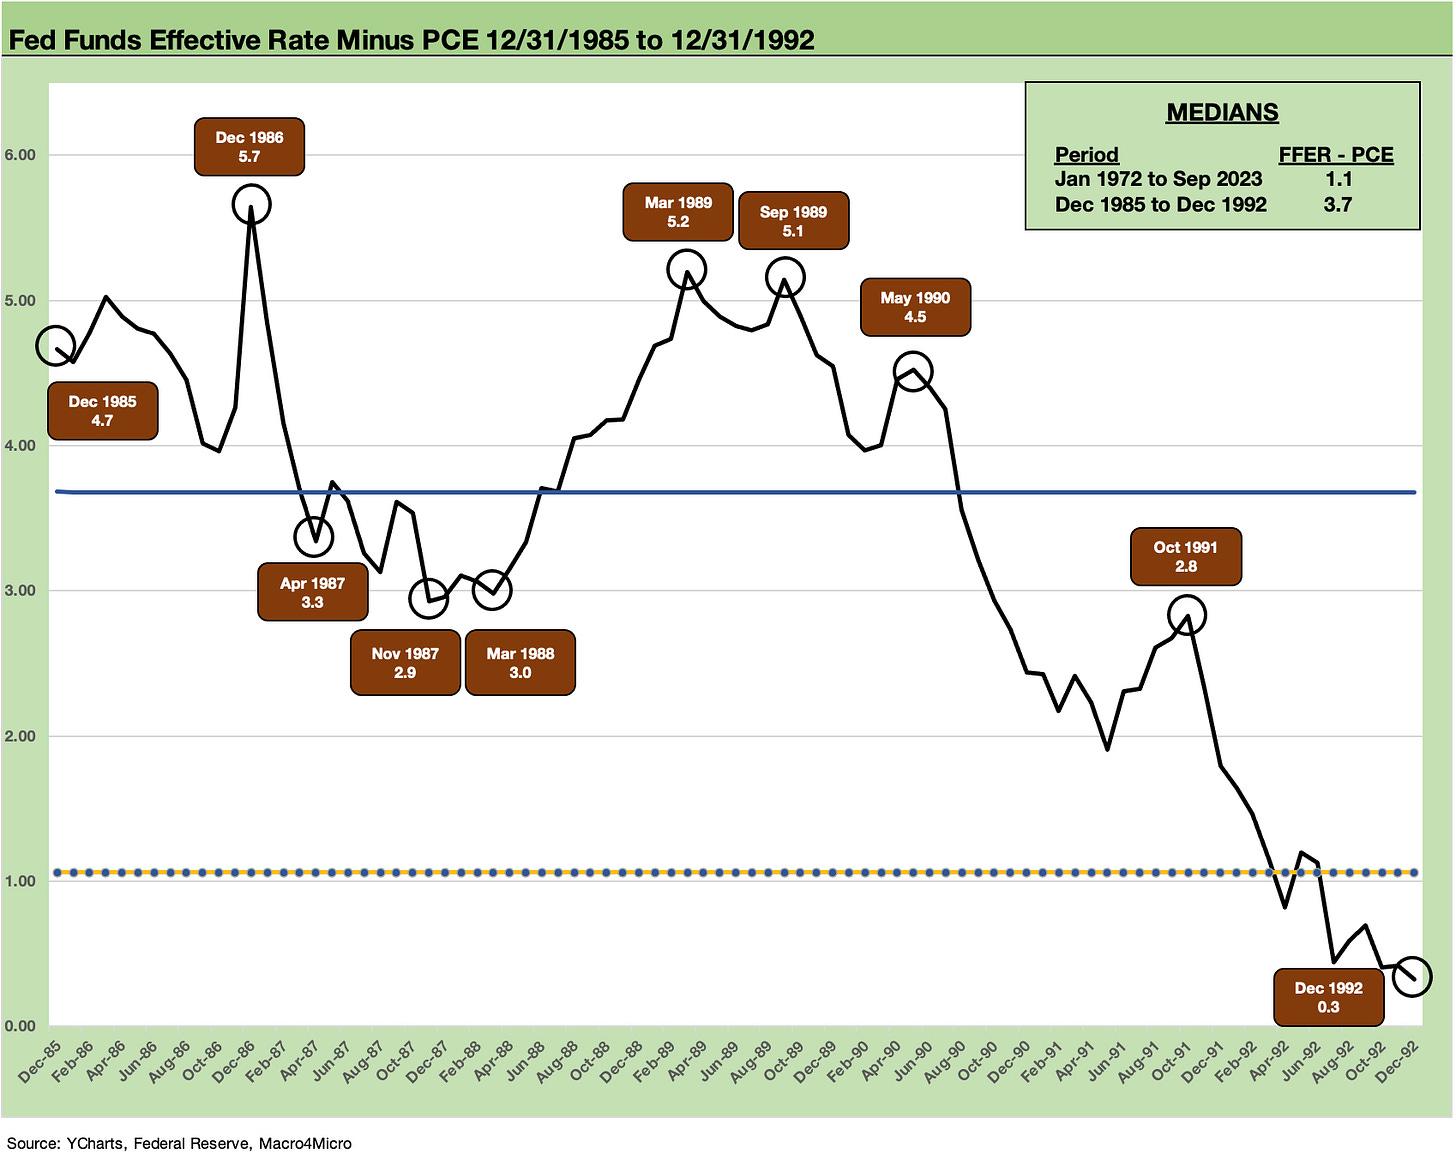
The above chart frames the relationship of fed funds vs. PCE across the time frame from 1986 to 1992. The timeline captures the differential between the effective fed funds rate (Source: Federal Reserve) and the PCE inflation across that period. We used PCE in this chart since is the Fed’s favorite metric.
As we have covered in our timeline lookbacks in other commentaries on fed funds vs. both CPI and PCE, the long-term relationship of the two shows a median of positive fed funds. The theory is that during times of economic shifts the relationship requires positive real fed funds to battle inflation and tighten and negative real fed funds is an accommodative policy.
The positive fed funds rule of thumb was not used in practice in this latest bout of inflation across 2022 into early 2023. That was a function of the Fed being late to the party on tightening, and thus being slow to get to positive real fed funds. The Fed was slow to exit ZIRP by March 2022 and slow to get to positive real fed funds for almost a year into 2023.
The substantial excess of fed funds over PCE seen through much of the 1980s as noted in the chart above is in excess of the long-term median of +1.1 points from 1972. The Dec 1985-Dec 1992 median of +3.7 points is a multiple of the long-term median. The market saw 2022 end with the fed funds – PCE relationship still in the negative zone (see PCE Inflation: Wild History, Recurring Oil Volatility 1-29-23). The fed funds target rate was finally ahead of the Core PCE line by Feb 2023 (see Personal Income, Outlays and PCE Prices: Calm Before Confusion 3-31-23). That was slow to happen as fed funds rose and inflation declined.
The very busy stretch from 1986 to 1992…
It is safe to say that there was a lot of action going on over just a few years back in 1986 to 1992 with a change from Volcker to Greenspan. The markets had seen a post-1982 bull market in equities at a time of explosive growth in the publicly traded corporate bond markets, the rise of HY bonds, and the capital markets wrapped in a period of unprecedented leveraging of corporate America.
By the end of the period in the chart, the market posted many records, many firsts, and a lot of new ground covered with the explosive expansion of the credit markets and financial products.
On the way to the transition out of the old cycle in 1990 and then into the new cycle (officially starting in March 1991), the market saw multiple financial crises (until that term “crisis” was redefined in 2008). The regional banks were hammered in the oil patch across 1987 and 1988. Banks were hit hard again later during 1990-1994 with regional banks on a broader scale getting crushed by commercial real estate.
Citicorp was in dire straits in 1990-1991 with commercial real estate the main threat. Between the 1989 swoon and the commercial real estate meltdown was the brokerage/securities industry crisis with bailouts (and bankruptcies) that we will cover when we look at 1990-1991.
The S&Ls/Thrifts faced multiple pressure points that started in the late 1980s and ran well into the post-1990 expansion. Thrifts brought the world some old school deposit runs that were revisited briefly in 2023 after SVB. The thrifts in the 1980s were battered by any combination of asset quality (notably in the oil patch) to deposit flight and disintermediation in the age of money markets. In some cases, the problem was just poor management, in some cases fraud, and a dose of inadequate regulatory oversight. People were sent to prison. The regulatory tendency to overcompensate after the fact brought a wave of seizures on the back of regulatory overhauls and pressures to act.
In our next commentary, we will look more closely at the adventures in financial system stress in 1990-1991. I had a ringside seat on one bailout as I sat at my desk on a weekend at Lehman Brothers and the bailout by American Express hit the screen. That made for a happier Monday.


