
Payroll June 2024: The Race Gets Confusing
We update the latest payroll trends and occupational deltas from a release that Trump and Biden clearly have never read.


Democrats divided on how fast to move.
We update the latest top down and micro level occupational payroll trends as jobs keep on climbing.
The story for June numbers was somewhat steady state but the April 2024 revisions make April the lowest month since the tightening cycle began.
We add a few comments on the paucity of facts and concepts on employment in the worst debate in history in a week where the Supreme Court made it easier for the Executive branch to “officially” mess with economic data in the future.
We cite some threats to macro data delivery, staffing, and quality based on the goals of Project 2025 for Dept of Commerce data and the BEA, etc. (Revisiting the “Where’s my sharpie!!” hurricane moment?)

The above chart updates the payroll deltas that keeps an impressive streak of adds going even after the downward revisions. There have been some painful swings in past cycles and notably so from the stagflation years of the 1970s (4Q73 to 1Q75) across the infamous double dip recession of the Volcker years (late Carter/early Reagan) and a brutal protracted jobs drought after the credit crisis. The COVID turmoil brought a wave of numbers we revisit in our JOLTS commentary each month (see JOLTS May 2024: The Jobs Oasis Still Has Water 7-2-24).
For June 2024, a 200K handle comes on the heels of some revisions that now puts April 2024 as the lowest job adds since the tightening cycle began in March 2022. The Job Openings have been slowly but steadily declining but are still above anything in the pre-COVID years. JOLTS showed 8.1 million in May while Trump’s peak was 7.5 million in Nov 2018.
Trump’s claim in the debate that all the job adds were simply recovered jobs from COVID gets low scores on his Math SATs since the total payroll count is well above his peak pre-COVID payroll tally by millions. If we look back at his “Greatest Economy EVER,” we will find two months in double digits in 2018 and one negative double digit month in early 2019. Later that year, the Fed eased 3 times on some weak macro trends (notably fixed investment and exports).
Some political = policy indulgence…
Since this week was the July 4th break, please excuse some sidebar commentaries on employment narrowly and some worries around the future of high quality, independent information from the government in the future. That includes data such as payroll and inflation. The Supreme Court tossed a pile of sodium in the troubled waters this past week that make such information quality even more worrisome.
The second part of the Trump jobs theme in the debate, in addition to the rebound of Trump jobs from COVID, was that anything extra was from “illegals” and the usual folks being emptied out of prisons. A Trumpian interpretation of this month’s job add could be that Cameroon just freed up some prisons and local nuthouse space, put them on a transatlantic freighter to Veracruz. There they would be greeted by a fleet of Biden-funded buses where they would be sent to swing states with fake documents that would allow them to vote multiple times. Makes sense, right? Only if you go to bed wearing a funny red hat.
Under Project 2025 (see Chapter 21 of that authoritarian-friendly tome), the Trump team is seeking to roll up and consolidate more aggressive, direct control of all Department of Commerce data, so this will not be a problem in the future. I guess the game plan might be the months for the Biden administration will likely be restated. They will be retroactively added to 2019 to help generate the “jobs boom” that did not happen. Fraudulent numbers will be ok. After all, it is an official duty to lie through your teeth.
A few tidbits from Chapter 21:
“As the office charged with providing policy direction and oversight for BEA and the Census Bureau, new leadership should take an early and active role within both bureaus.”
“A new Administration should ensure that BEA conducts its statistical analysis in a consistent and objective manner, with the Undersecretary for Economic Affairs taking a strong interest in BEA’s operations and data products…”
“A new Administration should also study the feasibility of merging all statistical agencies (Census Bureau, Bureau of Economic Analysis, and the Department of Labor’s Bureau of Labor Statistics, etc.) under one bureau…”
“…the transition and policy implementation process and will require that both committed political appointees and like-minded career employees are in immediately put in place to execute a conservative agenda.”
“Strong political leadership is needed to increase efficiency and align the Census Bureau’s mission with conservative principles.”
What that means in substance is Trump saying, “My information is my information and your information is my information. And I make up my information.”

OK enough with the weather report. Bring me the economic stats next. My Sharpie is running low on ink…
For those keeping score at home, Dictator 101 works like the checklist below. This one includes “control information” to undermine opponents and promote the Dictator. For real expertise in this area, we highly recommend a link to the Lucid Substack, by Ruth Ben-Ghiat.
Attack the media, undermine free press: Undermine factual information. Forget Ayn Rand and “absolutes.” Then again, facts are useful if you are not an idiot. They are readily available even if you think the reporter is struggling with a cosmetic overdose and burdensome wardrobe pressure. Jake Tapper and Dana Bash were riveting value-added in the recent debate (sarcasm intended).
Attack the Justice system: The need to erode the application of laws to the team of miscreants you have recruited – even very violent ones on high protein diets with a gun collection. This one is more easily achieved if you have a group of embittered Christofascists on the Supreme Court flying flags upside down and genuflecting before the power of their self-crafted sense of “God’s on my side” (History often shows both sides in a battle think that). Many in the US are unfortunately of the view that the Supreme Court is at war with the majority of US citizens (but to the Court’s Tyranny of 6 benefit, perhaps a minority of the electoral college). Having the court in your pocket helps in the long game. The short game comes when you retake control, and you have your handpicked DOJ enforcement allies work fast.
Undermine military leadership: Guys like Kelly, Mattis, and Milley needed to go. They “packed the gear” that helped Make America Great the old -fashioned way with the rest of the “losers and suckers” long before orange makeup and funny red hats became symbols for patriots (where was Trump in 1968 again?). Integrity and commitment to the constitution is the last thing you need in Generals who give objective advice and don’t kowtow to dictators, right? Yes-men march better when ordered (see European history in 1920s/1930s). Milley et al opposed Trump’s desire to stage Putin-style parades to himself and to unleash the US military on US citizens exercising their rights. That will change.
Control information: In order to use disinformation correctly, you need to also limit real information. That is where Project 2025’s Chapter 21 goals come in. Make sure data agrees with the desire of the Dictator (remember the infamous changed hurricane forecast and “Sharpiegate” with threats to fire meteorologists if they did not back Trump’s view of the hurricane path). The whole “Minister of Propaganda and Information” thing has some black marks in world history. We wonder what they come up with. As of this week, the President’s team can be ordered to say whatever he wants without any parties having legal right to any evidence.
Control the money: This last piece of the puzzle requires much more than the US Treasury. You need to control the Fed and be more exact in your regulatory targets of banks (that would be the major banks that stopped lending to Trump business lines). The WSJ leaked the story citing Trump’s aim to get direct control of monetary policy and subjugate the Fed and FOMC to the White House with direct review of policies. Just ponder a major real estate magnate with control of rates. Add tariffs plus enforced easing and the world could get downright interesting. The threats to the dollar and the stagflation risk would be very real.
This list goes on, but a great start is undermining the press, attacking the legal system, purging senior military, capturing the money, and controlling the information that is used in “accountability cycles” every 2-4-6 years for House, Presidents and Senators (We used to call them elections when most of the GOP was not afraid to recognize them).
The usual hyperfocus and targeting of external and internal enemies and the political intimidation game is already complete with the center right now a chained and trained group of whipped dogs. There were more 180s and 360s than usual – even for Washington.
A rational, intelligent patriotic center/right candidate could not make it through primaries. If in fantasy land that was possible, it would be Nixon 1972 and Reagan 1984 revisited (i.e. 49-1). The polar left and polar hard right is what we have now, but only one side is led by true students of dictatorial control and brute force in the US. The other side (the left) is as fragmented and disorganized as always.
Back to payrolls…

The above chart updates the payroll adds vs. the unemployment rate (U-3). We take out the COVID distortion to protect the utility of the visuals and put some of the peak COVID deltas in the box. The 4.1% ticked higher sequentially but remains well below the post-crisis time horizon median of 5.3%. The current unemployment rate remains closer to the multi-decade low than the median.
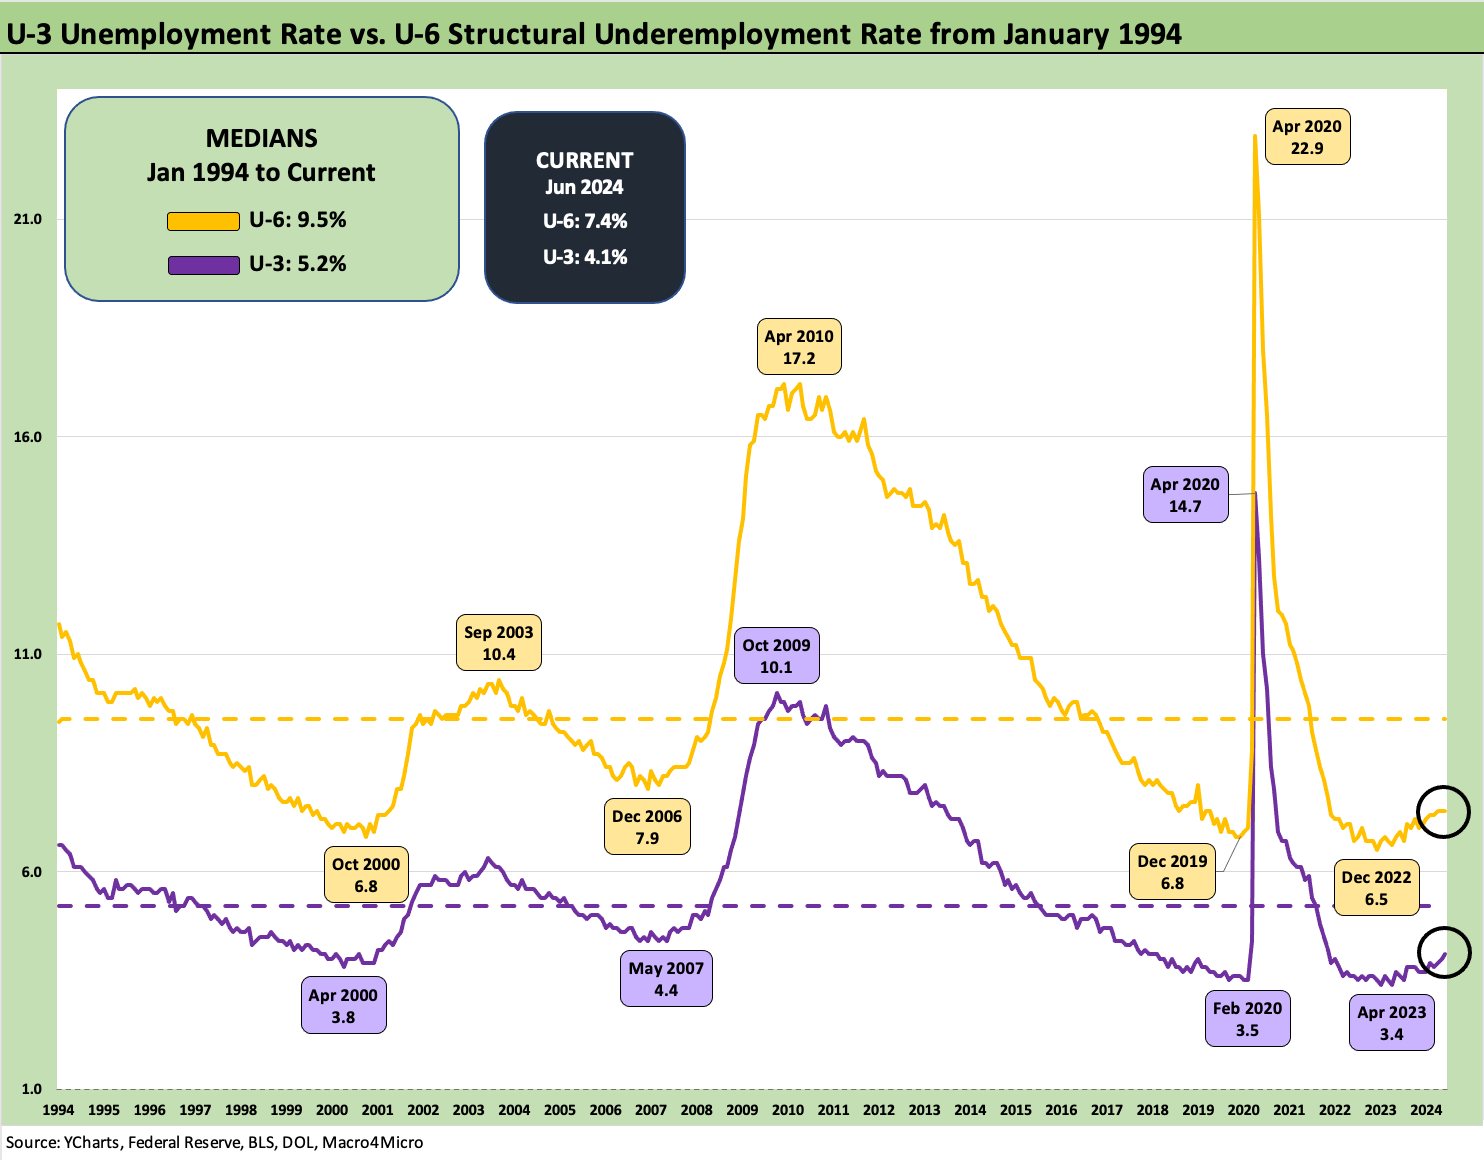
The above chart plus the standard unemployment rate (U-3) vs. the underemployment rate, the U-6. The chart details the low and high points since 1994.
As a reminder, the U-6 metric is defined with the numerator as “total unemployed + persons marginally attached to the labor force + total employed part time for economic reasons.” The denominator is “civilian labor force + workers marginally attached to the labor force.” The U-6 went sideways at 7.4% from April and May 2014 but remains above the 6.9% (SAAR) of June 2023 a year ago.

The above chart details the U-3 vs. U-6 differential. That differential gives somewhat of a “have vs. have-not metric” for labor. The current 3.3% is comfortably below the long-term median and just above the lows of the Trump years in Dec 2019. The low in this time series was 2.9% in Oct 2000 back when the capital markets were on the doorstep of an implosion and the “official” economic expansion was nearing an end in 2001. The 7% differentials back in 2009 and 2011 show how bad it can get during an economic hard landing. The COVID high above 8% came with an asterisk of the pandemic.

The above chart breaks out total payroll totals vs. the unemployment rate across the time period. The 158.6 million flows into the “Mo Jobs, Mo Money, Mo Spending” theme but the PCE trends of late are signaling slowing (see PCE, Income and Outlays: Practicing Safe Growth? 6-28-24, 1Q24 GDP: Final Cut, Moving Parts 6-27-24).
The homebuilders have also been showing signs that the mortgage rate levels are taking a toll on the “consumer expansion show” (see New Home Sales: Pumping the Brakes 6-26-24, Housing Starts May 2024: Starts vs. Deliveries Balancing Act 6-20-24). The 152.5 million number just before COVID shines a little light on the absurdity of some of Trump’s debate comments on employment under Biden and 6.1 million increases since Trump’s pre-COVID peak.
As we cover in the occupational deltas below, we are expected to believe that waves of Trump’s “illegals” have arrived in the US with a lot of highly skilled, English-speaking MS13 members filling the ranks of Construction workers and Smart Warehouse personnel. After all, face tattoos are a customer magnet.
As we covered in our recent analysis of state employment trends (see State Unemployment: A Sum-of-the-Parts BS Detector 6-30-24), the very strong economies of so many red states with near record low unemployment means they must be hanging out signs in those states “Bring us your huddled and heavily armed escapees from prisons and insane asylums. English language skills optional.” Does not seem too realistic?
The fact that Biden could not take Trump down easily on such a simple and grossly ignorant statement by Trump is a sign of how far Biden has fallen in terms of factual framework and ability to think on his feet. That leaves the candidate exposed to the worry of an emergency meeting with the Joint Chiefs on a critical decision requiring a working understanding of military logistics and geopolitical risk. The same worry is true for Trump of course given the type of Joint Chiefs he and his lapdog Secretary of Defense will appoint. Trump is watching Fox and not reading defense briefings. At least Biden would listen to a talented, dedicated and honest team of Generals. Trump? Not so much. He didn’t and he did not want any.
The Biden debate post-mortem is likely to lead to a change and raft of new questions in handicapping 2025 policy. The Supreme Court decision was this week and the debate the week before that and both already seem like a year ago. Trump is a consistent liar, and you know that fact on the way into the debate. A 6th grader in a school play can memorize a dozen lines. One for employment, one for economic growth, inflation, women’s rights, etc. That was more than a bad day at the office.
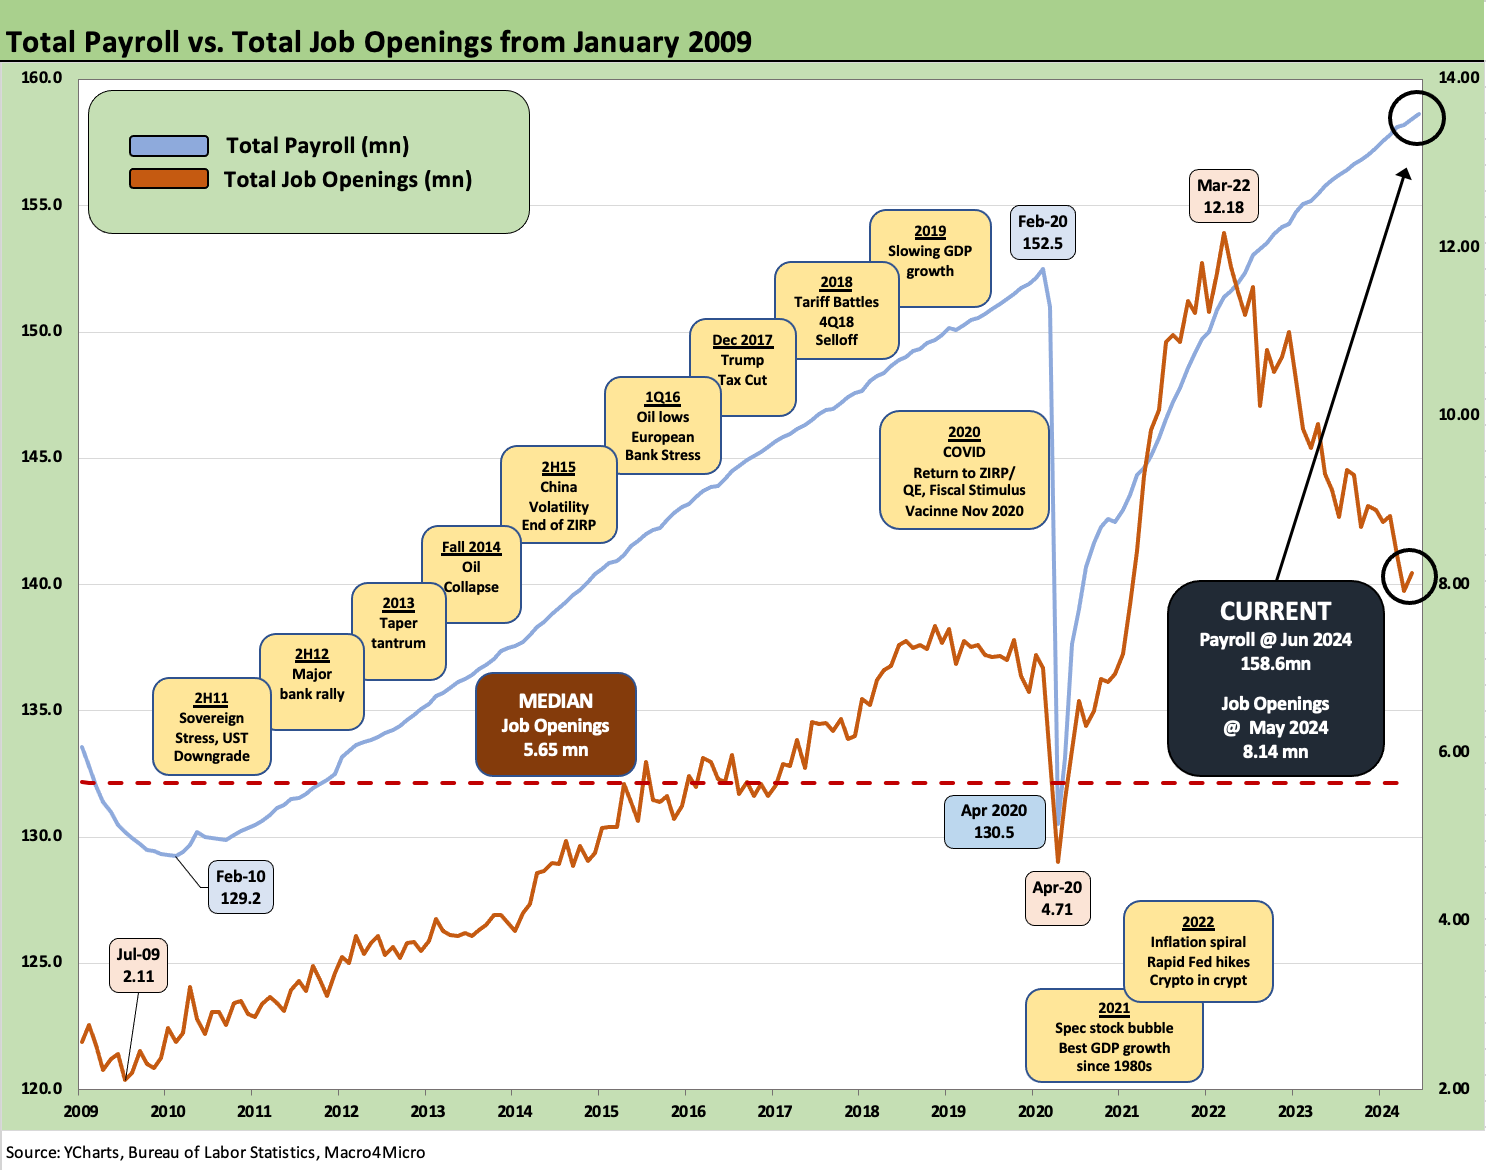
The above chart updates payroll totals vs. job opening from the JOLTS report. Job openings are supposed to go down as payroll gets added. As we covered earlier, even after the drop in job opening to 8.1 million since the peak of 12.2 million in March 2022, the current job openings total is higher than Trump’s highest (Nov 2018, 7.5 mn).

The above chart updates CPI vs. the unemployment rate back to 1972. The journey was an ugly one across inflationary markets. The Presidents to face the inflation battle included Nixon/Ford, Carter, Reagan, and now Biden. The highest unemployment rates were under Ford and Reagan, Obama, and Trump. The highest inflation was faced by Ford, Carter, Reagan, and Biden.
Trump blames inflation on Biden but gives himself a pass on COVID as if there is no connection. Unfortunately, the inflation topic did not get discussed factually or conceptually in the Presidential debate. The mental powers, factual grasp, understanding of economics or history has fallen off the cliff for Presidential candidates even just since Obama/Romney, and Obama/McCain. It’s painful to see with these two options.
Into the Weeds: The Occupational Jobs Mix and Payroll Deltas
The next section gets more into the line items as the market players wrestle with the quality of jobs and where demand is ebbing and flowing. State and local governments keep on hiring, and that always rises issuer for the multiple sets of books kept by so many politicians n how the national economy is doing relative to the roll-up of the states. It keeps getting stranger (see State Unemployment: A Sum-of-the-Parts BS Detector 6-30-24).

The above chart provides a top-level breakout of the payroll deltas and some key areas of private sector mix. Though a headline number of 206K is not too far below the longer-term median of 212K (since Jan09), this month’s mix sees only 136K private sector adds vs. 70K Government adds. This month continues a trend in the last year that sees Government payroll outpacing growth for the private sector at 2.7% vs. 1.5% LTM, respectively. The headline numbers this year have been favorable and showing continued payroll growth, but when comparing with the trend since the pre-COVID era, there has been a large shift in the underlying mix where that growth is coming from.
On the other hand, a continued lack of Manufacturing growth but strength from Construction played out for another month. The latest durable orders data reflected future weakness in durables manufacturing (see Durable Goods: Playing Defense 6-27-24), which could precipitate even more hiring weakness in the months to come. The ISM numbers broadly this week we unfavorable, so there will be more discissions beyond the consumer and PCE. Hiring is suppose to get checked in here at some point.
Though weakness in private sector data may be used as evidence of deceleration of the economy, the overall picture is still impressive. The private sector crests over 6mn job adds since the pre-COVID times with the 136K this month and 2mn of those are in the LTM period alone. That is still a lot of jobs and signaling a healthy economy. That also does make life easier for the Fed.

The above chart updates MoM payroll changes for main occupation lines that we track. The +212K median job adds per month vs. 206K added this month is a reminder that even if mix is showing some signs of weakness, it is not far from the typical month.
Health Care and Social Assistance and Government add up to 152K of the 206K overall adds this month. Rounding out the Top 3 with Construction brings us to 179K, which is 27K short of the total for the month. Healthcare is very much driven by demographic trends that continue to be a steady tailwind even as other areas falter. We will cover Government in more detail in its own dedicated chart but this month is significant growth driven primarily by State and Local jobs adds.
Over on the far left of the chart, we see 4 negative industries this month. Administrative and waste services is the outlier at -43K jobs. That line falls under the Professional and business services section and covers work not only covers office admins, janitors, and custodians, but also security services and hiring among others. As detailed below, this sector had already seen slow growth in the past few years and stands out as a rare negative in the services lines.
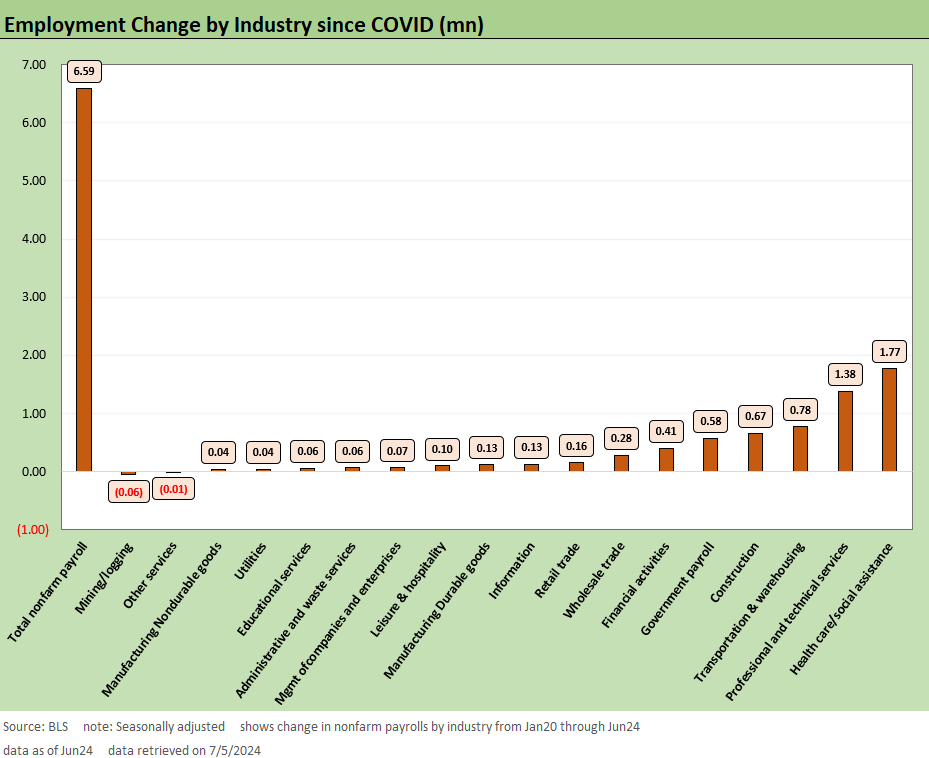
The next chart is a reminder of the changes since Jan20 as a pre-COVID marker and breaks out the almost 6.6mn payroll adds into the same major categories as above. This month does not shake up the longer term look here but it is a good reminder of pretty extraordinary growth in Construction as well as Transportation & warehousing. The strength of the construction boom continues to impress while the growth of Transportation & warehousing is much more about the evolution of industry for the post-COVID world.

The above chart details private Service-Providing jobs that covers 113K out of 135K of the overall private payrolls picture. Growth of 117K is below the LTM average and weighed on heavily by the 43K decline in Administrative and waste services that we discussed earlier. That -43K brings the LTM total to -150K in the LTM period and has reversed a lot of the post-COVID growth there.

The next chart covers the manufacturing story with a focus on Durables and tells a very different story than the above one covering services. The YTD number totals -10K after dipping another -8K this month and with the Durables picture looking even worse at -20K YTD and -10K MoM. Motor vehicles is a bright spot here as well as “Other Transportation Equipment” but almost all of the other Durables line items are in the red for the YTD period. The story is similar when zooming out with 10.4% growth since pre-COVID for Motor vehicles driving strong overall Transportation growth. The remainder of the Durable goods come up to a net negative with particular weakness for the Furniture and related products line.

The above chart is more bad news looking at the Nondurables piece of manufacturing even if June was positive at 2K adds. The LTM number is still negative and we see post-COVID growth only in Food manufacturing, Chemicals, and the Miscellaneous line. These are already small industries that are only continuing to shrink as their secular decline continues.

Construction payrolls are outlined in the above chart as one of the sectors that has remained resilient the past year. The pendulum has swung more towards nonresidential in the LTM period vs. Post-COVID and that continued this month as well. The broad mix still is positive across the board and is good news as a signal of both project investment and economic activity.

The final chart covers the Government payroll where State and Local government jobs see even more MoM growth. Notably the explosive growth in the LTM period makes up the entirety of the post-COVID growth (plus a little more).
Contributors:
Glenn Reynolds, CFA glenn@macro4micro.com
Kevin Chun, CFA kevin@macro4micro.com
See also:
JOLTS May 2024: The Jobs Oasis Still Has Water 7-2-24
Footnotes & Flashbacks: Credit Markets 7-1-24
Footnotes & Flashbacks: State of Yields 6-30-24
Footnotes & Flashbacks: Asset Returns 6-30-24
State Unemployment: A Sum-of-the-Parts BS Detector 6-30-24
The Debate: The China Deficit and Who Pays the Tariff? 6-29-24
PCE, Income and Outlays: Practicing Safe Growth? 6-28-24
HY Spreads: The BB vs. BBB Spread Compression 6-13-24
HY Spreads: Celebrating Tumultuous Times at a Credit Peak 6-13-24
Trade Flows: More Clarity Needed to Handicap Major Trade Risks 6-12-24
Miscellaneous histories:
Systemic Corporate and Consumer Debt Metrics: Z.1 Update 4-22-24
Credit Markets Across the Decades 4-8-24
Credit Cycles: Historical Lightning Round 4-8-24
Histories: Asset Return Journey from 2016 to 2023 1-21-24
HY vs. IG Excess and Total Returns Across Cycles: The UST Kicker 12-11-23
US Debt % GDP: Raiders of the Lost Treasury 5-29-23
Credit Performance: Excess Return Differentials in 2023 1-1-24