
Footnotes & Flashbacks: State of Yields 7-14-24
Another favorable UST curve move has tangible support across more CPI lines, and we now see more focus on near term UST curve shapeshifting.


“I thought we were going to take the high road and show national unity now?”
We update the latest UST moves as the inversion from 2Y to 10Y gets reduced again with favorable CPI raising expectations for more cuts ahead.
Lower short rates could lower funding costs at banks and support consumer financing of purchases in major segments such as new and used vehicles.
The trickier part of the analysis is making the call on a sustained move in longer maturities such as 10Y that can bring 30Y mortgages lower.
Data dependency remains the name of the game even if the game is now more about how many cuts by year-end, with rising odds of a September cut.
Retail Sales, Industrial Production, and Home Starts come this week along with a fresh round of important bank/finance earnings that should help in framing consumer trends.

Note: As a reminder, we recently split out the Credit Markets portion of the weekly Footnotes & Flashbacks into a separate publication (starting 6-23-24). We now have weekly comments on Asset Returns, State of Yields, and Credit Markets.
Yield curve context across critical times in history…
The above chart updates the current yield curve in the context of notable past cycles and time periods from the late 1970s (the inversion of 1978) on across the Volcker inflation fighting years and into the secular downshift in UST rates after the 1989 credit cycle peak (9% handle 3M UST). We detail the yield for each curve in the embedded box.
In terms of the inversion mix in late stages in the credit cycle, we see the end of the TMT cycle (2000), the housing bubble and peak of excess in mortgages and structured credit (2006) and the more recent post-ZIRP UST peak (Oct 2023). The overall history highlights that rates in absolute terms today are quite low in context outside the post-crisis ZIRP and slow normalization markets. That is especially the case further out the curve.
We like to open with the historical lookback at the UST curve across the cycles as frames of reference on what is “high” or “low” in context. We are coming out of the other side of the first inflation cycle and Fed inflation war in over 40 years. We also now just had the first very close call assassination attempt on a Presidential candidate/former President in over 40 years since Reagan in 1981 (we exclude the 2005 attempt on George W. Bush in Tbilisi since a thrown hand grenade missed by wide margin). History has some good and bad times. Many will not answer what kind of times we have now until after the election.

The above chart compares today’s curve to the peak of 10-19-23 (peak 10Y date) and where the ensuing rally left the UST at 12-31-23. The story started this year with an adverse move for duration to give back a portion of that rally. The past few months have retraced some of the YTD negative shift. That now leaves the curve closer to 12-31-23 than 10-19-23.
The 10Y UST delta from 12-31-23 to 7-12-24 is down to +30 bps vs. +3 bps on the 3M UST and +22 bps on the 2Y. The net effect from 10-19-24 is -80 bps on the 10Y and -69 bps on the 2Y UST.

The above chart updates key dates across the tightening cycle, including a memory jogger for dates and details of FOMC actions. It provides a visual for how we got to today’s inversion and with the market seeing the first cuts coming soon. Sept appears to be the odds-on favorite. The July meeting of the FOMC will deliver some color, but a July move might be a hard case to justify. The PPI was less supportive than CPI.
Rate cuts mechanically will lead to less of an inversion, but the action further out the curve will dictate the next leg of UST shapeshifting and how that flows into mortgages and corporate refinancing and extension.
The similarity of the 12-31-22 and 12-31-23 curves at the long end provide a recent data point on how that part of the curve responded to a 100bps rise in fed funds. If the opposite holds true (i.e. longer end is not as sensitive to cuts), then the next leg of shapeshifting could just be a bull steepener with long rates holding relatively static.
The fact is we had one major rally in the 1Q23 period tied to the regional banking crisis that brought the curve down from year end 2022. Despite 100 bps of hikes from the end of 2022 through July 2023, we still saw the 12-31-22 and 12-31-23 longer maturities converge.
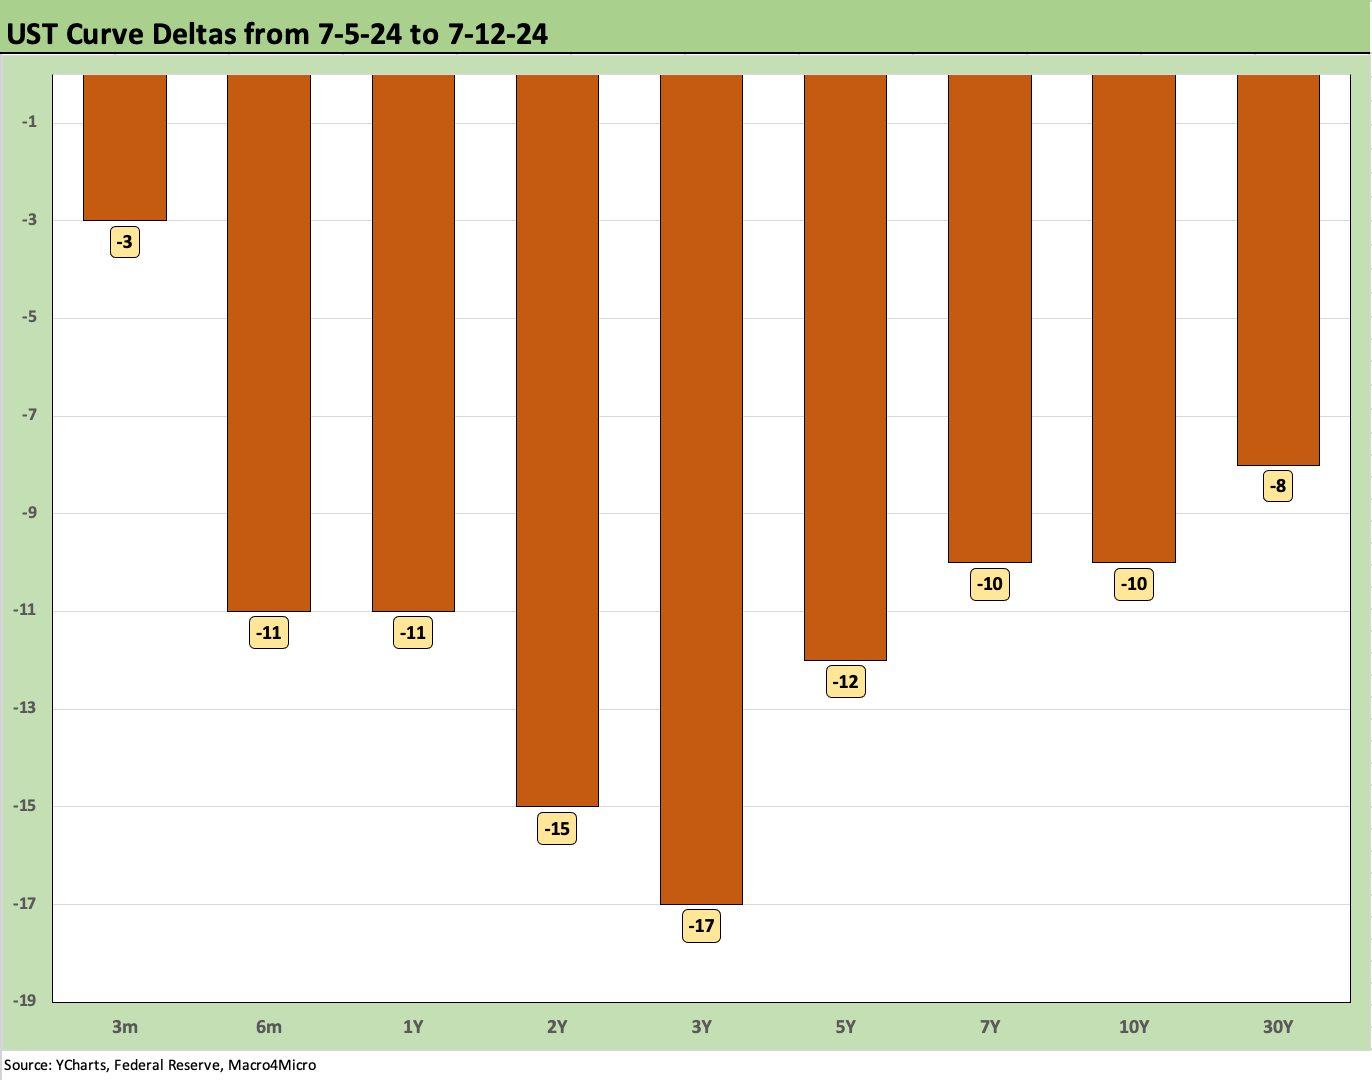
The weekly UST deltas above show another favorable shift with mostly double-digit declines across the board. As we have already covered in Asset Returns, bond ETFs had a positive week with longer duration winning out.
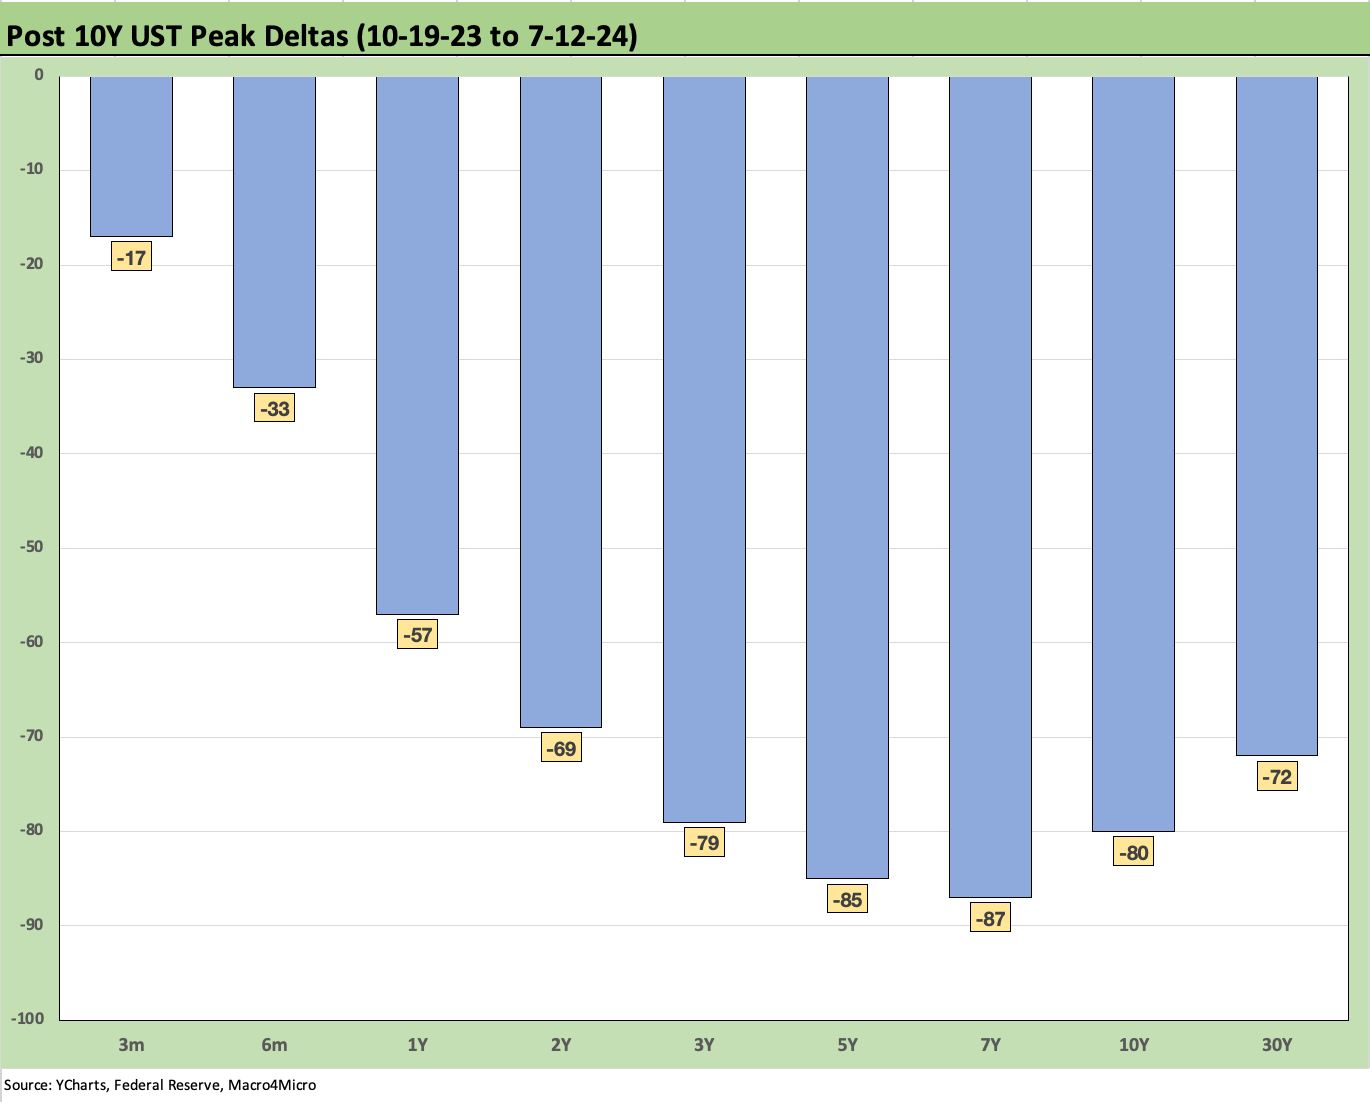
The above chart offers another visual on the running deltas from 10-19-23 to Friday close (7-12-24). The inversion move is quite prominent with the FOMC anchoring the front end.
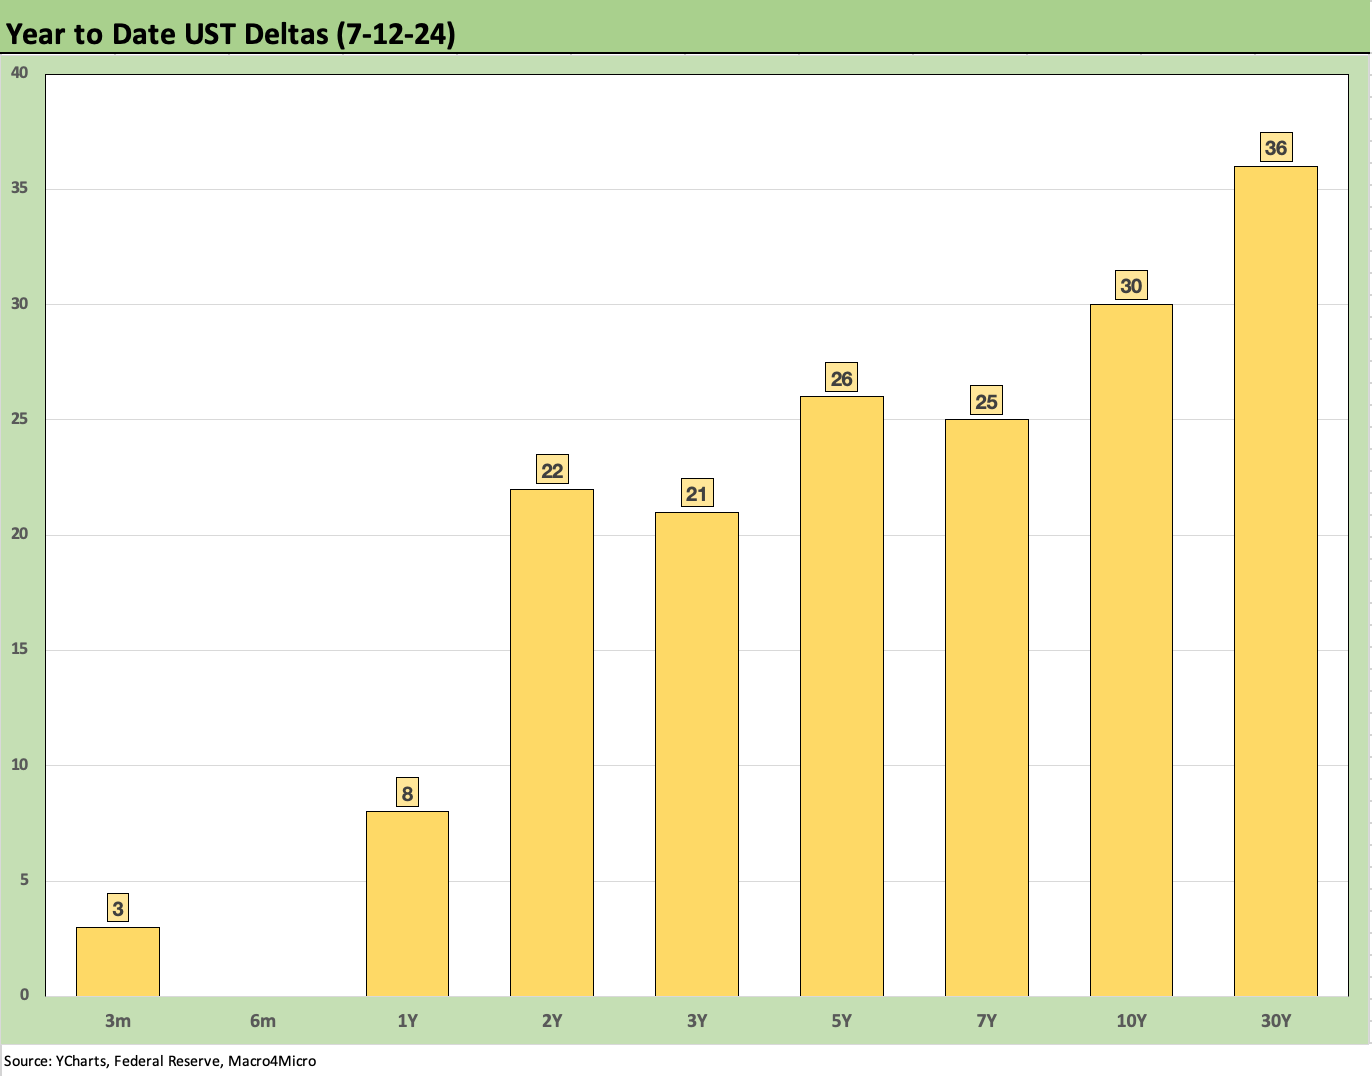
The above chart is a visual that captures the YTD deltas that have kept longer duration bond returns in check for 2024. The long duration 20Y + UST ETF (TLT) generated a YTD total return of -3.1% YTD, so it has been a struggle.

The above chart updates the Freddie Mac benchmark 30Y and also plots two major historical comps in the horizontal lines. We also include the end of the peak homebuilding year of 2005 and the period that saw the start of the mortgage quality anxiety in mid-2006. We plot the UST curves for each of those dates as frames of reference.
With respect to the critical 10Y maturity that drives the 30Y mortgage, the 10Y is materially lower on this past Friday than those earlier dates. In contrast, the 30Y mortgage rate of 6.89% as of this past Thursday (down from 6.95% last week) was the highest of the three dates. While the Freddie benchmark is a Thursday event, the mortgage trade rags for various 30Y mortgages on Friday showed some mid to high 6% range (with varied conditions and terms across those posted). There is a long way to go to get 30Y mortgages in a sweet spot even into the high 5% range.
Today’s mortgage rates are still not that far off from periods with very strong housing demand in 2005 and 2006. We already covered how this week’s CPI news flowed through to the homebuilders (see Homebuilders: Equity Performance and Size Rankings 7-11-24, Homebuilder Equities: “Morning After” on Rate Optimism 7-12-24). We also considered where the transmission of FOMC cuts may not pass through to mortgage rates to the extent the market may hope.

The above chart plots the 2Y to 10Y UST slope since 1984. The most recent -27 bps inversion is well down from the -108 bps inversion in early July 2023 shortly before the last hike. The long-term median is +94 bps across that timeline.
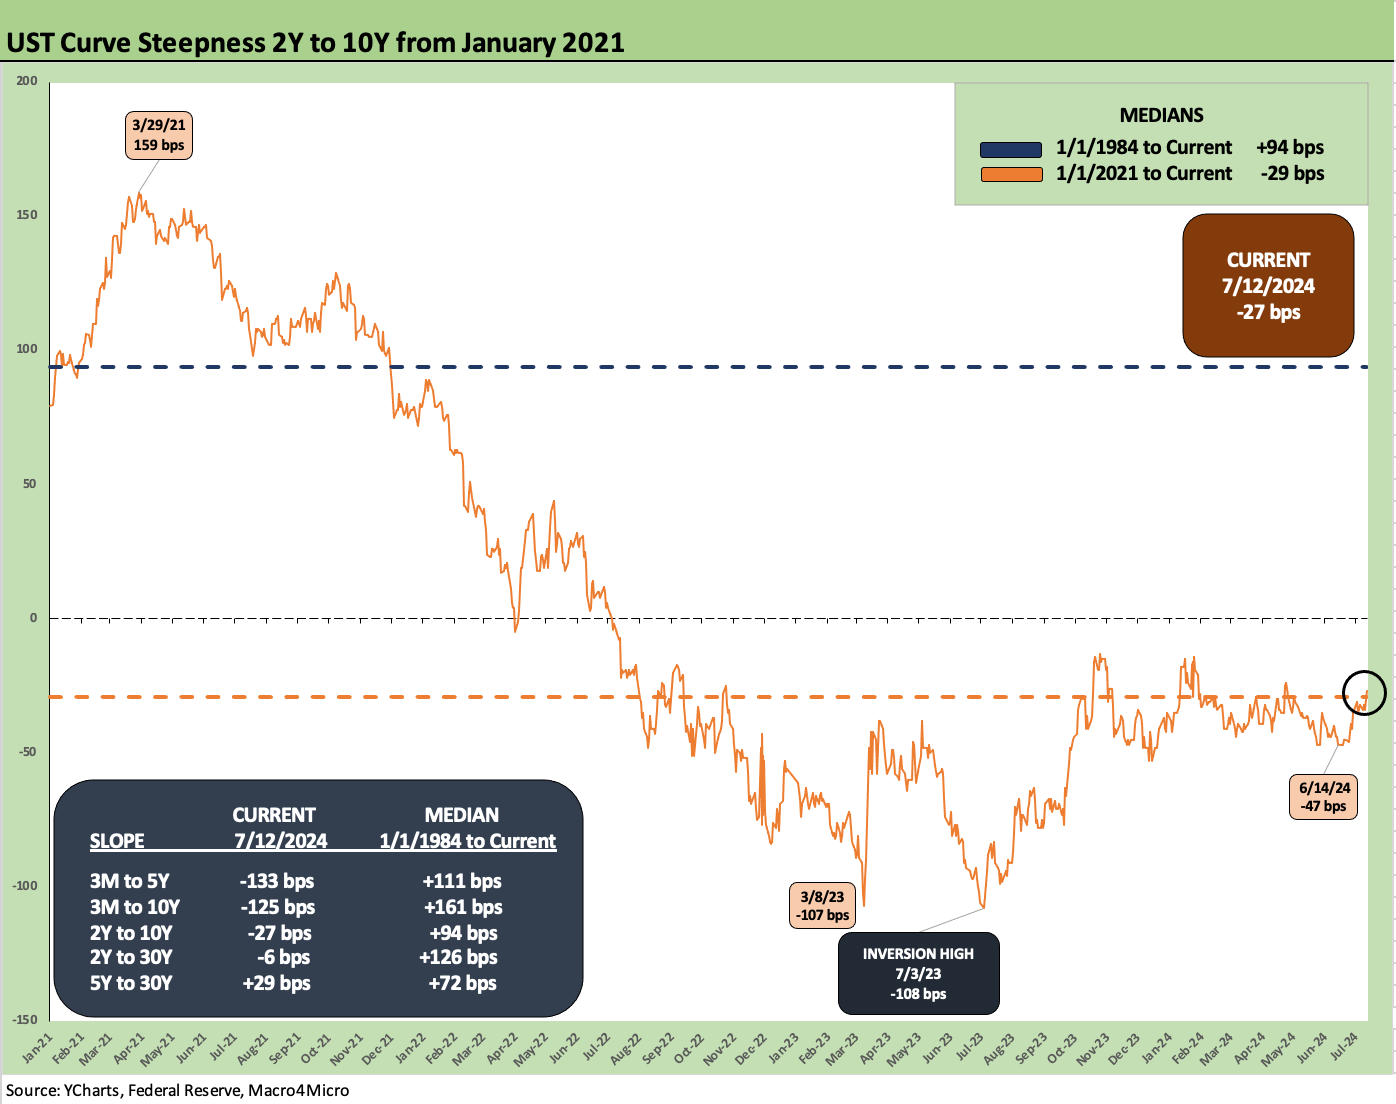
The above chart shortens the time horizon to a Jan 2021 start date to show the move from a ZIRP market and then into the tightening cycle and peak inflation period of mid-2022. That has been followed by the slow and steady decline of inflation as the FOMC tightened.
We see the upward slope peaking in March 2021 at +159 bps on the way to a plunge into spring 2023 and July 2023. The 2Y to 10Y inversion is now lower by 20 bps since mid-June 2024
While the jury will remain out on the impact of any FOMC cuts on the 10Y, the 2Y should be more sensitive and a path lower for this segment of this curve could bring a flat or upward sloping curve beyond 2Y.

The above chart wraps with the running UST deltas from the start of March 2022 (ZIRP ended effective 3-17-22) through this past week. We also include the 12-31-20 UST curve and 10-19-23 peak date (10Y UST peak).
We break out the deltas in the chart in what has become a bear inversion from March 2022 to July 2024. During that inversion, we regularly saw predictions of recessions but also statements that the recession had already arrived. In fact, that recession never did show up.
Recent events and handicapping “where from here” on politics and policy…
The politics and connections to policy from this latest episode of political violence and how that might influence elections and market risk factors is for another day. As someone who remembers the delivery guys saying “turn on the TV, someone shot Kennedy” (John) then on across the little league years of 1968 with RFK and MLK, George Wallace in the primaries in 1972 in high school, the attempt on Ford by a Manson family member (Squeaky Fromme) in 1975, and Reagan being seriously wounded in 1981, it is safe to say that the US has not evolved much.
The US is just more open about its violent culture and balkanized mentality. That said, no one rejected elections, and no one applauded extreme political violence in those earlier days. The idea that a Presidential candidate winged in an assassination attempt will change the behavioral patterns that have allowed for the rejection of elections and rise of violent, armed protestors sacking the capitol is very optimistic.
If we had to put our chips down on the election needle moving, we would argue Trump’s odds just went up on a range of human nature factors. One theory is that Trump can take the high road, and Biden will have to dial back his attacks on Trump as a fascist threat to Democracy. Trump can let the lackey collection handle the ugly stuff. Biden and Trump get more civil at one level, but then Biden has lost his material. Game over. That is one theory.
Slimy is as slimy does…
There is no question the process will stay ugly. We already saw Sen. Vance within minutes essentially saying Biden pulled the trigger (“Biden campaign…rhetoric led directly to President Trump's attempted assassination.”) Then Sen. Scott of South Carolina weighed in: “This was an assassination attempt aided and abetted by the radical Left and corporate media incessantly calling Trump a threat to democracy, fascists, or worse.” Then Congressman Mike Collins of Georgia notched it up the same way (“Joe Biden sent the orders.”). He wants Biden arrested for inciting an assassination.
As analytical input goes on predicting behavioral change, this is not a tough call. When you call Biden and his supporters “Fascist, Marxist, Socialist, radical left dangers to democracy” is that any different? Trump does tend to exhaust his vocabulary (not too sure he read up on those topics, but he made a projection list).
There was a lot more of the same already out there even if we leave out the usual freaks in the House (MTG, etc.). Many were probably kicking back and drafting messages listening to the J6 choir. Maybe under a Confederate flag for some. Maybe they are exchanging jokes about Pelosi’s husband who also might have died as a result of politically violent rhetoric. Something MAGA crowds have had a good chuckle over (see Trump and Kari Lake clips).
Below is a classic set of tweets by one of this group (Capitol building residents all!):
X Post: “They first tried to silence him by removing him from Twitter. Then with gag orders. Finally with a bullet.”
My question: Who was “they” again? And when was Trump ever silent? I missed that part. A few small pieces of his content were simply outsourced to other great minds of Washington.
X Post: “No weapon forged against you will prevail, and you will refute every tongue that accuses you. This is the heritage of the servant of the Lord, and this is the vindication from me declares the Lord.” Isaiah
My question: Then why did Trump dodge the draft with bone spurs in 1968? He was safe!
The bottom line is that the odds of a tariff-laden, budget-crushing, civil-rights-eviscerating, deportation-turbocharging set of policies are now much higher. The idea of some people thinking Biden wanted this seems to miss the reality that this is now a home run for Trump. A 4-bagger grand slam jog. Trump and the country were lucky the shot missed, but he will use this to full advantage.
We are greatly relieved that another rabid, deranged loser missed the shot, but do not expect any “rise above it” moments with political crews like those above. Two of them had even been part of the VP sweepstakes. Some conspiracy nuts think it was a right wing move to get more support for the GOP and sweep the ticket and unleash Project 2025 while co-opting the cult for an institutionally sustainable effort engineered by dark right-wing forces. The immediate reaction was that he was an incel liberal. Then he was in the GOP. The details are dribbling out. The story of this latest heavily armed shooter will get fleshed out in time.
For the most obvious explanation, this is just one more example of a crazed, lost soul able to get his hands on an AR-15 with a little less difficulty than getting Mom’s or Dad’s car keys. In some cases, it is as easy as getting a gallon of milk. Another gun freak in an increasingly violent society where people spend too much time polishing their ammo to feel important by way of being deadly. As a reminder, Ronald Reagan favored banning assault rifles. (RINO material?).
Contributors
Glenn Reynolds, CFA glenn@macro4micro.com
Kevin Chun, CFA kevin@macro4micro.com
See also:
Consumer Sentiment: Still Feeling the Heat 7-12-24
Homebuilder Equities: “Morning After” on Rate Optimism 7-12-24
Homebuilders: Equity Performance and Size Rankings 7-11-24
CPI June 2024: Good News is Good News 7-11-24
Credit Crib Note: KB Home 7-9-24
Footnotes & Flashbacks: Credit Markets 7-8-24
Footnotes & Flashbacks: State of Yields 7-7-24
Footnotes & Flashbacks: Asset Returns 7-7-24
The B vs. CCC Battle: Tough Neighborhood, Rough Players 7-7-24
Payroll June 2024: The Race Gets Confusing 7-5-24
JOLTS May 2024: The Jobs Oasis Still Has Water 7-2-24
Footnotes & Flashbacks: Credit Markets 7-1-24
State Unemployment: A Sum-of-the-Parts BS Detector 6-30-24
The Debate: The China Deficit and Who Pays the Tariff? 6-29-24
PCE, Income and Outlays: Practicing Safe Growth? 6-28-24
Trade Flows: More Clarity Needed to Handicap Major Trade Risks 6-12-24
Miscellaneous histories:
Systemic Corporate and Consumer Debt Metrics: Z.1 Update 4-22-24
Credit Markets Across the Decades 4-8-24
Credit Cycles: Historical Lightning Round 4-8-24
Histories: Asset Return Journey from 2016 to 2023 1-21-24
Credit Performance: Excess Return Differentials in 2023 1-1-24
HY vs. IG Excess and Total Returns Across Cycles: The UST Kicker 12-11-23