
CPI June 2024: Good News is Good News
The June CPI moved on from relative absence of bad news to outright good news in the inflation metrics, and the UST market agrees.


The headlines were favorable for June 2024 and the underlying data has plenty of lines to bolster the “ease crowd” with headline CPI at +3.0% (down sequentially from +3.3% in May) while Core CPI was +3.3 (down sequentially from +3.4%).
Energy was a big help in the headline numbers and Goods (notably new and used vehicles) supported the CPI and Durables deflating yet again with Nondurables deflating MoM again in June.
The CPI-ex aggregates had some good news with “All items less shelter” at +1.8% and deflating MoM in June as well as May with “All items less food, shelter and energy” at +1.8%.
The horsefly in the ointment remains “Services” CPI in total at +5.0% with no recent MoM deflation moments, and “Services less energy services” at +5.1%.
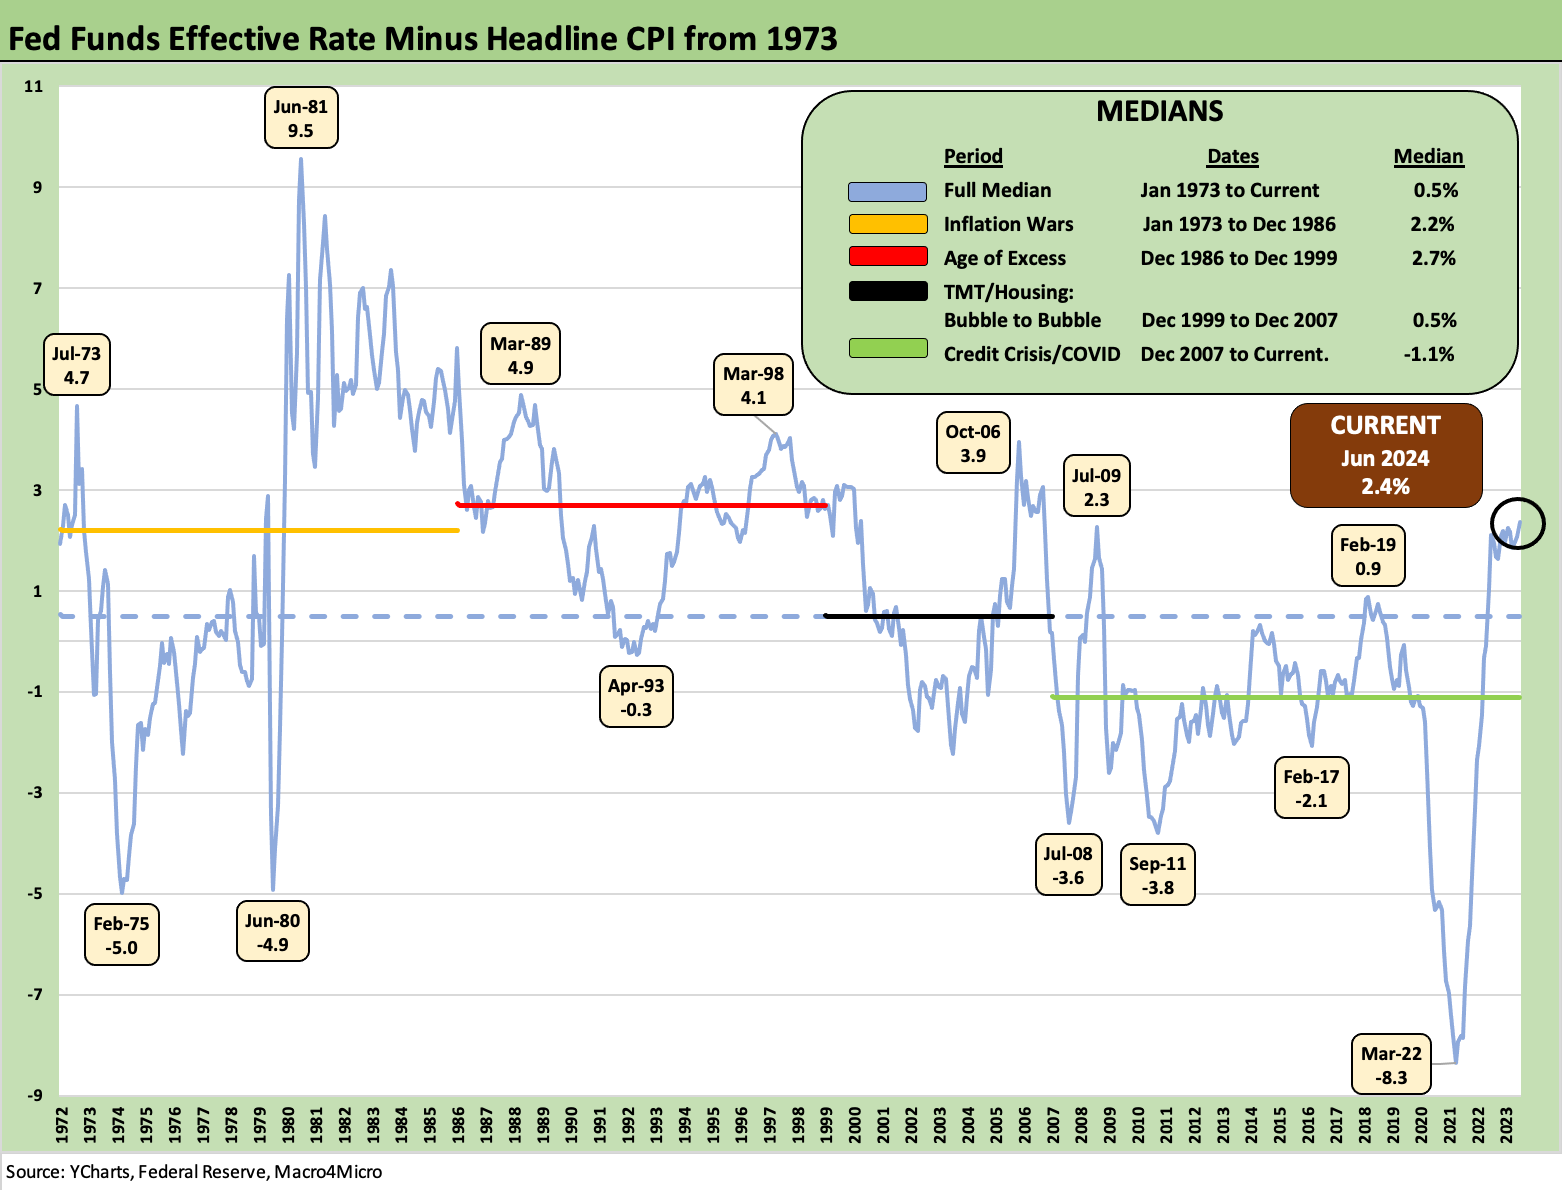
The above chart covers “real fed funds” for an update we more routinely include with the monthly PCE price index release (see PCE, Income and Outlays: Practicing Safe Growth? 6-28-24 ). We thought it added some story value with CPI this month. The old school view is the FOMC is in accommodation mode unless fed funds exceeds inflation. The above chart highlights that the effective fed funds rate posted by the fed each day is now at a +2.4% differential to headline CPI. That +2.4% frames up well vs. the medians that we break out in the chart including the median for the “inflation wars” of 1973-1986 when the median was +2.2%. The long-term median for the differential is +0.5%. The history of aggression under Volcker is clear enough in the time series but inflation was much higher and the fear of a relapse lasted well into the 1980s.
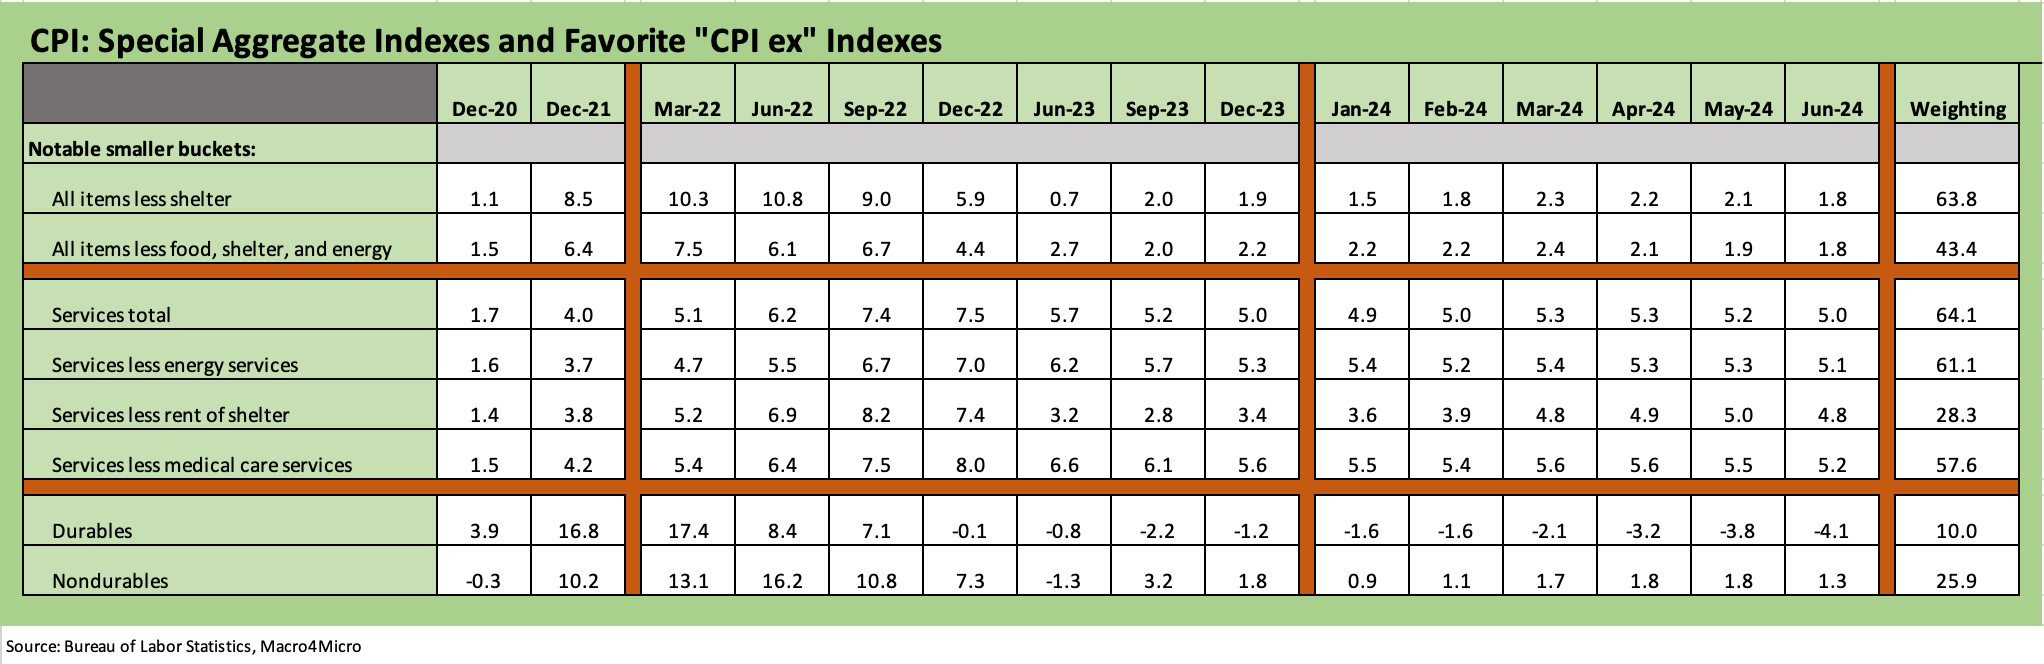
The above chart breaks out some special aggregate CPI lines that the BLS delivers each month (Table 3). The various cuts show favorable metrics for numerous buckets with CPI ex-Shelter an important focal point for anyone who questions the utility of the Owners’ Equivalent Rent (“OER”) number that is almost 27% of the CPI index (detailed below). The unfavorable lines are tied into the Services lines with too many 5% handles for comfort. The ability to ease has a better case from the Goods lines and a range of line items in the ex-Shelter services categories as detailed below.
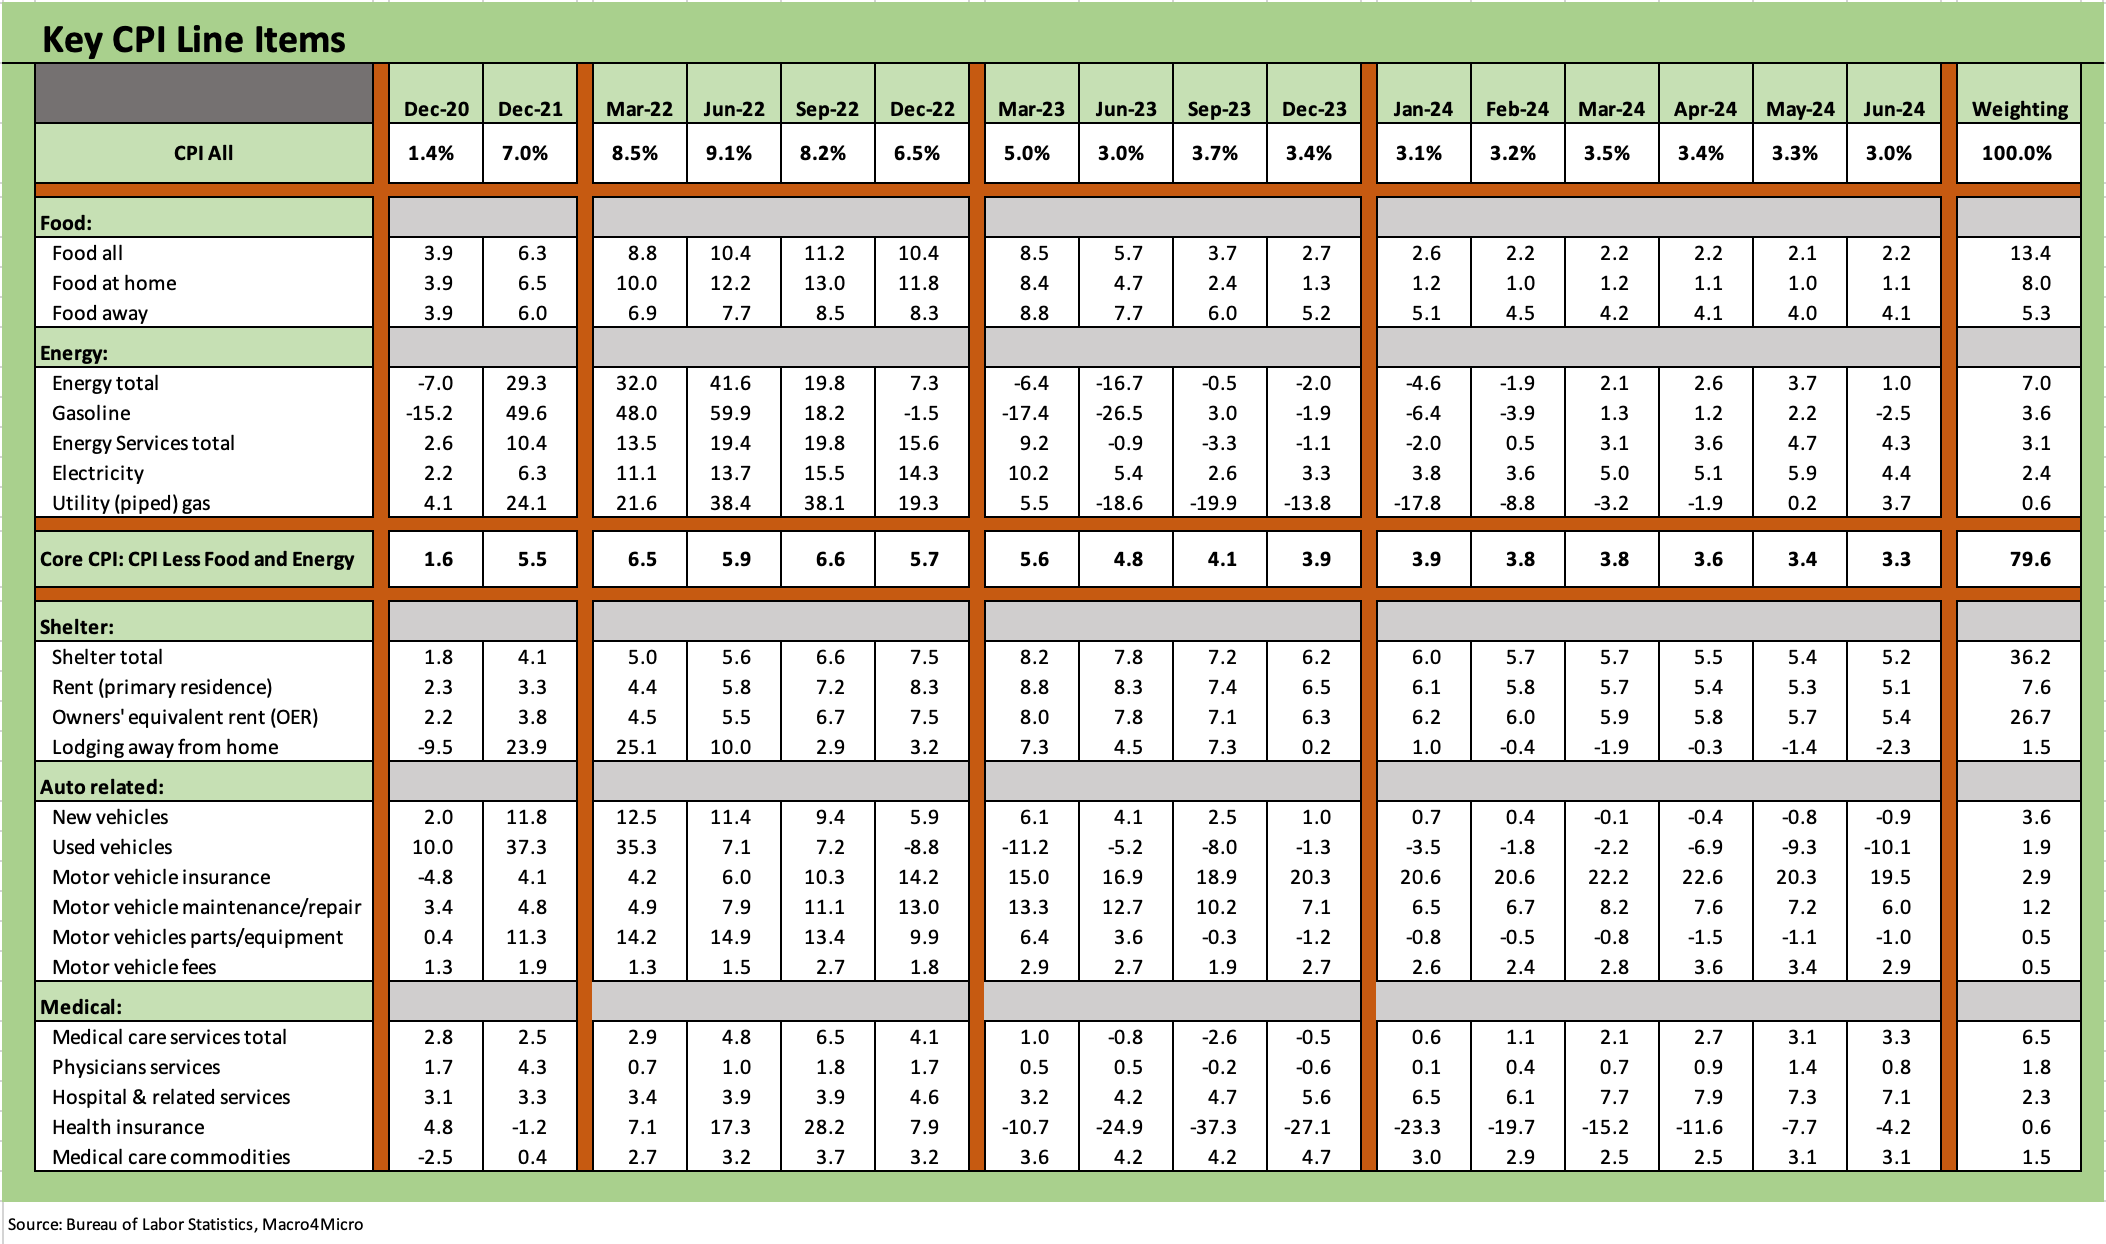
The above chart details the line items within our “Big 5” CPI buckets. The Big 5 comprise around 75% of the CPI index. The other “notables” that we drop into the last chart add another 11.5% of CPI index weighting, so the combined total of the line items in the Big 5 and “Add-ons” are just under 87% of the CPI index.
A quick recap on June’s moving parts:
Food: The Total Food weighed in with a sequential MoM uptick to +0.2% from +0.1% in May, but the YoY number of +2.2% keeps food off the sequential problem list. “Food at home” MoM was +0.1% (up from 0.0%) and YoY was +1.1%. That is good news in context. As we have covered in past commentaries, Food is the biggest political problem in the line items since the grocery store visits (or deliveries) give you constant reminders of how much purchasing power has been lost in a “same basket” menu. Food away from home MoM was flat at +0.4% and YoY at +4.1%, but that metric gets caught up in more than the food costs given the related cost factor inputs that flow into the Food away from home line.
The history of Food CPI is that it occasionally goes through inflation spikes and then declines. The problem, however, is that it almost never deflates when food CPI declines (see Inflation Timelines: Cyclical Histories, Key CPI Buckets 11-20-23). Certain lines within individual food groups (especially the protein family) can swing around, but the overall aggregates almost never deflate to recapture the “lost ground” in purchasing power. That takes years of growth in real wages. Whether you lay that all off on the branded food product conglomerates (standard Progressive playbook) or put it in the context of supply and demand and what the market will bear (standard free market playbook), Food CPI hurts many and colors election year rhetoric.
Energy: The energy line items deflating is good news with total energy in deflation mode in MoM at -2.0% including the important gasoline bucket at a MoM level of -3.8% and YoY -2.5%. The idea that the President has direct control of oil and gasoline inflation stands on pretty thin ice. A pro-energy, pro-production policy set can drive supply higher, but the main events are still global in scale. We would argue that the low gasoline price periods of Obama (Saudi price war) and Trump (COVID collapse) allow for some “fun with numbers” (aka “lie like hell”) exercises at given times.
Russia-Ukraine was bad for this part of the inflation story in 2022 with damaging effects along freight and transport costs (already battered by COVID fallout early in the game), raw material costs, and a lot of power cost inflation along the way. Record oil and gas production under Biden were not enough to offset the inflation pressures. Trying to get the rocket scientist debate moderators to get into any discussion of what is going on in energy markets or inflation nuances was a very low probability.
Shelter: As noted above, CPI ex Shelter weighed in at +1.7% YoY and deflated MoM at -0.3%. The Shelter news was once again stubborn on the month with YoY Shelter CPI (36.2% of the CPI index) at +5.2% after a MoM decline from +0.4% to +0.2%. Rent of primary residence has seen minimal relief at +5.1% while the infamous, derived, theoretical Owners’ Equivalent Rent stood +5.4%. OER stands at 26.7% of CPI despite the long walk from the actual checkbook of the homeowner with no mortgage or a low-rate fixed mortgage payment (60% below 4%, 30% below 3%). The barriers in housing affordability include mortgage rates (monthly payment burden) and price, and there are a lot of layers to it. We cover those topics in our housing sector and single name research.
Automotive: The CPI benchmark for vehicles has some good news in June, and that is important given the usual story of what a burden owning a car can be. We see deflation in new and especially used vehicles. So that is the good news. As we detail in earlier commentaries (see Automotive Inflation: More than Meets the Eye10-17-22), we crafted a version of Automotive CPI to catch the wide impact on the consumer checkbook.
The auto cost piece of the household experience often is not fully appreciated in terms of the scale of the automotive burden even excluding gasoline (which we drop in Energy). Our auto CPI weighting total is 10.6% of the index and would be 14.6% including gasoline. That is bigger than food. That is something to ponder while driving to the grocery store. The new and used auto vehicle costs do not take into account the monthly financing cost burden in a repriced market.
Medical: The Medical Services total has been moving in the wrong direction during 2024 YoY even if only slightly above the 2020 and 2023 levels noted in the chart. The MoM Medical Care Services line was +0.2% as it ticked lower from May and April. Medical Services CPI is below the 2022 levels, but the cost creep is underway at a lag given manpower needs and the inflation of so many hospital and services costs that need to get passed on. Medical commodities inflation has been muted and below 2023.

The above chart updates some line items near and dear to the hearts of consumers, and we see a mixed picture with only one (airline fares) in deflation mode this month after two buckets were deflating for much of 2024. The total of these CPI lines above is 11.5% of the CPI index, so it literally adds up.
We see two lines flat with one down more than others with “Recreation services” inflation fading more to +3.4% YoY vs. +3.9% in May after two months of MoM deflation including -0.1% in June and -0.2% in May.
See also:
Footnotes & Flashbacks: Credit Markets 7-8-24
Footnotes & Flashbacks: State of Yields 7-7-24
Footnotes & Flashbacks: Asset Returns 7-7-24
The B vs. CCC Battle: Tough Neighborhood, Rough Players 7-7-24
Payroll June 2024: The Race Gets Confusing 7-5-24
JOLTS May 2024: The Jobs Oasis Still Has Water 7-2-24
Footnotes & Flashbacks: Credit Markets 7-1-24
State Unemployment: A Sum-of-the-Parts BS Detector 6-30-24
The Debate: The China Deficit and Who Pays the Tariff? 6-29-24
PCE, Income and Outlays: Practicing Safe Growth? 6-28-24
HY Spreads: The BB vs. BBB Spread Compression 6-13-24
HY Spreads: Celebrating Tumultuous Times at a Credit Peak 6-13-24
Trade Flows: More Clarity Needed to Handicap Major Trade Risks 6-12-24
Miscellaneous histories:
Systemic Corporate and Consumer Debt Metrics: Z.1 Update 4-22-24
Credit Markets Across the Decades 4-8-24
Credit Cycles: Historical Lightning Round 4-8-24
Histories: Asset Return Journey from 2016 to 2023 1-21-24
Credit Performance: Excess Return Differentials in 2023 1-1-24
HY vs. IG Excess and Total Returns Across Cycles: The UST Kicker 12-11-23
Inflation Timelines: Cyclical Histories, Key CPI Buckets 11-20-23
Oh.... and food almost never deflates in aggregate across the cycles. Food CPI goes lower but not in reverse in total. We plotted that one in a link. Painful reality check contrasts with energy.
For some of the deflating items like durables, the consumer financing costs are sure not lower - yet. So the net effect there gets washed away. It's a start! Long way to go. Rentals mixed by region (NYC not deflating either). Shelter still a big asterisk though on derived metrics.