
Footnotes & Flashbacks: Credit Markets 10-28-24
An uneventful week in spreads was set against an adverse UST shift but the busy macro and micro week ahead warms the market up for next week’s election drama.


Comedy Night at Madison Square Garden: A Brownshirt, a Racist, and a Xenophobe Walk into a Bar…
We look at a quiet week in credit spreads with a very busy week ahead for critical macro indicators including JOLTS and Payroll, a first estimate on 3Q24 GDP, the Employment Cost Index, and Personal Income and Outlays with the PCE Price index.
This week could not get busier with 5 of the Mag 7 reporting earnings, Caterpillar and D.R. Horton (the #1 homebuilder) weighing in along with waves of massive energy sector names (XOM, CVX, COP and numerous midstream and infrastructure names).
We see the credit markets still hovering around multicycle lows in both IG and HY with the HY market under +300 bps and the same for the B tier OAS.
IG is in line with many past credit cycle peaks where the OAS band ran for some years, but sub-90 bps still rings the bell vs. prior peaks by a handful of bps.
We checked off one event risk wildcard this week (in theory) with the measured response by Israel to strike Iran and it was downplayed by Iran in a positive sign that sent oil prices spiraling lower in what is a good macro variable for inflation, feedstock/material costs, and freight and logistic flow-throughs among other factors.

The above chart updates the running YTD IG and HY total returns and also across the credit tiers. The fact remains that 2024 has been a good year for credit returns and not-so-good of a year for duration. We cover that in our separate Footnotes publications on yields and asset returns (see Footnotes & Flashbacks: Asset Returns 10-27-24, Footnotes & Flashbacks: State of Yields 10-27-24).
The markets in credit will face some big challenges subject to the election and what policy outcomes flow out of results in the White House, Senate, and House. The gaping differential in economic risk is underscored by the reality that Kamala plans can be checked by the House and Senate while the core (and radical) platform by Trump on tariffs can be run out of the White House as a de facto radical economic policy dictatorship. That is part of the reason why Trump loves tariffs. The fact that he seems to have zero understanding of how they work is a separate topic.
Trump’s keen understanding of power concentration is something he appreciates since he can use the tariff exception appeal process as political leverage and for purposes of economic coercion. That is a Russian business model that has proven quite effective. Trump just added Bezos to his charm bracelet, so it appears the tariff bludgeon could even be more effective (Bezos likely had a separate set of motives, but that is sure a lot of offshore retail sourcing at Amazon!?).
At some point, the market will need to start factoring in the policy effects. The only one that is unchecked by Congress and 100% certain is high tariffs chosen at the whims of Trump.

The above chart updates the running excess returns for IG vs. HY. The differential tells a decent story about getting paid for taking HY risk so far in 2024. Early August offered a reminder of how quickly that can swing, and that spread widening was still to levels well below the long-term median HY OAS as we detailed along the way (see HY Industry Mix: Damage Report 8-7-24).

The above chart updates the running BBB and BB tier excess returns. The relationship has been compressed and even recently inverted before flipping back to a normal relationship as we see this week. The theory is these are too compressed for the market backdrop, but the convergence of the typical IG buyer of BBB and the HY upgrade trade to the BB tier have created a new class of “HY lite” investor strategies over the post-crisis cycle in the US and Euro credit markets.
We also see more IG buyers selectively in the BB tier looking for issuer and industry diversification across the speculative grade dividing line. There have been a range of industries and names that often present less volatility risk or in some cases rising star potential.

The above chart updates the B vs. CCC tier running excess returns and continues the theme of getting paid more for taking more risk. The CCC trade worked out quite well in the context of relative performance, but the CCC tier reconciliation is always a tricky exercise in constituent migration, drop-ins vs. dropouts and distressed exchanges (see The B vs. CCC Battle: Tough Neighborhood, Rough Players 7-7-24 ).
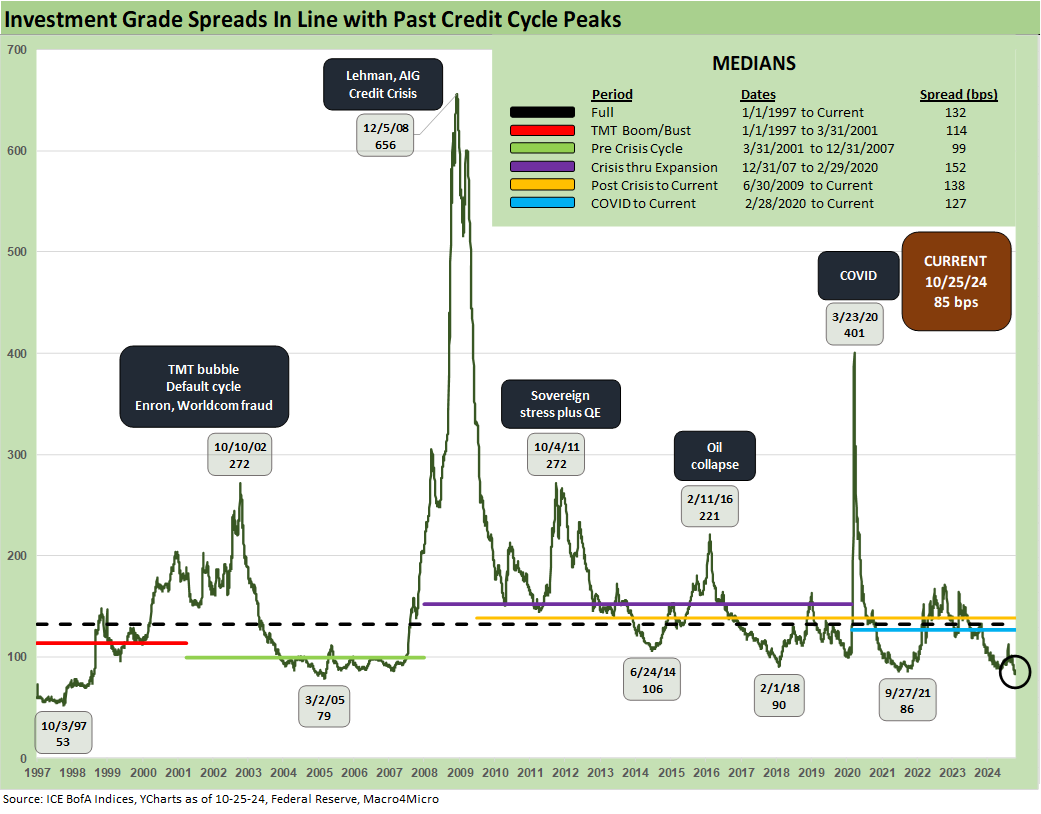
The above chart updates the IG Index spread trend, and a +2 bps widening to +85 bps constitutes a “non-week” for the cash markets. We will not keep replaying the theme music that “the clock is ticking” on pricing in election policy outcomes.

HY OAS index spreads were somewhat immobilized as well with a +1 bps move wider this week. We have looked at these trends and done some compare and contrast on the topic in separate pieces (see HY OAS Lows Memory Lane: 2024, 2007, and 1997 10-8-24, Credit Returns: Sept YTD and Rolling Months 10-1-24).
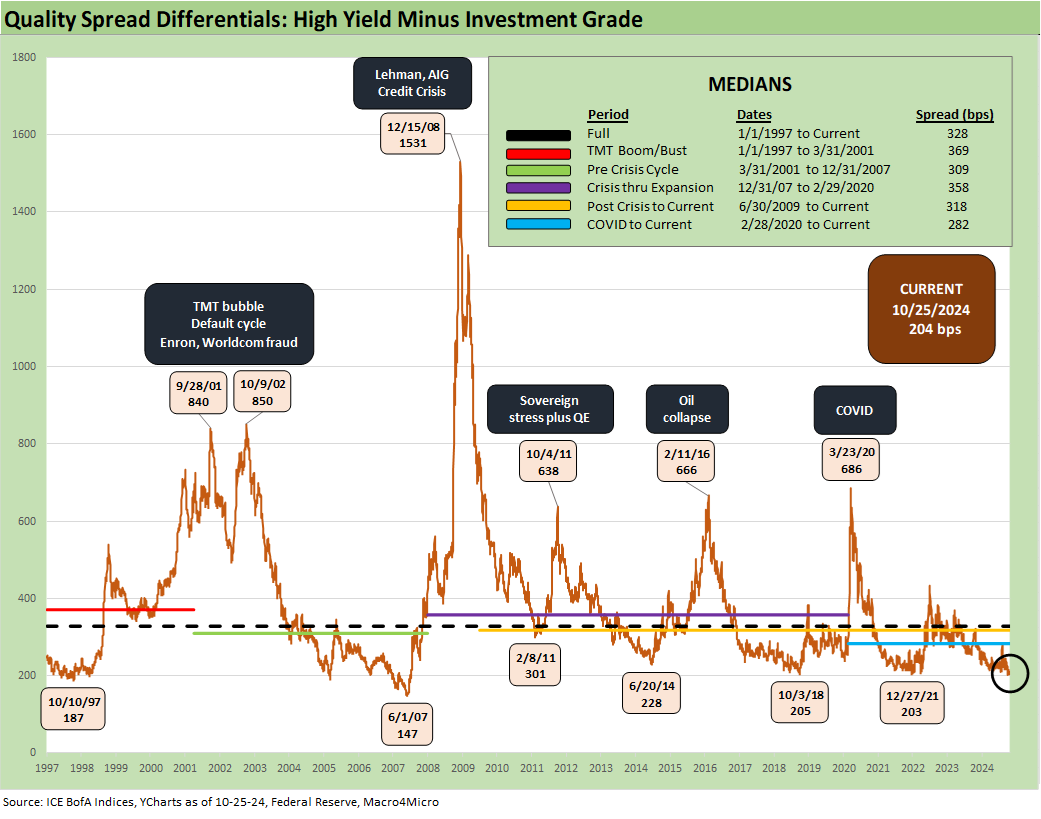
The “HY OAS minus IG OAS” barely moved this week and at +204 bps remains near the lows of Dec 2021, Oct 2018, and well inside June 2014. The +204 bps is materially inside the long-term median of +328 bps.

The BB tier OAS of +179 bps is above the July lows of +172 bps and inside the lows of Jan 2022, Jan 2020, Oct 2018, and June 2014. For the BB tier, the magic line to cross is +200 bps vs. the long-term median of +301 bps.

The “BB minus BBB OAS” quality spread differential was +72 bps this past week or comfortably above the July 2024 lows of +55 bps. The Dec 2019 level of +57 bps and Oct 2018 differential of +62 bps offer reminders that life can change in a hurry with the 4Q18 period getting especially ugly (see HY Pain: A 2018 Lookback to Ponder 8-3-24).

For the B tier, crossing the +300 bps line is a rare event and had not been seen since mid-2007 as noted above. The +285 bps tells a story of compression and is just inside the overall HY index level of +289 bps. The HY index carries a weighted average composite credit rating of B1 while the B tier itself has a composite of B2.

The above chart updates the history of the B vs. CCC tier across the cycles. We see periods of stark divergence along the way when trouble surfaces and CCC bonds take on more equity-like risk characteristics. The long-term average annual default rate is exponentially higher in the CCC tier than the B tier and repricing events can be dramatic in an OTC market with impaired secondary market liquidity during such times. This is when distressed debt investors show up and seek to surgically remove your lungs while shaking out sellers below recovery value.
We have looked at these issues and lookbacks in detail in other commentaries (see The B vs. CCC Battle: Tough Neighborhood, Rough Players 7-7-24). The current CCC tier OAS of +769 bps is now well inside the long-term median of +961 bps.

The above chart shortens up the recent timeline to better capture the moves across the tightening cycle that got underway in March 2022. The pronounced moves in 2022 and early 2023 offer a reminder of volatility in the lowest tier OAS.

The above chart updates the running differential for “CCC OAS minus B tier OAS.” The current +484 bps differential is on top of the long-term median and in the area of numerous other timeline medians detailed in the chart.
A look at yields…

The above chart updates the IG Index YTW and frames those levels on the horizontal lines vs. prior credit cycle peaks in mid-2007 and late 1997. We also include UST curves for the same dates. We see the IG index yields at credit peaks as primarily driven by the UST curve in a logical relationship. The current +5.1% IG yield is extremely low in historical context in line with the multi-cycle lows we see for the UST once you separate the post-crisis/post-COVID ZIRP and normalization periods.

The above chart does the same exercise for the HY index vs. the prior credit cycle peaks in 1997 and 2007. The recent HY index yield is the lowest of the 3, but at least is still north of 7% in a market with tight spreads similar to those earlier periods (see HY OAS Lows Memory Lane: 2024, 2007, and 1997 10-8-24).

The above chart updates the side-by-side history of IG YTW vs. HY YTW. We break out some timeline medians that underscore how the pre-crisis world was unsurprisingly very different than the post-crisis and COVID ZIRP years.
With the Fed bailout backdrop now over and done and the market past a tightening process and transitioning into an easing cycle, the pre-Aug 2008 median yields are the most logical frames of reference. With HY OAS at +289 bps vs a long-term median of +465, the additional +176 bpd to get to the median HY OAS would help make that historical yield more competitive and closer to 9%. The pre-crisis median was +9.3%.
Similarly, the current +85 bps IG OAS vs. a long-term median of +132 bps gives one a sense of what a normal level might be in a comparable UST backdrop. The additional +47 bps at the median would bring you up to almost +5.6% vs. a pre-crisis median of 6.1%.
These are make-believe scenarios, but the idea of manageable spread widening in a slightly normal set of risk pricing increments in the market make for a starting point for debate as the easing continues (“if” it continues) and how the market could react to an embrace of the post-election policy “winners” (tariffs vs. taxes, etc.)
See also:
Footnotes & Flashbacks: State of Yields 10-27-24
Footnotes & Flashbacks: Asset Returns 10-27-24
Mini Market Lookback: Burners on Full 10-27-24
Trump, Trade, and Tariffs: Northern Exposure, Canada Risk 10-25-24
Durable Goods Sept 2024: Taking a Breather 10-25-24
New Home Sales: All About the Rates 10-25-24
PulteGroup 3Q24: Pushing through Rate Challenges 10-23-24
Existing Home Sales Sept 2024: Weakening Volumes, Rate Trends Worse 10-23-24
State Unemployment Rates: Reality Update 10-22-24
Housing Starts Sept 2024: Long Game Meets Long Rates 10-18-24
Trump at Economic Club of Chicago: Thoughts on Autos 10-17-24
Retail Sales Sep 2024: Taking the Helm on PCE? 10-17-24
Industrial Production: Capacity Utilization Soft, Comparability Impaired 10-17-24
CPI Sept 2024: Warm Blooded, Not Hot 10-10-24
Payroll Sept 2024: Rushing the Gate 10-4-24
Select Histories:
HY OAS Lows Memory Lane: 2024, 2007, and 1997 10-8-24
Credit Returns: Sept YTD and Rolling Months 10-1-24
HY Industry Mix: Damage Report 8-7-24
Volatility and the VIX Vapors: A Lookback from 1997 8-6-24
HY Pain: A 2018 Lookback to Ponder 8-3-24
Presidential GDP Dance Off: Clinton vs. Trump 7-27-24
Presidential GDP Dance Off: Reagan vs. Trump 7-27-24
The B vs. CCC Battle: Tough Neighborhood, Rough Players 7-7-24
HY Spreads: Celebrating Tumultuous Times at a Credit Peak 6-13-24
Credit Markets Across the Decades 4-8-24
Credit Cycles: Historical Lightning Round 4-8-24
Histories: Asset Return Journey from 2016 to 2023 1-21-24
Credit Performance: Excess Return Differentials in 2023 1-1-24
HY vs. IG Excess and Total Returns Across Cycles: The UST Kicker 12-11-23
HY Multicycle Spreads, Excess Returns, Total Returns 12-5-23
US Debt % GDP: Raiders of the Lost Treasury 5-29-23