
Footnotes & Flashbacks: State of Yields 10-27-24
We look at the UST deltas and shapeshifting after Oct brought its share of duration setbacks and challenged some assumptions.


Tariff budget analysis department…
The month of Oct has been rough on debt returns as economic data and cyclical trends challenge the FOMC timing assumptions and bring a mixed steepening shape with the 10Y UST also being unkind to 30Y mortgages and existing home sales patterns.
The week ahead brings a slew of econ releases with JOLTs and Payroll, the first cut of 3Q24 GDP, the Employment Cost Index, and Personal Income and Outlays (with the PCE price index).
The week also brings 5 of the Mag 7 reporting earnings (AAPL, MSFT, GOOGL, AMZN, META) along with some major bellwethers such as Ford, Caterpillar, D.R. Horton and a wave of energy names that should beef up the range of guidance on the state of the corporate sector.

The above series of UST curves runs from the 1978 Carter inversion on across some of the notable yield curves and cyclical transitions in the pre-crisis periods through the end of 2006. We use the periods outside the ZIRP and FOMC normalization years that saw the UST curve artificially driven lower. The easy conclusion is that the UST is now extraordinarily low by any non-ZIRP, non-crisis standard.
We have the additional twist of a record US budget deficit, record funding needs and some significant questions around how to sustain levels of UST demand in an expansion to keep buyers clearing the market supply at such low levels. The promises of cutting rates materially while driving high growth, lower taxes and risking massive tariff battles with all major global trading partners stretches the bounds of reality. Of course, ignoring reality is nothing new these days.

The above chart updates the UST shifts since the 10Y UST peak at 10-19-23. We break out the deltas from the peak and from the start of the year in the boxes.
The bear steepener since the start of the year is in evidence after what had been a nice run tighter in recent months to a 3.6% 10Y UST before getting beaten up this month after the big payroll number and a few other metrics along the way (see links at the bottom).
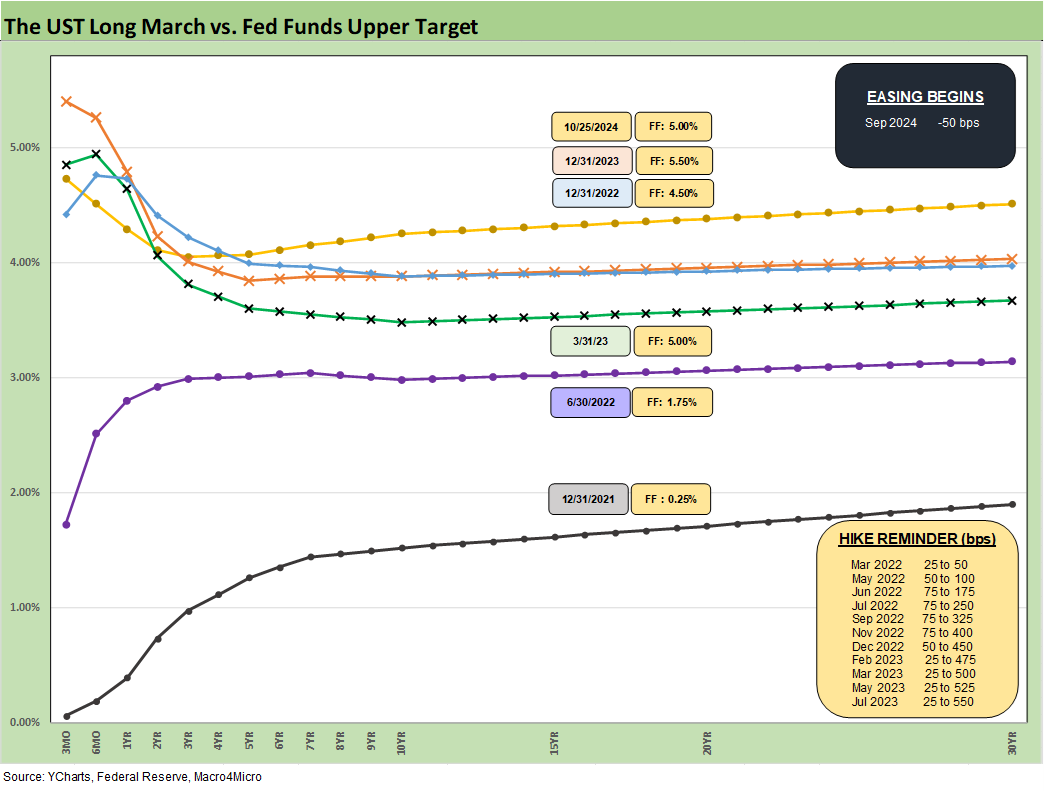
The above chart is one of those weekly replays where we highlight how the 12-31-22 and 12-31-23 curves converged around the 10Y UST despite a 100 bps differential in fed funds. That data point had offered an empirical reminder that the 10Y does not necessarily follow the fed funds in unison by any stretch of the imagination. The steepening pain in the 10Y since the Sept FOMC action has offered another sharp memory jogger.

The above chart details the UST deltas for the past week as the adverse moves brought more subpar returns on bonds for the week (see Footnotes & Flashbacks: Asset Returns 10-27-24, Mini Market Lookback: Burners on Full 10-27-24, Housing Starts Sept 2024: Long Game Meets Long Rates 10-18-24).

The above chart updates the running UST deltas since the start of the year. We see the benefits of the easing, but the bear steepening from 3Y to 30Y has not helped duration returns. The long duration UST 20+ Year ETF (TLT) has generated -4.0% YTD.

The above chart plots the deltas from the date of the peak 10Y UST in fall 2023 (10-19-23). That is a strong move with a big slice of it in Nov-Dec 2023. The long duration UST 20+ Year ETF (TLT) generated a total return of +15.8% since that date.

We already addressed the mortgage issues in our Mini Lookback earlier today (see Mini Market Lookback: Burners on Full 10-27-24). We also have given the recent move some context in our housing sector work (see New Home Sales: All About the Rates 10-25-24, Existing Home Sales Sept 2024: Weakening Volumes, Rate Trends Worse 10-23-24).
The chart above plots the UST curve and Freddie Mac mortgage benchmarks for the three periods presented. That includes the past Friday along with the rates at the end of the peak homebuilding year of 2005 and mid-2006 when the RMBS markets started to raise alarms. The current UST curve is strikingly different in shape, but the Freddie Mac mortgage benchmark is now back above the 2005 level even with the lower 10Y UST rate.
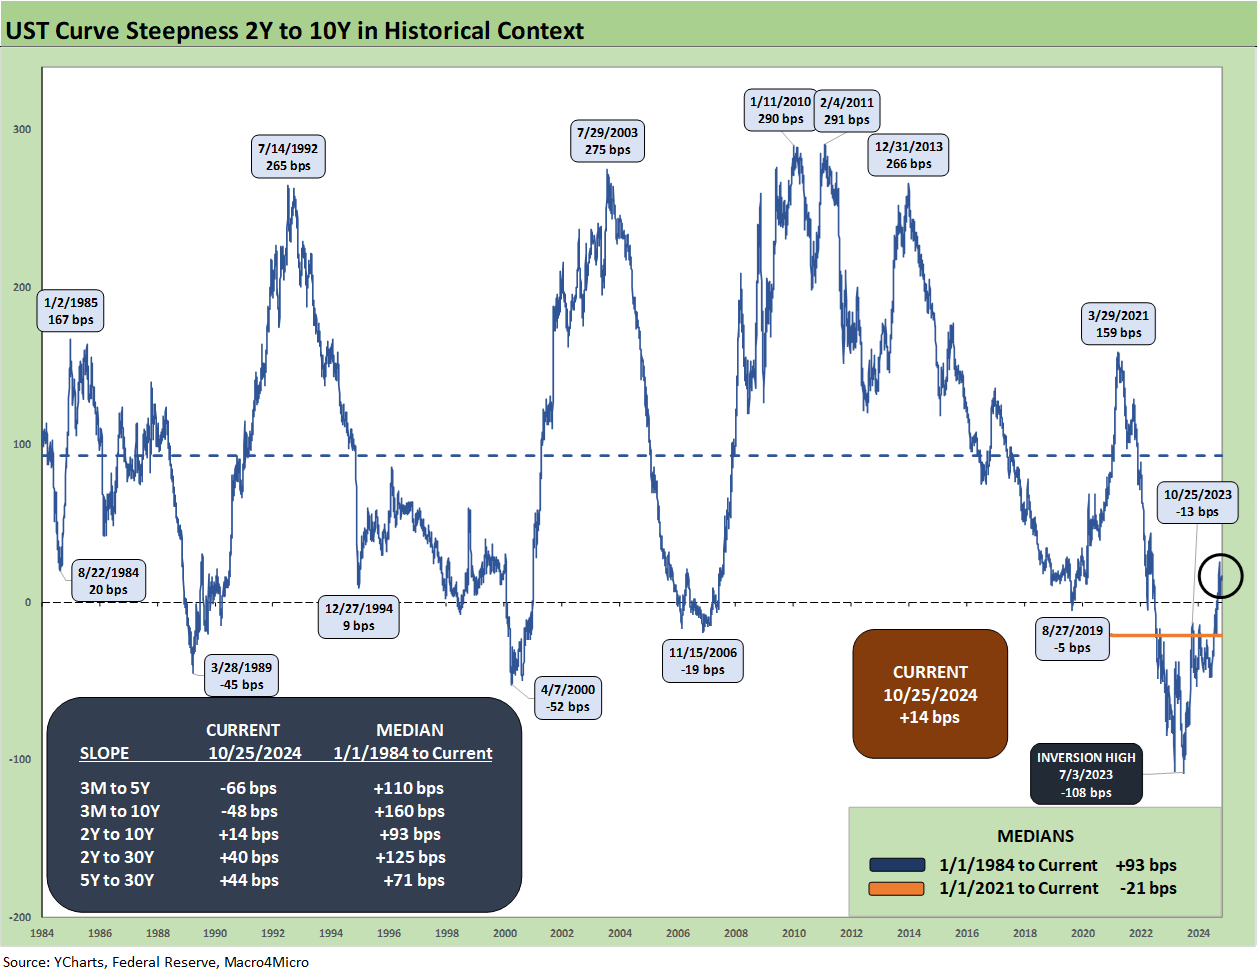
The above chart updates the 2Y to 10Y UST slope and breaks out the long-term time series and medians in the box, which also includes the current slope and long-term medians of other curve segment slopes we like to watch. The 2Y to 10Y slope is only at +14 bps upward sloping and far away from the median of +93 bps. That relationship over the cycles leaves a lot of room for FOMC action on the front end in coming months with limited action on the long end if we assume the long-term median as a base case.

The above chart shortens up the timeline for better visuals on the recent shapeshifting across the recent tightening cycle into the start of easing. The peak inversion of -108 bps in July 2023 has steepened to +14 but is still a very long way from the +159 bps peak back in March 2021.

We wrap up with our usual UST delta chart from the start of March 2022, which was the month that ZIRP ended (effective March 17). We include the 12-31-20 UST curve and 10-19-23 UST curve when the 10Y UST peaked as frames of reference. That UST migration ran from upward sloping into a bear flattener into an inversion and now a bear steepener. The market is now trying to make up its mind on the nature of the retracement shapeshifting.
See also:
Footnotes & Flashbacks: Asset Returns 10-27-24
Mini Market Lookback: Burners on Full 10-27-24
Trump, Trade, and Tariffs: Northern Exposure, Canada Risk 10-25-24
Durable Goods Sept 2024: Taking a Breather 10-25-24
New Home Sales: All About the Rates 10-25-24
PulteGroup 3Q24: Pushing through Rate Challenges 10-23-24
Existing Home Sales Sept 2024: Weakening Volumes, Rate Trends Worse 10-23-24
State Unemployment Rates: Reality Update 10-22-24
Footnotes & Flashbacks: Credit Markets 10-21-24
Footnotes & Flashbacks: State of Yields 10-21-24
Footnotes & Flashbacks: Asset Returns 10-20-24
Mini Market Lookback: Banks Deliver, Equities Feel the Joy 10-19-24
Housing Starts Sept 2024: Long Game Meets Long Rates 10-18-24
Trump at Economic Club of Chicago: Thoughts on Autos 10-17-24
Retail Sales Sep 2024: Taking the Helm on PCE? 10-17-24
Industrial Production: Capacity Utilization Soft, Comparability Impaired 10-17-24
CPI Sept 2024: Warm Blooded, Not Hot 10-10-24
HY OAS Lows Memory Lane: 2024, 2007, and 1997 10-8-24