
Footnotes & Flashbacks: Asset Returns 10-27-24
The risk factors are warming up for takeoff with tariff rhetoric unfortunately soaring to new heights and getting intertwined with ego.


Destination not clear Spock…WTF!?
We update the latest running asset returns across major debt and equity asset classes as the 32 benchmarks and ETFs we monitor weighed in with an unsightly 2 positive and 30 negative for the week.
The more the political combatants focus on home stretch rhetoric, the more Trump digs in and marries his ego and limited but committed policy platform to high and wide tariffs and mass deportation unchecked by Congress.
The overall policy gambit comes down to a toxic brew of negative economic factors for growth and inflation and potentially a disincentive for higher capex as we saw in 2018-2019. The reality lies in supply and demand, pricing and costs, and capital budgeting confidence. Confidence will be low if facing such tariffs.
Earnings season is not telling a bad story for cyclical fundamentals, so it is hard to see a big UST rally or more aggressive FOMC with at least one major risk factor getting checked off this week with the Iran events.

The above chart updates the time horizon returns for the high-level benchmarks we watch in debt and equity. We already looked at a range of asset return variables for the past week in an earlier post (see Mini Market Lookback: Burners on Full 10-27-24). We had a major stall in equities in positive returns for the past week and the trailing 1-month period has been dominated by adverse UST curve moves. The recent weeks have seen a political hate-fest unfolding, rampantly false statements and dishonesty, and way too many headlines on how aggressive tariffs could be as a cornerstone economic policy.
In the above, we see 1-month returns on the debt side really struggling with trailing 1-month showing all negative returns including HY. For HY, the -30 bps narrowing in spreads over the trailing 1-month through Friday has not been enough to offset the curve (see HY OAS Lows Memory Lane: 2024, 2007, and 1997 10-8-24). The -2.3% return on the UST benchmark for the past month tells the story in a snapshot as does the negative return for the IG Corp benchmark with its long duration. We look at the various bond ETFs in our benchmarks and ETF review further below.
The 3-month returns show the benefits of the earlier UST rally before the post-payroll UST curve beatdown (see Payroll Sept 2024: Rushing the Gate 10-4-24) and ensuing consumer indicators (e.g. Retail Sales Sep 2024: Taking the Helm on PCE? 10-17-24) and a range of economic signals including CPI (see CPI Sept 2024: Warm Blooded, Not Hot 10-10-24).
The steadily favorable economic news and slightly hotter CPI read combined with UST deficit fear to drive a bear steepening pattern despite the -50 bps easing in Sept (see FOMC Action: Preemptive Strike for Payroll? 9-18-24). The 3-month returns in isolation were solid and the same for 6 months. On the other hand, the YTD run rate for bonds has proven disappointing vs. initial expectations.
Equity run rates have been mixed in Oct with a combination of UST nerves, political/policy risk, some industry-specific challenges, and some mixed performance across interest-sensitive sectors for the month. We also continue to see some struggles in manufacturing. Among micro story headaches are headwinds in EV demand and production costs along with the aerospace challenges reverberating out of Boeing and its supplier chain.
Some sectors will be much more sensitive than others to the tariff battles ahead (see Trump at Economic Club of Chicago: Thoughts on Autos 10-17-24, Trump, Trade, and Tariffs: Northern Exposure, Canada Risk 10-25-24), and life could get very noisy for some industries such as autos.

The above chart updated the 1500 and 3000 series. We see the UST curve gyrations already rattling Real Estate with a negative month after a very good rally over 3 and 6 months. Industrial and Value stocks were undermined the last few weeks with the yield curve turmoil after a good 3-month and 6-month run. Financials held up the best the past month on a good earnings season and at least the perception of steady asset quality vs. expectations for both corporate and consumers.
The rolling return visual
In the next section, we get into the details of the 32 ETFs and benchmarks for a mix of the trailing periods. Below we offer a condensed 4-chart view for an easy visual on how the mix of positive vs. negative returns shape up. This is a useful exercise we do each week looking for signals across industry groups and asset classes. We also have a YTD version that we include in the broader commentary on the time horizons further below.
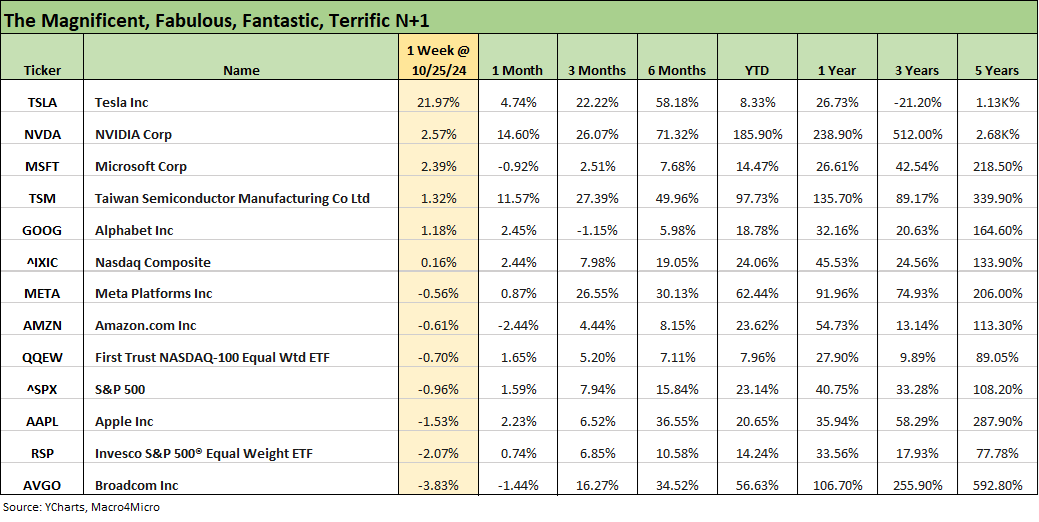
The tech bellwethers had a mixed week after a recent rough stretch for some. The chart above was addressed in our Mini Market Lookback published earlier today. We see 4 of the Mag 7 in positive range for the trailing week and 3 with negative returns. The tally is 5 of the 9 bellwethers (Mag 7 + Taiwan Semi + Broadcom) in positive range. It is notable that the Equal Weight NASDAQ 100 was also negative in what was still on balance an underwhelming but net positive return week for tech and the NASDAQ.
The banner earnings report and +22% week for Tesla allowed the company to wipe out some negative trailing periods, but TSLA is still the only Mag 7 name in single digit returns YTD and the only one of the 9 single names. TSLA is also the only name negative for the trailing 3 years.

The 1-week time horizon posts a positive-negative score of 2-30 but the 2 asset lines in positive are less than 1% with Consumer Discretionary (with its Tesla and Amazon concentration) at the top with +0.65%. We highlight that Amazon was slightly negative on the week.
Over on the far right in dead last place by a material increment, we see the Homebuilder ETF (XHB) that had been running very impressively over numerous time horizons across the 2024 period including +73% LTM return to end last week. The noise this week and in recent weeks puts the 1-month return for XHB in slightly negative range in the bottom quartile and in the third quartile for 3 months. That said, XHB remains a top quartile performer YTD and #1 LTM.
The high valuation in the strong equity market is where the challenges of some high fliers can get called into question and notably for the interest rate sensitive sectors that have been material outperformers with Homebuilders (XHB), Regional Banks (KRE), and Financials (XLF) in the Top 3 LTM. We see #4 through #6 comprised of tech-heavy names such as NASDAQ at #4, the Tech ETF (XLK) at #5, and Communications Services (XLC) at #6 for LTM returns. We detail the rankings further below.

The rolling 1-month asset return mix posts a 19-13 score with all 7 bond ETFs in the red including 5 of the 7 in the bottom quartile and 2 of the 7 bond ETFs in the middle of the third quartile. We see the long duration 20+ Year UST ETF (TLT) in dead last for the 1-month joined in the bottom quartile by the longer duration IG Corp ETF (LQD), AGG, GOVT, and EM Sovereign (EMB). The third quartile includes the short duration UST 1Y to 3Y ETF (SHY) and HY ETF (HYG).
We see the Regional Banks and Financials at #1 and #2 after a strong earnings season and reassurance on asset quality that apparently is flowing into the BDC ETF (BIZD) at #3. BIZD had been lagging somewhat for 3-months, YTD, and LTM. BIZD ranks behind HYG for 3-months but ahead of HYG for YTD and LTM. The higher cash dividend rates of BIZD and floating rate and structural seniority profiles of the BIZD asset mix make for an interesting comparison.
BIZD faces the potential for lower income flows on the front-end easing, and that comes alongside the usual default cycle risk and portfolio-specific performance. HY bonds bring lower income flows and UST curve risk but with higher average credit quality.

The 3-month score is 29-3 with two energy ETFs in the red along with the small cap Russell 2000. We see 5 of the 7 bond ETFs in the third quartile with 2 in the bottom quartile and the long duration UST ETF (TLT) bringing up the rear of the bond group. E&P (XOP) and Energy (XLE) sit in the bottom two places. We see a median return for this 3-month stretch around a high 3% range entering the last week of Oct while at the end of September the median for 3 months was just above 6%.
The relative equity performance is topping off somewhat with only 5 of the rolling 3-month benchmarks and ETFs in the top quartile generating double-digit returns over that stretch with Utilities (XLU) on top at +14.8% followed by Consumer Discretionary (XLY), Base Metals (DBB), Communications Services (XLC) and Real Estate (XLRE) in a 10% to 15% band. By comparison, the late Sept running 3-month asset returns had 8 line items in double digits for the 3-month bucket running in a band of 10% to 24%.

The YTD return profile remains very favorable with a return mix at 30-2. The long duration UST 20+ Year ETF (TLT) is sitting on the bottom by a material margin at -4.0% relative to E&P ETF (XOP) that is barely negative. The median return in the mix is slightly below 13%.
Bond ETFs are all positive but 6 of 7 are in the bottom quartile with the top performer being the HY ETF (HYG) at +7.2%. Along with the E&P ETF (XOP) and the 6 bond ETFs, the last ETF in the bottom quartile is the Transports ETF (XTN).
The Utilities ETF (XLU) took the top position, but we see 4 of the top quartile heavily linked to the Mag 7 with Communications Services (XLC), the Tech ETF (XLK), and the NASDAQ and S&P 500. The remaining top quartile ETFs include Financials (XLF), Homebuilders (XHB), and Industrials (XLI).

The LTM scoresheet of 31-1 highlights a very impressive running 1-year period despite the recent UST setbacks. The median asset return is just under +28% in a range from +69% for Homebuilders (XHB) at #1 down to the single negative ETF of XOP at #32 and -6.0%. Among performance highlights LTM, we see 21 asset lines above 20%, 14 above 30%, and 9 above 40% for noteworthy breadth in a year of superior returns.
We see 6 of the 7 bond ETFs in the bottom quartile even if they are all positive. The period from Nov 2023 into Dec 2023 kicked off a monster rally for risk and duration with credit spread compression as a catalyst along with a favorable UST curve shift. We covered those trends at the time (see Footnotes & Flashbacks: Asset Returns 1-1-24 , Footnotes & Flashbacks: State of Yields 1-1-24, Credit Performance: Excess Return Differentials in 20231-1-24).
The election beckons by the next Tuesday vote deadline on Election Day with early voting ongoing. This coming week will be jammed with econ releases and earnings and heavy Mag 7 reporting as well.
See also:
Mini Market Lookback: Burners on Full 10-27-24
Trump, Trade, and Tariffs: Northern Exposure, Canada Risk 10-25-24
Durable Goods Sept 2024: Taking a Breather 10-25-24
New Home Sales: All About the Rates 10-25-24
PulteGroup 3Q24: Pushing through Rate Challenges 10-23-24
Existing Home Sales Sept 2024: Weakening Volumes, Rate Trends Worse 10-23-24
State Unemployment Rates: Reality Update 10-22-24
Footnotes & Flashbacks: Credit Markets 10-21-24
Footnotes & Flashbacks: State of Yields 10-21-24
Footnotes & Flashbacks: Asset Returns 10-20-24
Mini Market Lookback: Banks Deliver, Equities Feel the Joy 10-19-24
Housing Starts Sept 2024: Long Game Meets Long Rates 10-18-24
Trump at Economic Club of Chicago: Thoughts on Autos 10-17-24
Retail Sales Sep 2024: Taking the Helm on PCE? 10-17-24
Industrial Production: Capacity Utilization Soft, Comparability Impaired 10-17-24
CPI Sept 2024: Warm Blooded, Not Hot 10-10-24
HY OAS Lows Memory Lane: 2024, 2007, and 1997 10-8-24