
Construction Spending: Stalling Sequentially at High Run Rates
We update the latest construction spending numbers as the comps get tougher and MoM % comps fade at exceptionally strong levels.


We look at some mildly negative construction numbers for Apr 2024 as three negative prints and one positive leaves construction spending essentially moving sideways on the year.
An encore performance to 2023 was always going to be a tough act to follow, but this month’s print is still just shy of all-time highs and 10% higher than April 2023.
Nonresidential construction weighed in for April 2024 with Education, Commercial, and Healthcare spending the largest contributors. Residential construction eked out a positive month on the back of new single family construction.

As seen in the chart above, the construction release this week tacked on a second negative month in a row in MoM% changes. The construction spending data follows the downward revisions to headline GDP late last week (See 1Q24 GDP: Second Estimate, Moving Parts 5-30-24). In the GDP release, a bright spot in those revisions was flat Gross Private Domestic Investment (GDPI) with positive changes to the Nonresidential and Residential fixed investment lines. Read alongside the negative and mixed data across commercial, manufacturing, and housing sectors this month (see links below), another small negative fits more into the soft-landing talking points than the “too hot to ease” theories.
Despite the MoM growth fade, another angle on construction is that we are still near all-time highs for a sector with myriad multiplier effects and where the expectation of reduced demand and headwind for investment in such a high-rate environment has been denied by a mix of government support and the expected economic returns on the projects. The market could be scaling back what is “expected” on some of these projects already as seen in the EV markets, but longer-tailed projects only react at a lag.
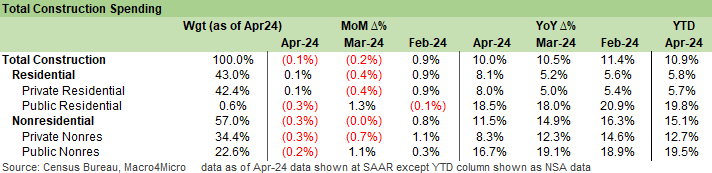
The chart above provides a high level overview of construction spending before we get into the weeds further below. We previously discussed the residential vs. nonresidential and public vs. private mix (see Construction Spending: Timing is Everything 12-1-23 and various links at the bottom of the commentary). Construction has been one of the big stories of this economic cycle as a wide range of infrastructure incentives from Washington tag-teamed with private capital to drive a major round of economic multiplier effects.
In an election year, half the country will praise programs and economic effects of the outlays and the other half will ignore or condemn them as waste, but the dollar generation across construction jobs, materials, equipment, freight & logistics, financial services is very real. Economics is as much about actual transactions as it is about theories. State and local tax bases, and the various layers of knock-on effects still exist for those who care to peel back even a single layer of additional facts and concepts. Of course, that is often not the case in politics.
Some program ambitions may end up being seen as ill-conceived or overplayed or too much hype (e.g., EVs), but don’t expect any states, cities, or voters to send the money back or refund the taxes paid (income or sales tax). Take the money and run, as they say, and the infrastructure bill dollars and a lot of the Inflation Reduction Act (IRA) dollars among other programs were just that – a lot of dollars. For those who trash the programs, hypocrisy and disinformation may bring their own psychic rewards, but the long-awaited infrastructure programs finally got legislated and brought cash rewards also. That did not happen without bipartisan support tied to interest in the dollars and jobs. The crazies could howl, but the big winners were also many of the same states with most of the howlers (think Harry Potter on that one).
Nonresidential and residential facing sequential growth challenges…
For the latest construction release, we see a pause in what has been unsustainably high growth rates on the nonresidential side. There have been plenty of winners in “nonresi” spending with such bellwethers as equipment manufacturers and leasing companies (see United Rentals: Another Bellwether Supporting the Macro Health Story 1-31-24). We see growth rate weakness in nonresidential broadly across both public (-0.2%) and private (-0.3%) that may signal a pause after a very impressive year of growth in both categories.
The residential line eked out a positive print (0.1%) with support from single family construction which we covered earlier this month as housing starts data came in. Growth rates in residential will still face the affordability headwinds of mortgage rates as we head into the peak selling season. The builders have put a lot of spec inventory on the books and many homes under construction. The builders look to maintain prudent working capital management and the right cadence around new home sales vs. starts (see New Home Sales April 2024: Spring Not Springing Enough 5-23-24, Existing Home Sales April 2024: Pay More, Get Less, but More Available 5-22-24, Housing Starts April 2024: Recovery Run Rates Roll On 5-16-24).).
Construction spending run rates are sustaining a strong rate of continued real economic activity where decision makers are putting new shovels in the ground and with life cycles that will keep the ball moving even if at a slower pace. Slowing growth but high rates of running construction in progress (both nonresi and resi) help push back on contraction themes but can also show the flagging growth that supports the “FOMC will eventually cut” school.
The consumer and PCE lines have been more in focus in the “inflation and FOMC neurosis” than the corporate investment trends, but the potential for both major sectors of the GDP line items to slow is there. The PCE headlines are the big ones rolling up to over 2/3 of GDP. We got some useful PCE data last week to ease some of the anxiety with the PCE lines retrenching (see PCE, Income and Outlays: Lower Income and Consumption, Sideways Inflation 5-31-24, 1Q24 GDP: Second Estimate, Moving Parts 5-30-24).

The above chart breaks out the total construction numbers across public and private with 10 of the 16 nonresidential lines in the red this month. Manufacturing as the largest among them grew at 0.9% and YTD 2024 is up 28.2% vs. YTD 2023. That is high growth by any measure but also comes for a sector that has long been stagnant amidst sectoral offshoring trends. The legislative and policy priorities around “reshoring” and a need for more durable supply chains has clearly shown up in the recent activity here.
There is also quite a bit of clean energy spending in the numbers (batteries, assembly plans, supporting infrastructure and supplier chains, etc.) The ability of the Washington types to politicize everything (masks, vaccination, EVs vs ICE etc.) raises threats to some of these lines. This crowd could politicize whole milk vs. 2% and would start shooting cows subject to their preference.
The reshoring ambitions will be featured prominently in the Presidential campaign as we discussed in our weekly asset return commentary (see Footnotes & Flashbacks: Asset Returns 6-2-24), but those ambitions come with tariffs, protectionism, and more than a little misinformation on how tariffs even work. The tariffs also will bring retaliation and more cost pressures on inputs that can impact not only US exports but also the willingness to build inventory, hire, or take too much risk in supplier chain planning. After all, the political game is every 2 years even if every 4 years is the Election Olympics. That makes long term capex planning complicated.
The desire to reshore is not always matched with the ability to reshore with challenges around where the manufacturers buys its inputs or from whom. The same is true in services as buyers and resellers of goods reassess threats to low cost sourcing. Many companies also have these things called “contracts” so there is never an easy solution. The economic weakness in 2019 that led to the Fed easing three times is seldom mentioned in political campaigns (after all, it was the greatest economy since the primordial soup), but that was a direct response by the Fed to weak capex that many link to trade stress points.
Among the more interesting risks not discussed outside the trade econ nerds and political junkies is what happens between the US and Mexico in a more stridently protectionist regime in 2025. New leadership in Mexico will be facing more aggressive protectionist practices in the US no matter who wins in November. On that topic at hand (manufacturing construction) would not help sustain growth of incremental capex for many industries. Shrinking or shelving is always a choice. We will see if there is a move to cancel USMCA on the trade deficit with crackdowns on cartels and immigration as one of the chips in the game.
Health care and commercial construction contributed the largest negatives to the headline numbers for the month. Questions around CRE asset quality pressure on the sector but new projects and spending are tied to the next leg of the race. For a sector facing so many headwinds, “flat” sequentially may not be good but it could be much worse.

The chart above splits out the private sector piece of construction spending and lines them up in descending order of weight. Looking at a broadly negative month, scanning the YoY % and YTD columns helps provide a sense of context. Health Care and Education both see strong growth vs. Apr23 even turning in around -3% on the month.

The last chart in the collection covers the public sector. The headline growth vs. last year is high but expected given infrastructure spending. This month finally marks a bit of a slowdown where the appetite for even more spending would test budget concerns that likely will not see productive discussions until early next year.
Contributors:
Kevin Chun, CFA kevin@macro4micro.com
Glenn Reynolds, CFA glenn@macro4micro.com
See also:
1Q24 GDP: Second Estimate, Moving Parts 5-30-24
1Q24 GDP: Looking into the Investment Layers 4-25-24
1Q24 GDP: Too Much Drama 4-25-24
4Q23 GDP: Final Cut, Moving Parts 3-8-24
4Q23 GDP: Second Estimate, Moving Parts 2-28-24
GDP and Fixed Investment: Into the Weeds 1-25-24
4Q23 GDP: Strong Run, Next Question is Stamina 1-25-24
GDP and Fixed Investment: Into the Weeds 1-25-24
Construction Spending: Timing is Everything 12-1-23
Construction: Project Economics Drive Nonresidential10-2-2
Construction Spending: Demystifying Nonresidential Mix 5-9-23