
Footnotes & Flashbacks: State of Yields 11-3-24
We look at the positioning of the UST curve as we get to an election with massively different policy goals and governance plans for the Fed.


Is Jan 6 a night game?
The Fed is teed up for this week after a very busy period of earnings and a slew of constructive data that nonetheless had a few gaps that did not allow for complete comfort on the inflation. The -25 bps easing is still expected and will keep the debate going.
The real story line and plot drama will come if the FOMC has to deal with a very aggressive new boss who favors widespread high tariffs and thinks the country of the seller pays and not the actual buyer entity in the US. That could be a source of “factual strain.”
The fact that Trump wants to subjugate the Fed and FOMC to the White House and the US Treasury also might be a source of some handicapping discomfort for the markets.
The administrative process to unfold this week obviously matters, but the conversation will be brief with the election fight likely to last for days if Harris wins the vote.
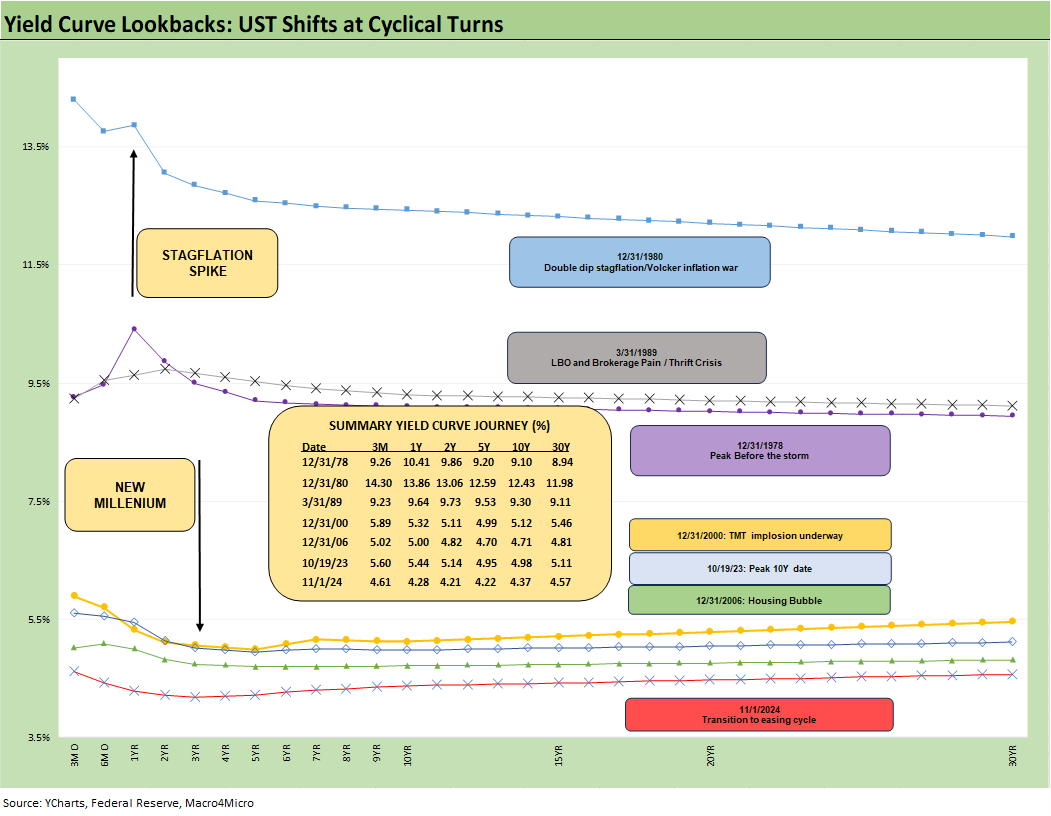
The above chart updates the migration of the UST curves and frames the most recent UST curve in the context of a range of cyclical transition periods starting back with the Jimmy Carter 1978 inversion. We only use the pre-crisis curves during periods when ZIRP (and brief normalization) were not operating as a major Fed distortion.
We include the 10-19-23 UST curve as the peak date for the UST 10Y. These visuals drive home the obvious conclusion that current UST rates are extraordinarily and unusually low and they are that low at a time when one of the few guarantees in life is that there will be record UST issuance with a soaring interest bill.
The idea of someone promising radically lower interest rates while driving higher growth, lower taxes and sovereign debt reduction would get you kicked out of the snake oil union for misconduct and reckless disregard to the professional standards of gross misrepresentation. After all, it needs to be believable.
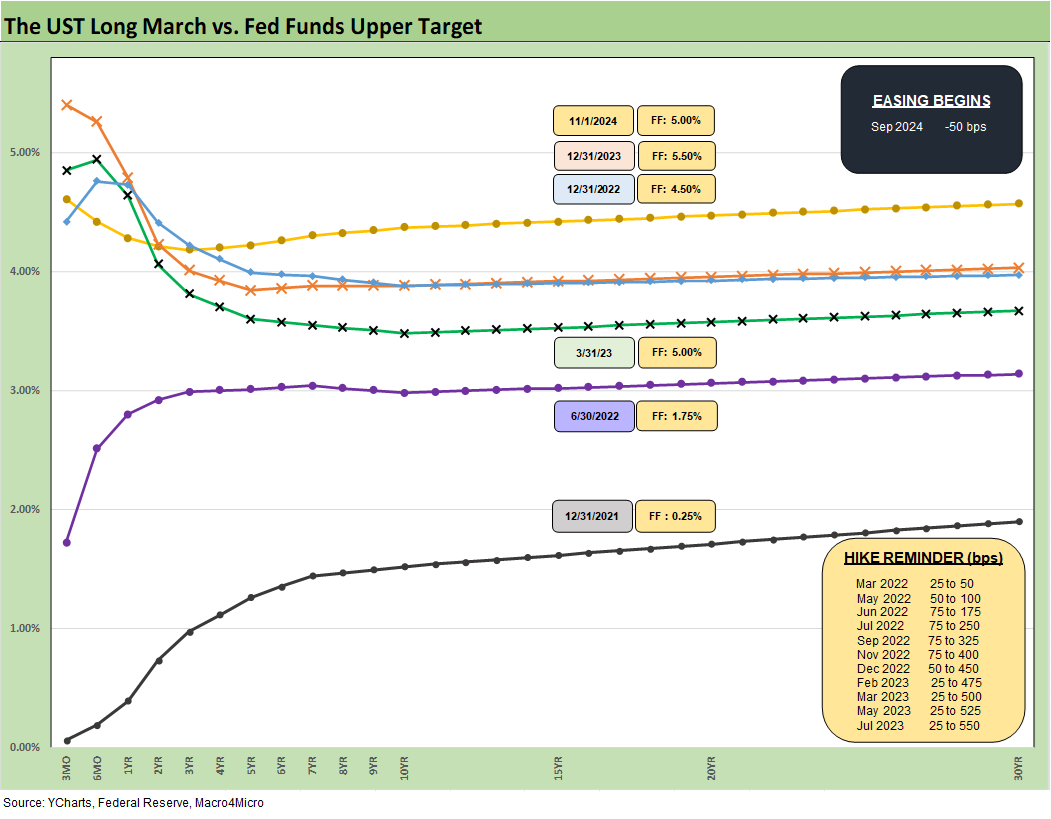
The above chart revisits our replay that shows the UST curves converging around the 10Y for the 12-31-22 and 12-31-23 UST curves even with a 100 bps differential in fed funds. That offers an easy empirical reminder that the 10Y does not have to follow the short end. That rising 10Y UST may have surprised some people in the aftermath of the cuts, but the recent history offered a clear data point the two did not need to move in lockstep.
If Trump is elected, the tariff and mass deportation wildcard will toss a lot of economic models out the window. If he then effectively takes control of monetary policy by edict to avoid the FOMC taking action that undermines his “lower rates” promise, he will be throwing more than old theories out the window. That is a topic for another day, but he will quickly learn that the market controls the long end of the UST curve as well as the value of the dollar even if he “seizes the means of production” on the short end.

The above chart updates the visuals on the UST shift since the 10-19-23 peak on the UST 10Y. We include the UST deltas in the boxes. We shifted lower and down quickly in late 2023 and now are shifting higher and steeper from the 2Y UST. Multicycle lows in IG spreads faced the duration setbacks as the year proceeded, in turn undermining total returns. Shorter duration HY with higher coupons and material spread compression helped HY drive better total returns.

The above chart updates the rolling 1-week UST spread deltas in another adverse move for duration. All the bond ETFs delivered a negative week (see Footnotes & Flashbacks: Asset Returns 11-3-24).

The above chart updates another visual angle in the YTD UST deltas with an adverse move for duration and bond returns. On a YTD basis, we see the long duration UST 20+ Year ETF in last place in our group of 32 benchmarks and ETFs we track with TLT posting a YTD return of -5.1%.

The above chart updates the favorable UST deltas since the 10-19-23 peak on the UST 10Y. As the crow flies, the lower rates have been helpful for asset returns and ran in tandem with lower inflation and easing by the FOMC.
The problem from here is more about how the market will vote on the various inputs it will face in an all-new White House that will bring some highly material economic inputs into the handicapping of growth, prices, and employment. It is too soon to use words like “Financial Stability” worries, but the lack of an independent Fed would materially increase market risk.
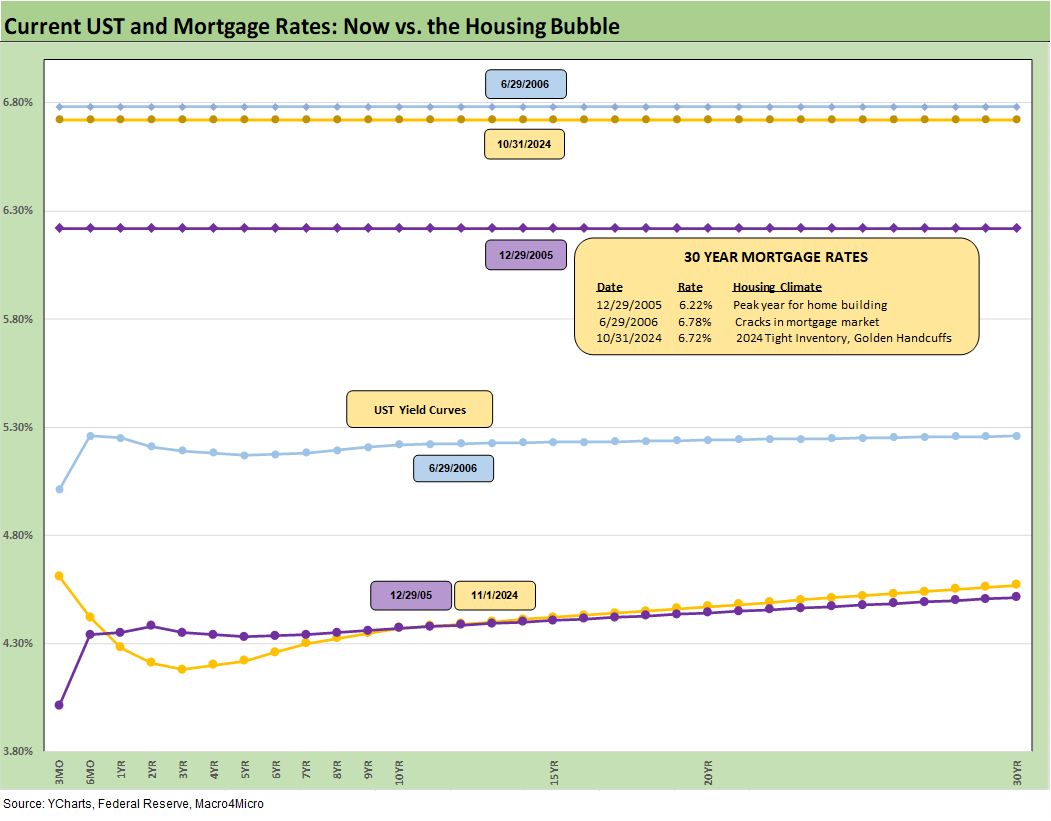
We looked at the path of the 10Y and Freddie Mac 30Y in the Mini Outlook and in recent housing sector commentaries (see New Home Sales: All About the Rates 10-25-24, Existing Home Sales Sept 2024: Weakening Volumes, Rate Trends Worse 10-23-24, Housing Starts Sept 2024: Long Game Meets Long Rates 10-18-24). The trend higher has also been seen in a major sample of mortgage rates outside the Freddie criteria above 7.0%. That is bad for existing home sales especially.

The above chart updates the 3M to 5Y inversion which is now down to -39 bps from the peak inversion of -197 bps in May 2023. The inversion still contrasts with a long-term upward sloping median of +110 bps. That median remains a very long way off. The need to move cash into longer duration assets gives managers of liquidity plenty of time to wait for more input from the planned fiscal and economic policies of the new administration and wait for who it will be.
High confidence in the behavior of the UST curves has not been easy to come by unless one is faking it. The scale and dimension of the potential policy changes are taking us into uncharted (and shark-infested) waters. The threat (is “governance change” more polite?) of commingling fiscal and monetary policy under a sole overseer by itself should promote caution. The fact that the potential overseer thinks the selling country pays the tariffs should give pause for more than concern.
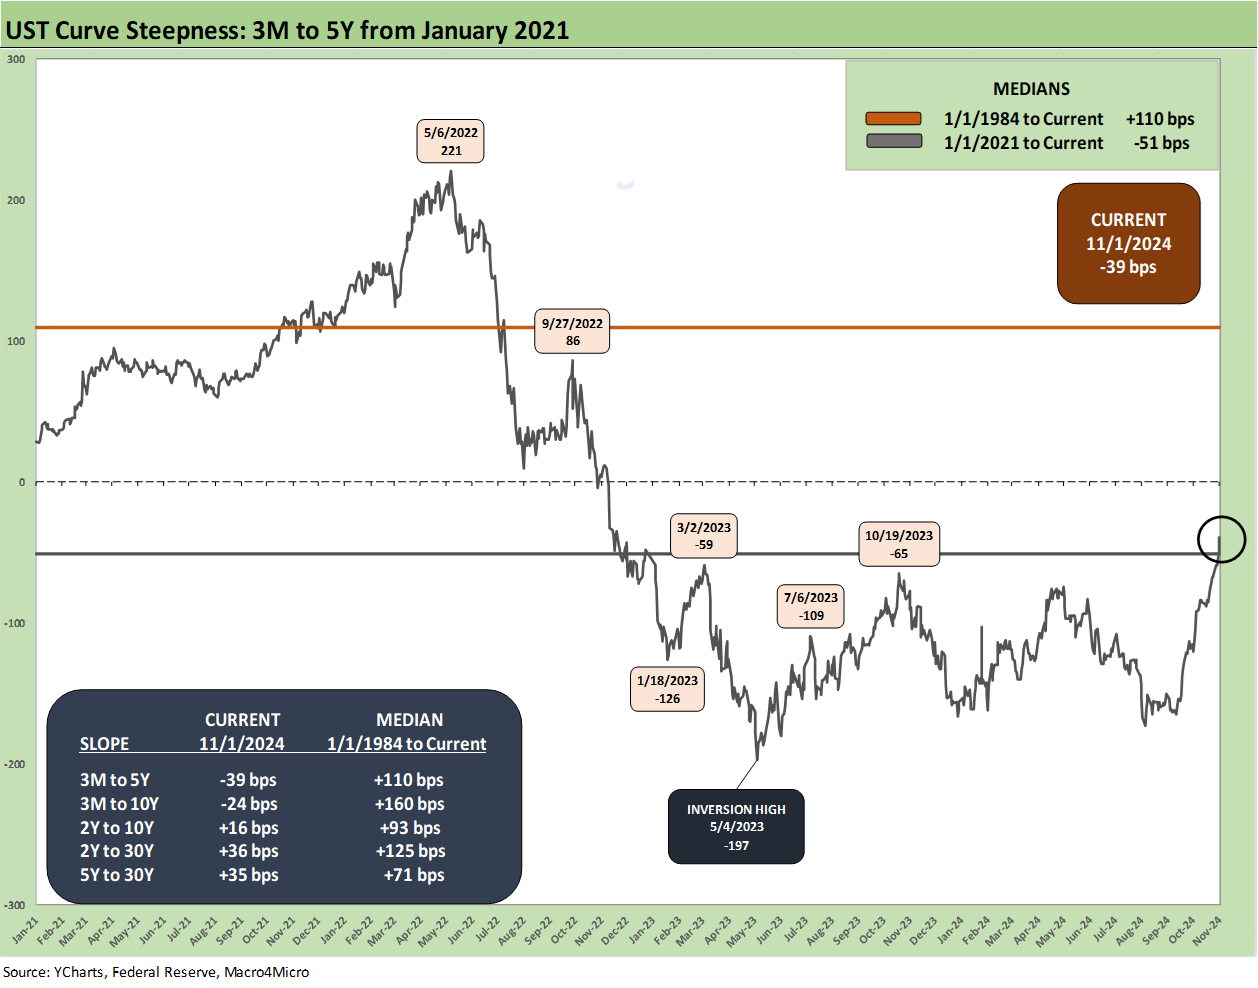
The above chart shortens the timeline to the start of 2021 for a more granular look at the ride across the transition from ZIRP to a tightening cycle and now an easing policy. We see the peak slope of +221 bps in May 2022 down to a peak inversion in May 2023 at -197 bps. The market has clawed back to -39 bps.
A lot of easing and a static curve could get us back to median, but the idea of higher rates in 5Y to 10Y is a very defensible theory given the need to refinance and fund massive deficits and attract demand. Economic trends and policy execution outside the Fed will be getting a lot more attention immediately given the array of “Day 1” promises (including Mass Deportation).

We wrap with our usual chart that details the cumulative UST deltas since March 2022 when ZIRP ended. The above chart also includes the 12-31-20 UST curve and peak 10Y UST date of 10-19-23 as frames of reference. The shape and level of the UST front end makes the word “normalization” a very challenging word to define in how this current curve gets back to normal without lower front-end rates and a higher long end.
Contributors:
Glenn Reynolds, CFA glenn@macro4micro.com
Kevin Chun, CFA kevin@macro4micro.com
See also:
Footnotes & Flashbacks: Asset Returns 11-3-24
Mini Market Lookback: Showtime 11-3-24
Payroll Oct 2024: Noise vs. Notes 11-2-24
All the Presidents’ Stocks: Beware Jedi Mind Tricks 11-1-24
PCE Inflation Sept 2024: Personal Income and Outlays 10-31-24
Employment Cost Index Sept 2024: Positive Trend 10-31-24
3Q24 GDP Update: Bell Lap Is Here 10-30-24
The Politics of Objective GDP Numbers: “Flex Facts” on Growth 10-30-24
Tariffs: The EU Meets the New World…Again…Maybe 10-29-24
JOLTS Sept 2024: Solid but Lower, Signals for Payroll Day? 10-29-24
Footnotes & Flashbacks: Credit Markets 10-28-24
Footnotes & Flashbacks: State of Yields 10-27-24
Footnotes & Flashbacks: Asset Returns 10-27-24
Mini Market Lookback: Burners on Full 10-27-24
Trump, Trade, and Tariffs: Northern Exposure, Canada Risk 10-25-24
Durable Goods Sept 2024: Taking a Breather 10-25-24
New Home Sales: All About the Rates 10-25-24
PulteGroup 3Q24: Pushing through Rate Challenges 10-23-24
Existing Home Sales Sept 2024: Weakening Volumes, Rate Trends Worse 10-23-24
State Unemployment Rates: Reality Update 10-22-24
Housing Starts Sept 2024: Long Game Meets Long Rates 10-18-24
Trump at Economic Club of Chicago: Thoughts on Autos 10-17-24
Retail Sales Sep 2024: Taking the Helm on PCE? 10-17-24
Industrial Production: Capacity Utilization Soft, Comparability Impaired 10-17-24
CPI Sept 2024: Warm Blooded, Not Hot 10-10-24
HY OAS Lows Memory Lane: 2024, 2007, and 1997 10-8-24