
Mini Market Lookback: Showtime 11-3-24
We look back at a very mixed week for market performance with weaker equities, higher yields and Mag 7 letdown.


Let’s bring it home for Donny big guy. I love my trolls…
This week brings the popular vote (Trump looking at a potential streak of 0 for 3), but the electoral college tally is the main event in what many see around the world as the unusual US system that allows de facto minority control of the White House and Senate.
The report this week from the Georgia Secretary of State on Russian troll activity (AI and videos) is a sign of the times. It offers a reminder that if Trump loses, the market should expect waves of litigation, protests, violent demonstrations, certification chicanery, and 24/7 misinformation. If Harris loses, we will only get demonstrations.
For now, nonpartisan polls see it as a tossup. Hanging in the balance is what will actually get legislated by Congress or unilaterally dictated by the White House later in January with mass deportation and tariffs offering an outlying extreme policy risk that is not tied to Senate and House control.
Congress will still need to get past the debt ceiling deadline (Jan 2025) as a backdrop to the never-ending drama of an increasingly stressed Democracy with a low-competence and ethically impaired Congress trying to get anything done.
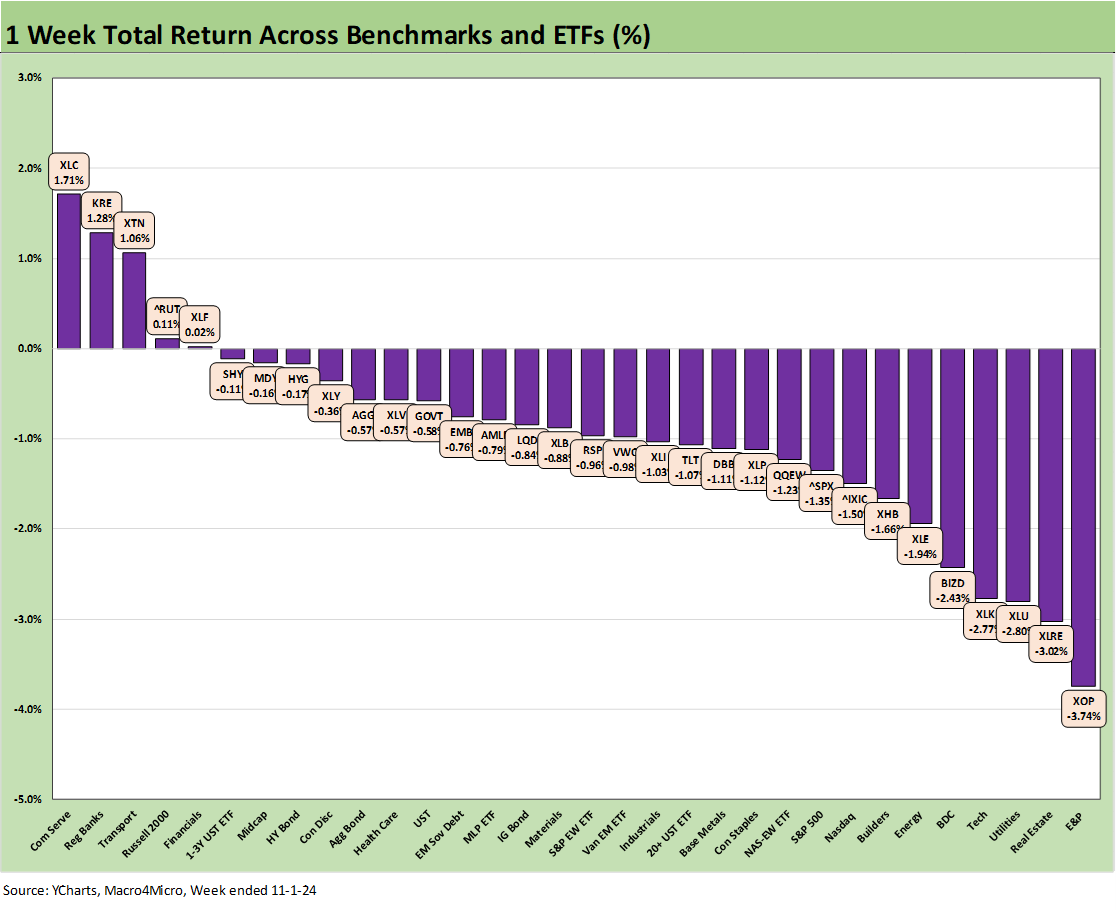
The above chart posts the 1-week returns across the 32 benchmarks and ETFs we track each week. This week is relatively ugly and only looks good compared to last week (see Footnotes & Flashbacks: Asset Returns 10-27-24, Mini Market Lookback: Burners on Full 10-27-24). Last week we saw 2 positive and 30 negative for the week while the above is 5 positive and 27 negative.
We see energy weak with E&P (XOP) in last place and the broad Energy ETF (XLE) in the bottom quartile along with some interest rate sensitive industries such as Real Estate (XLRE), Utilities (XLU), and Homebuilders (XHB) feeling the heat of long rates. Tech also had a rough week in the Mag 7 as we cover below. Weak Mag 7 numbers wagged the Tech ETF (XLK) with the Equal Weight NASDAQ 100 (QQEW) in the red but a little better than the NASDAQ.
We will be out with full asset returns later today with more time horizons, but the battle of valuations is facing more than a few headwinds on rates and a mixed earnings picture. There will be asset allocators who tap the brakes to wait and sort out the policy maelstrom ahead.

The above chart drives home the weak response to the biggest week for Mag 7 earnings reports as Amazon and Alphabet pleased the market while Meta, Apple, and Microsoft got thumbs down. We see the entire list above with only 2 lines positive (AMZN, GOOG) and the rest negative with the S&P 500 and NASDAQ in a tight band in the lower half of the -1% range.
We see Tesla took another beatdown after it had popped the prior week (+22%) with its earnings, but this week saw a -7.5% hit. Taiwan Semi (TSM) was second to last just behind NVDA. That all came in a week when NVIDIA was added to the Dow Jones Industrials index and the Gang of 30 as Intel was bumped off (Side Note: Sherwin Williams also took Dow Chemical’s spot).

As we detailed across the week (see links below), the economic numbers were solid in terms of the critical consumer sector as PCE consumption metrics showed a consumer that was resilient and busy (see PCE Inflation Sept 2024: Personal Income and Outlays 10-31-24).
The inflation signals could be seen as mixed on the week with Services sticky as always, but the sub-2% PCE line cited in the 3Q24 GDP report (see 3Q24 GDP Update: Bell Lap Is Here 10-30-24) and the 2.1% Sept 2024 headline PCE price index reassured on inflation and how the FOMC could stay the course. In one of those less watched indicators, the Employment Cost Index also helped the FOMC story line (see Employment Cost Index Sept 2024: Positive Trend 10-31-24).
Meanwhile, a set of distorted payroll numbers were reassuring for some on the timing of FOMC plans to ease this coming week. The robust consumer indicators overall were not helpful for those wanting to see a UST bull flattener nirvana scenario unfold on rates even with continued easing or a downward UST shift out in the 10Y area. The payroll report (adjusted for strikes and skipping the weather theories) showed adjusted job adds totaled around 100K or higher (see Payroll Oct 2024: Noise vs. Notes 11-2-24).
Trump (econometric wizard that he is) was out on the rally trail calling the 12K payroll adds a “depression” even as the Biden term job adds and stock markets still crush his performance (with or without COVID). We have covered that in past commentaries. In addition, this last week the JOLTS number went below Trump’s peak for the first time at 7.4 million vs. Trumps Nov 2018 peak of 7.5 million (see JOLTS Sept 2024: Solid but Lower, Signals for Payroll Day? 10-29-24).
As for the Trump fairy tales of doom, the Biden stock market has crushed the Trump stock market. That is significant since equity markets were such a front burner marketing tool for Trump during his term (see All the Presidents’ Stocks: Beware Jedi Mind Tricks 11-1-24). Trump seldom brings that up these days. Surprised?
The war on facts and numbers is all part of the political process in the US that has taken the biggest dive since Watergate. That was back in the days when both sides of the aisle had some courage and operated on principle. It is not hard to guess this is something that old school conservatives like a Goldwater and center left liberals of any stripe would agree on with respect to Trump (cue the patriotic music).

The 10Y UST and Freddie Mac mortgage chart has the same themes as last week – only worse. The move to 6.72% on the Freddie Mac benchmark shows mortgages migrating back closer to 7.0% after many indicators and quoted levels in the 30Y mortgage markets already had crossed 7%. That is definitively bad for existing home sales as rates are what drives the monthly payment pain.
Curve moves can be more mixed for areas like auto finance with the shorter duration liabilities in that bucket, but the 2Y UST has not been a picnic either for borrowing cost trends. That will take more help from the FOMC or a dim view of economic prospects – or both. The trap in that weaker economy scenario is what brings rates lower can also be the same forces prompting consumers to retrench – or lose their jobs.

The above chart shows HY OAS stayed solid and tightened by -6 bps on the week to +283 bps. We have looked at a few of the histories of prior peaks in earlier commentaries (see HY OAS Lows Memory Lane: 2024, 2007, and 1997 10-8-24). That +283 bps is a very long way from the +465 bps median since 1997.
The cash market seems to have called a truce with itself around pricing in the theoretical post-election risks at this point. That could change soon enough depending on who wins and whether Congress can be a check. There is no controlling tariffs, but there are constitutional and legislative checks on taxes and spending. Tariffs and mass deportation have laws on the books that give the White House free reign. We saw that for tariffs in 2018-2019. That is not a theory. It is a fact. The GOP Senators who led the effort to legislate narrow checks on Trump Section 232 tariffs were effectively purged. Then the Senate GOP got in line (no Profiles in Courage there).

The “HY OAS minus IG OAS” differential tightened by -7 bps the past week to +197 bps vs. the long-term median of +327 bps. That shows a lot of confidence in the ability of the credit cycle to remain compressed in a market where total returns have not been kind to bond investors in 2024 but have been at least kinder to riskier credit asset subsectors.
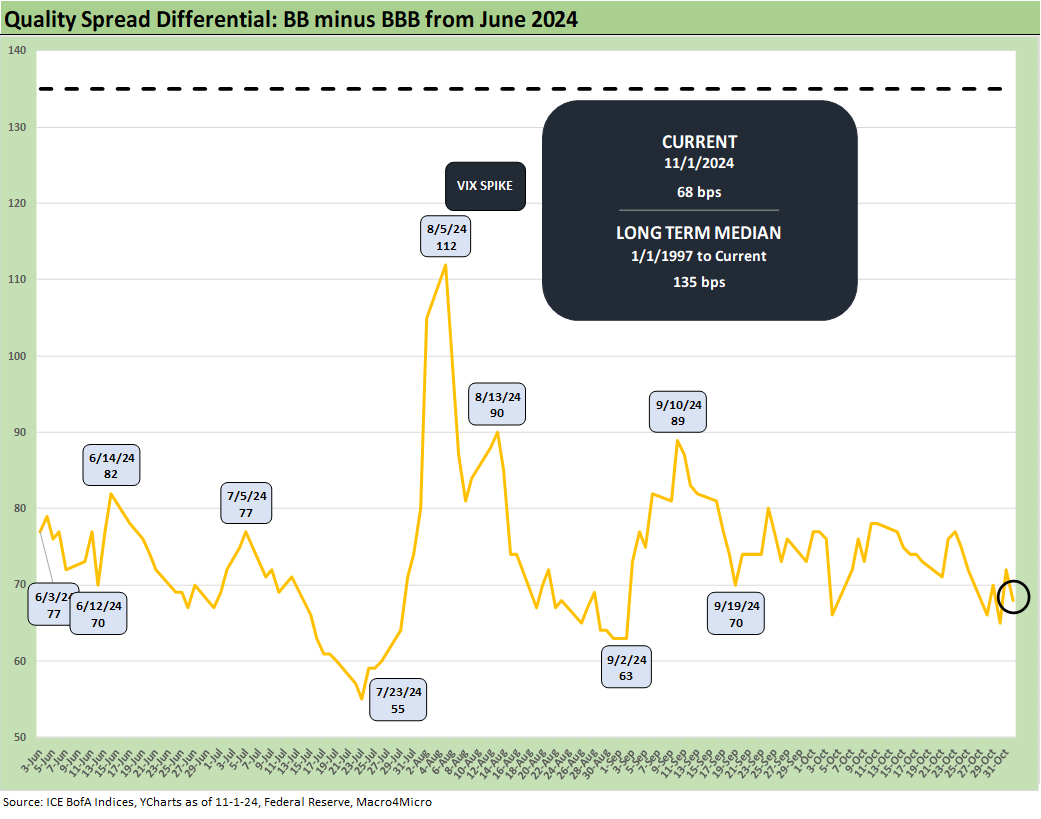
The “BB OAS minus BBB OAS” quality spread differential tightened by -4 bps this week to +68 bps, well inside the long-term median of +135 bps. We are wide to the July 2024 lows of +55 bps.
The midsection of the credit tiers in the BBB and BB tiers have proven to be a way of playing a combination of riskier credit tiers (by IG standards) for investors while still taking some duration risk. This relationship has been very compressed between the two in relative excess returns as well.
Contributors:
Glenn Reynolds, CFA glenn@macro4micro.com
Kevin Chun, CFA kevi@macro4micro.com
See also:
Payroll Oct 2024: Noise vs. Notes 11-2-24
All the Presidents’ Stocks: Beware Jedi Mind Tricks 11-1-24
PCE Inflation Sept 2024: Personal Income and Outlays 10-31-24
Employment Cost Index Sept 2024: Positive Trend 10-31-24
3Q24 GDP Update: Bell Lap Is Here 10-30-24
The Politics of Objective GDP Numbers: “Flex Facts” on Growth 10-30-24
Tariffs: The EU Meets the New World…Again…Maybe 10-29-24
JOLTS Sept 2024: Solid but Lower, Signals for Payroll Day? 10-29-24
Footnotes & Flashbacks: Credit Markets 10-28-24
Footnotes & Flashbacks: State of Yields 10-27-24
Footnotes & Flashbacks: Asset Returns 10-27-24
Mini Market Lookback: Burners on Full 10-27-24
Trump, Trade, and Tariffs: Northern Exposure, Canada Risk 10-25-24
Durable Goods Sept 2024: Taking a Breather 10-25-24
New Home Sales: All About the Rates 10-25-24
PulteGroup 3Q24: Pushing through Rate Challenges 10-23-24
Existing Home Sales Sept 2024: Weakening Volumes, Rate Trends Worse 10-23-24
State Unemployment Rates: Reality Update 10-22-24
Housing Starts Sept 2024: Long Game Meets Long Rates 10-18-24
Trump at Economic Club of Chicago: Thoughts on Autos 10-17-24
Retail Sales Sep 2024: Taking the Helm on PCE? 10-17-24
Industrial Production: Capacity Utilization Soft, Comparability Impaired 10-17-24
CPI Sept 2024: Warm Blooded, Not Hot 10-10-24
HY OAS Lows Memory Lane: 2024, 2007, and 1997 10-8-24
Payroll Sept 2024: Rushing the Gate 10-4-24