Footnotes & Flashbacks: Credit Markets 11-4-24
Despite the mixed results for equities and the UST curve action, credit spreads stay tight in a narrow band and await more catalysts.
Mass Deportation Working Group
HY spreads tightened again last week with quality spreads narrowing between HY and IG and between BBB and BB with all eyes now turning to an election crossroads.
This election has already blown past 1968 and goes back to 1860 for drama and toxicity and which for some constituencies has morphed into hateful tribalism.
The strange parallel universe shows economic numbers near record payroll counts, a flat unemployment rate at levels that traditionally would be seen as full employment, and a set of GDP numbers in 3Q24 that show domestic fixed investment levels materially higher than what was seen in the last pre-COVID quarter of 4Q19.
UST setbacks and pain for duration has been the bigger reality for credit markets with a bear steepening since the FOMC easing as a fresh bite of the apple by the FOMC comes this week.
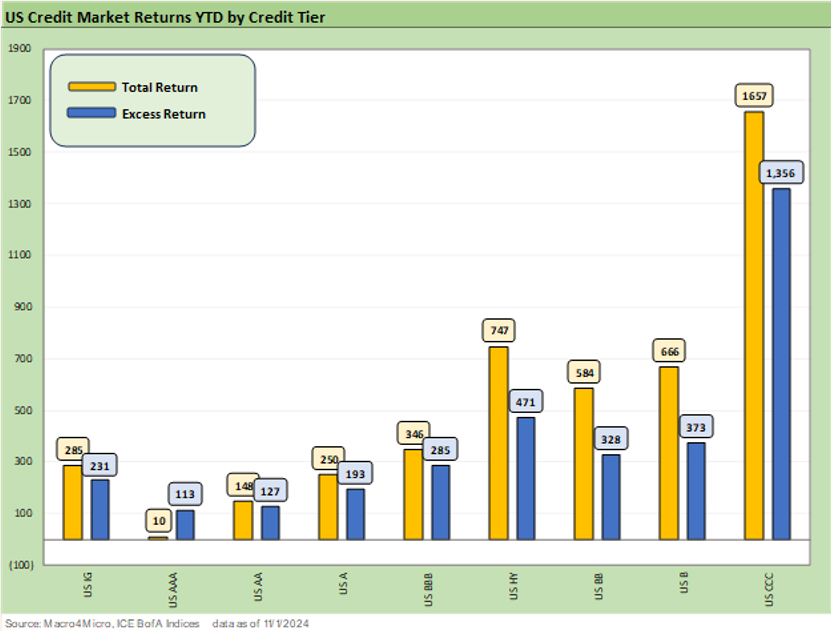
The above chart updates the running YTD total returns and excess returns for IG and HY and for the ratings tiers. The pattern is rational for excess returns and in line with relative risk in the context of US economic trends and industry fundamentals. What we all wrestle with now is how to readjust expectations for forward-looking risk when the smoke clears (we hope not literally) on the White House, Senate, and House lineup.
We have seen mispriced and overpriced markets before, but this current transition period is heavily tied to the canyon-esque gap in planned economic policies. We certainly do not have much precedent for mass deportation and enforced migration of employed people with paychecks in the modern, postwar economy (that “modern economy” definition allows us to skip the Trail of Tears and Japanese internments, etc.).
We had some dry runs in tariffs and trade spats, and those did not go well and required taxpayer funded bailouts. Revisiting those periods for comparison is for another time if needed. A large-scale trade war has not occurred in the postwar economic period. More than a few decades of globalization only raises the stakes now.
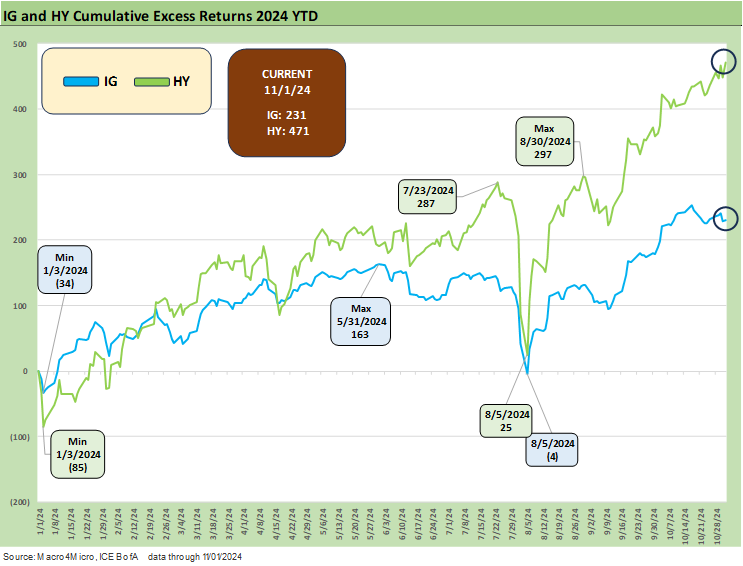
The IG vs. HY excess returns are broken out and updated above. The relationship makes sense and will remain sound until some “event” breaks the smooth relationship. We saw a mini trial run in early August of how quickly the patterns can get derailed. We know that negative excess return differentials happen across the cycles and have been very common. We will revisit those on another day (see Credit Performance: Excess Return Differentials in 2023 1-1-24).
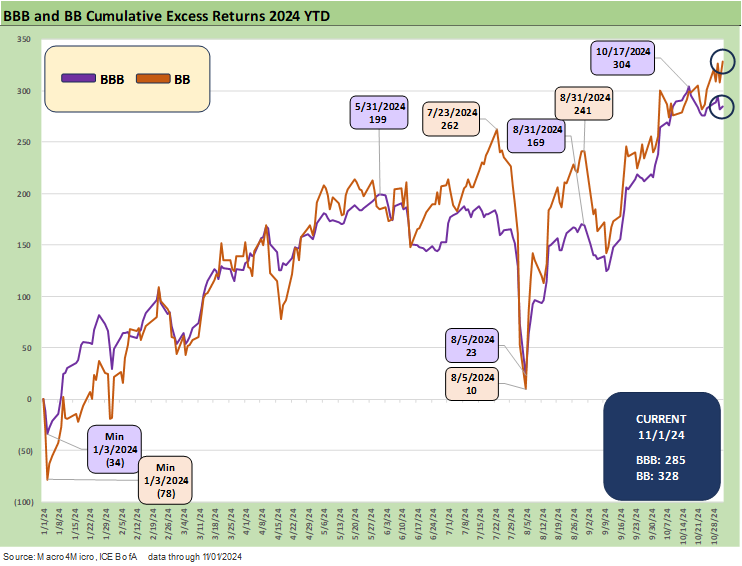
The above chart updates the excess returns for the BBB vs. BB tier. This one shows the two crashing into each other YTD and briefly inverting. That is a tribute to a lot of people chasing BB tier names from IG and many HY lite strategies evolving in the investor base. The search for coupon income and names with upside is always a major exercise for medium risk investors. We see the BB tier bond mix as medium risk in the context of the full range of credit tiers and the growing base of private credit.
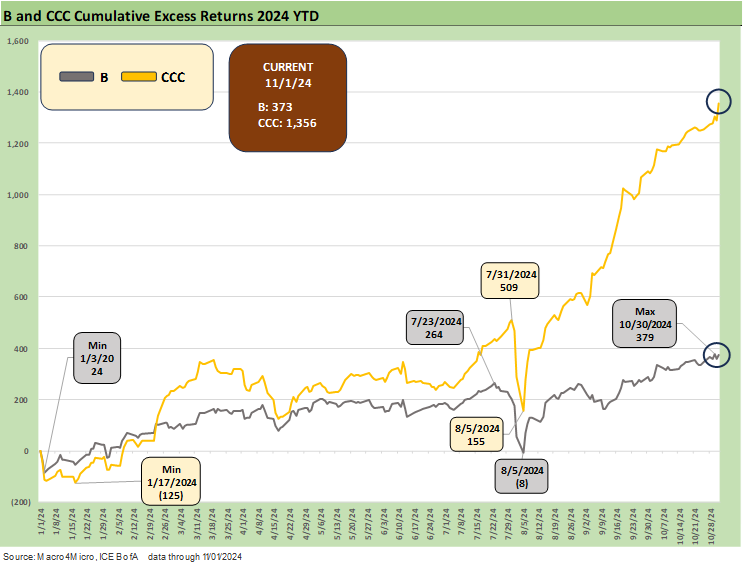
The above chart was a wakeup call on the traditional view of the CCC tier as subject to extreme gap risk, but that seems to be changing with so much of the excessively leveraged deal flow migrating over to private credit. The CCC tier is always one about names and special situations and less about “generic credit tier pricing,” but the changes in private credit and planning by private equity deal architects is going through its latest evolution. Asset class opportunities in credit are on an expansion bender at this point.
Even for the skeptics who use terms like “volatility washing” (that was a good one!) and describe private credit as the “kinder, gentler mismarking,” the reality is that private credit brings different liquidity dynamics from the sort of pressures that would expose HY funds to outsized price risk.
Private credit offers a distinctive approach to managing leveraged counterparties and price risk that is in some ways a throwback to insurance private placements (where I started my credit career in the early 1980s) or leveraged lending by banks. It is less about the outflow risk that had riddled the HY funds with realized losses during cyclical turns back in the bad old days (especially in the late 1980s).
The trend line for IG spreads and the absolute levels in the sub-90 bps range look a lot like recent weeks with IG OAS ending at +86 bps and in a holding pattern. IG saw a 1 basis point widening for the week and is -5 bps tighter over the past month while HY was -6 bps tighter on the week and -23 bps tighter on the month.
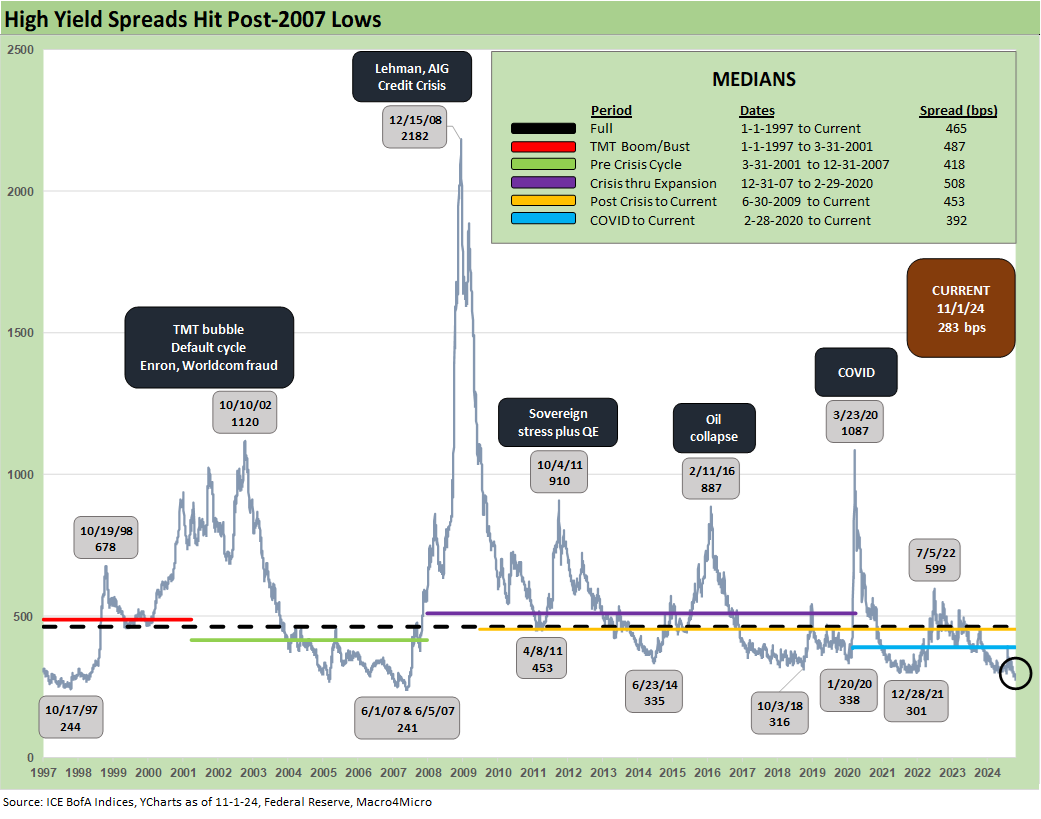
As noted in the prior chart comments, HY was -6 bps tighter on the week and -23 bps tighter over the trailing month and down to +283 bps. The ability of the HY index to remain below +300 bps for a protracted period has been seen before in credit cycle peaks such as 1997 (see HY OAS Lows Memory Lane: 2024, 2007, and 1997 10-8-24) and to a lesser extent in early 2007 (before it all blew up).
The 1997 credit year is a better parallel (for now) since the 2024 economic expansion had plenty of room to run (again, for now). The hope is that 2007 does not end up as a parallel to today. During the summer and fall of 2007, the world was set to come crashing down. That in turn set the stage for hedge fund implosions, an asset quality collapse in RMBS and structured credit and a threat to bank system health.
For 2024, we have very strong major banks, solid asset quality and an easing cycle underway (early 2007 was on the back end of a tightening cycle). The overall default risk exposure in HY bonds is low at this point and the mix is higher quality. The bigger debate is in private credit where the deal excess has been concentrated in this credit cycle in contrast to past late cycle excesses in HY bonds (1987-1988, 1998-1999, 2006-2007).
The contingent risk challenge for 2024 is that we have a candidate running around with policy TNT and a book of matches (mass deportation, tariff excess, trade war risk, etc.) that could add some all-new ingredients to the macro risk checklist. In contrast, liberals looking to raise taxes is not new. The deficit math now is off the charts no matter who gets elected.
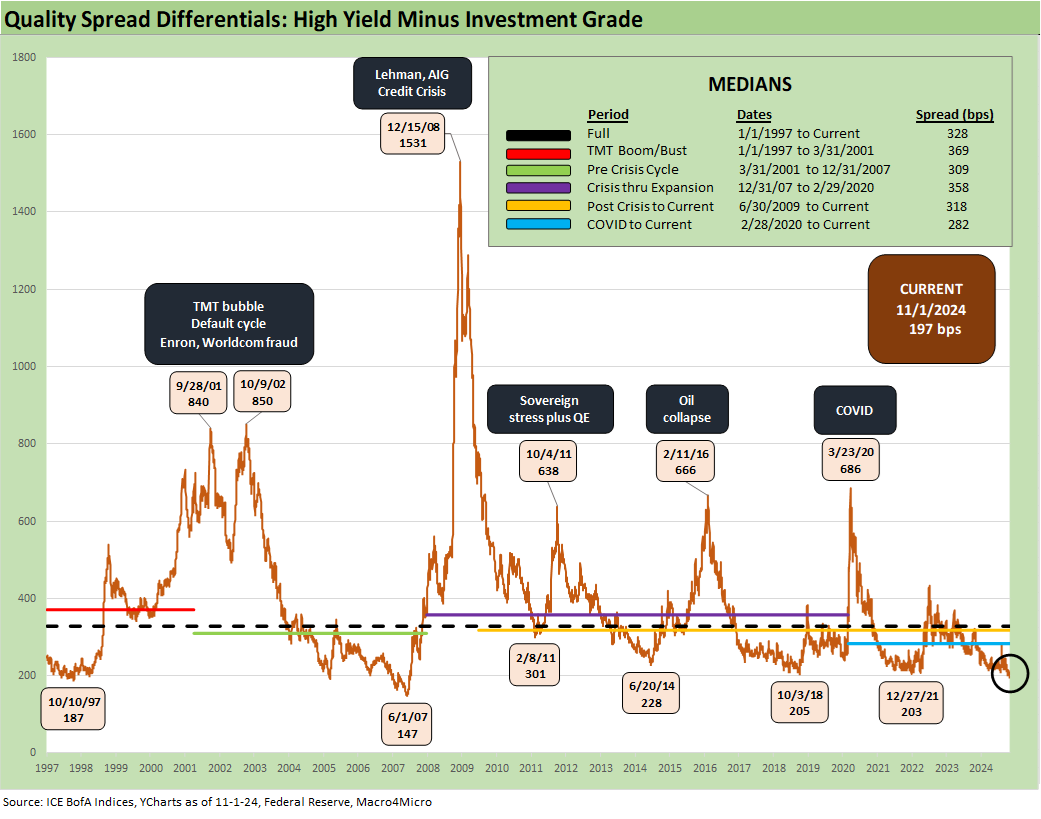
The above chart plots the “HY OAS minus IG OAS” quality spread differential. We looked at this in the earlier Mini Market Lookback posted over the weekend, and it tightened by -7 bps with a move through the +200 bps line to +197 bps from last week’s +204 bps (see Mini Market Lookback: Showtime 11-3-24).
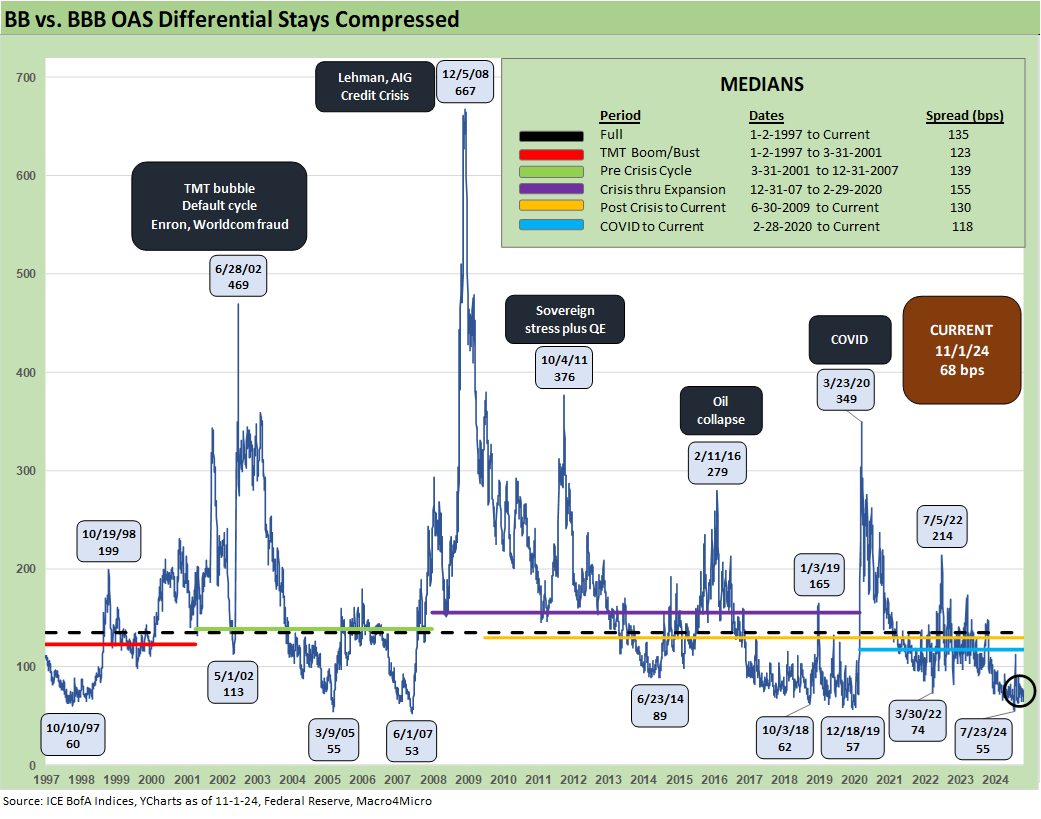
The above chart updates the “BB OAS minus BBB OAS” differential for a quality spread trend line for the credit tier midsection. The differential compressed by another -4 bps this past week from +72 bps to +68 bps. That is still wide to the +55 bps tights of July but a very long way from the long-term median of +135 bps.
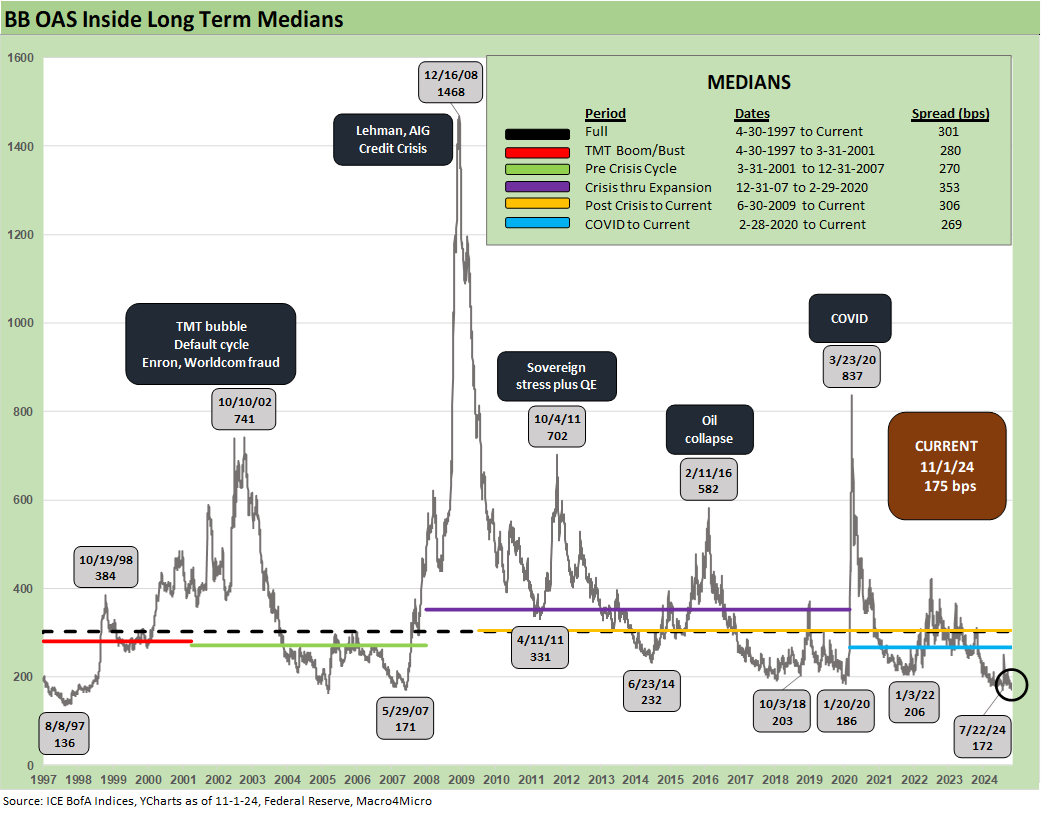
The BB tier OAS tightened by -4 bps on the week to +175 bps. BB OAS has run through the +200 bps barrier last seen in Jan 2020 just ahead of COVID when the market hit +186 bps. HY OAS was north of +200 bps during the lows of Oct 2018 and June 2014 while mid-2007 saw +171 bps lows. We are now again in the froth zone for the largest tier of the HY market that now features a lot of IG and BBB tier demand.
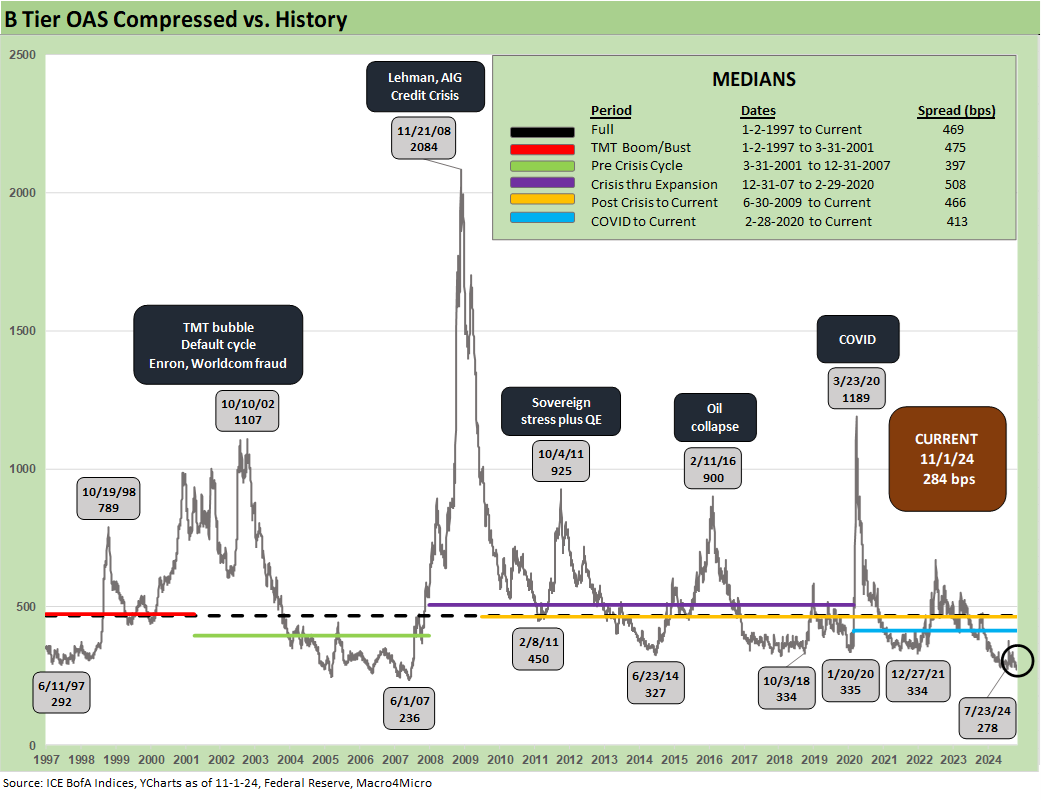
For this past week, the B tier tightened by -1 bp to +284 bps. The B tier OAS has been the bigger story of this credit pricing cycle in what traditionally has been the sweet spot of the HY market back to the old days of the 1980s. Running through the +300 bps line was not seen in the lows of Dec 2021 or during the low ticks of Jan 2020, Oct 2018, or June 2014 as noted in the chart. True to form, early June 2007 was heading closer to the +200 bps line at a low of +236 bps in a bubble for the ages. The June 1997 lows hit +292 bps.
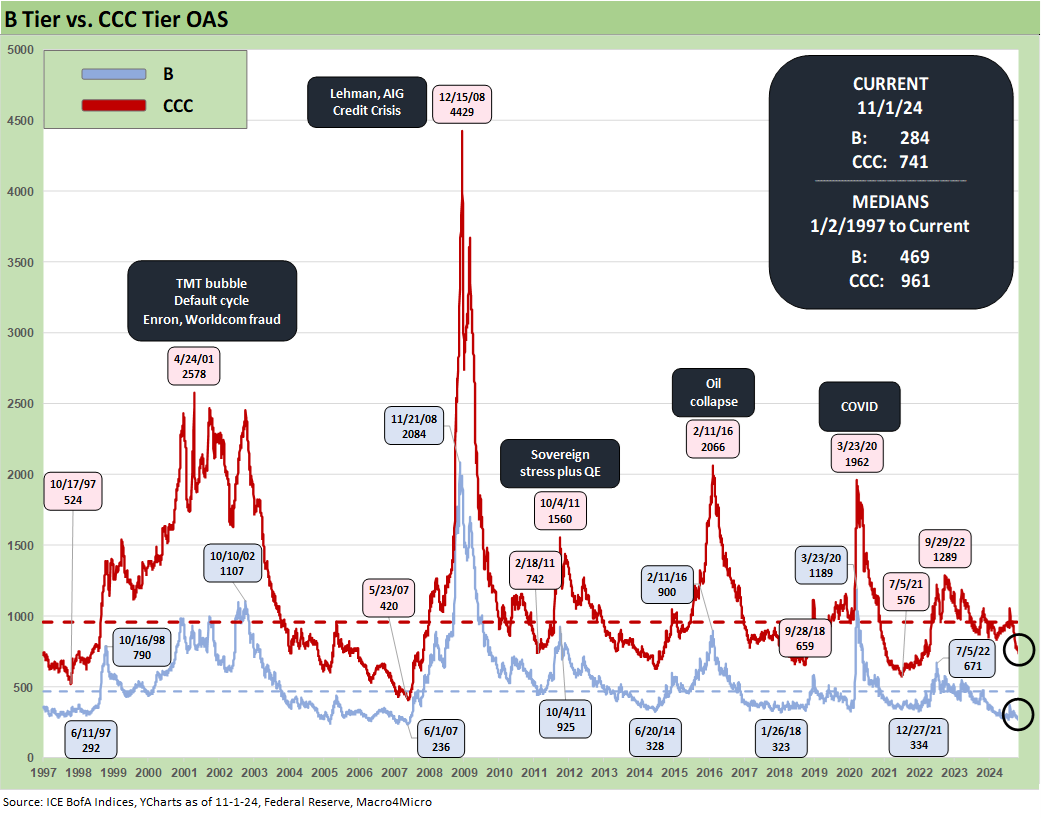
The above chart plots the time series of the B vs. CCC tier. The pattern of divergence during periods of severe market disruptions (fall 2008) and impaired secondary liquidity (fall 2011, late 2015/early 2016) or ahead of default cycles (defaults as a lagging indicator) are in evidence above in the CCC tier OAS spikes. That is why CCC tier bonds and select B tier bonds can behave more like high-risk equities during times when distressed debt investors get their hormones running wild.
The above chart shortens the time horizon to a starting point just before the tightening cycle got underway. The pattern of CCC tier pricing can get wild during periods of uncertainty and that is where seasoned HY investors can find opportunities or steel their nerves during big mark-to-market swings without selling into weakness.
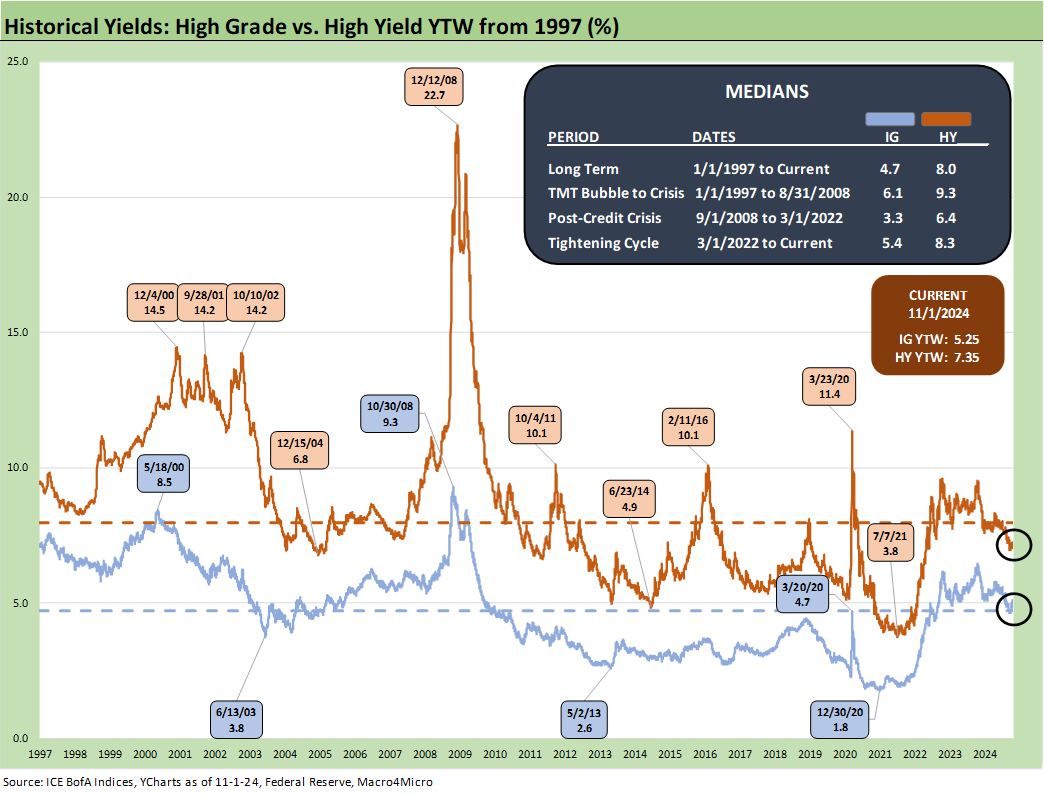
The above chart updates the time series for IG and HY YTW across the cycles. We see a long-term median for IG of 4.7% and HY of 8.0%. We also include some interesting time horizon medians with the pre-crisis period before ZIRP, and some notable periods after the crisis when UST rates were grossly distorted by Fed policy.
We consider the pre-crisis period as the most relevant comparison (6.1% IG, 9.3% HY). After all, we have just gone through a tightening cycle and into an easing cycle, so that has more in common with a “normal” monetary backdrop across the ages (to the extent anything in credit markets has been all that normal across time since the 1980s).
The current IG and HY index YTW levels reflect the very compressed spreads and a low yield curve very unlike anything we have seen outside the ZIRP markets across UST histories since the Carter years (see Footnotes & Flashbacks: State of Yields 11-3-24).
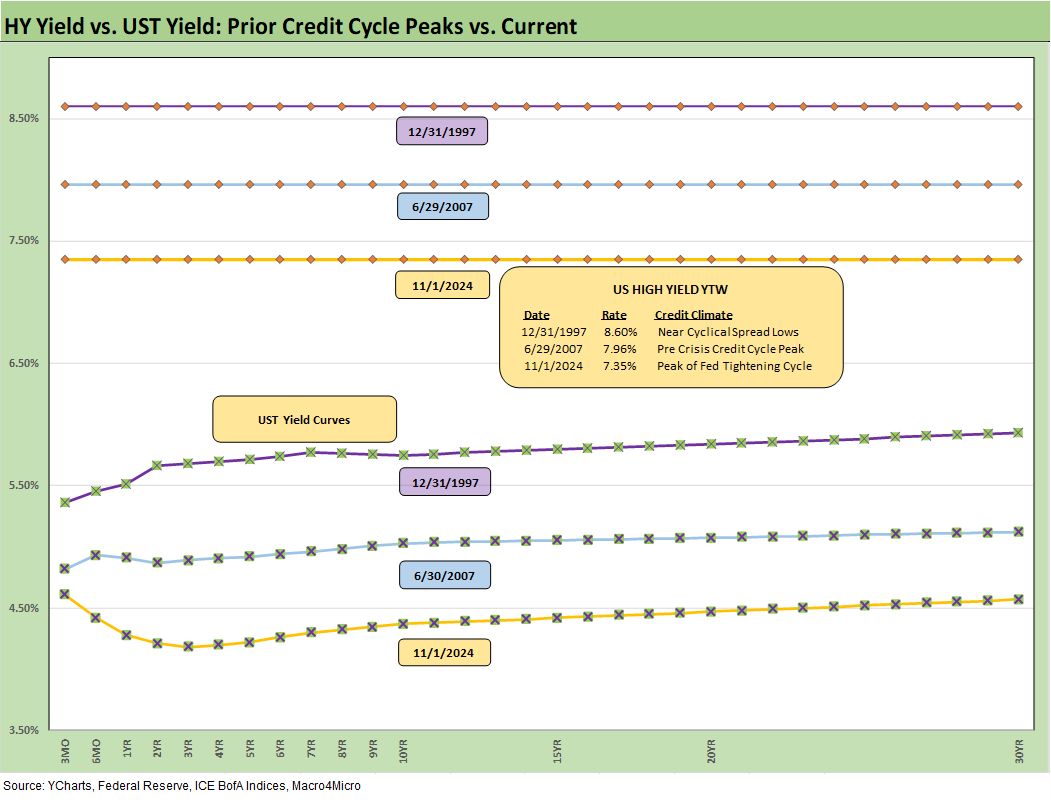
The above chart frames current IG YTW levels with the two prior credit cycle peaks of mid-2007 and late 1997 when spreads were compressed and credit risk appetites quite high. We plot index yields on the horizontal lines and include the UST curves for the same dates.
With $4.2 trillion in face value of BBB tier debt in the IG index, we live in a very different world than the prior cycles in the chart with the BBB tier at over 46% of an index with $9.1 trillion in face value.
The above chart does the same drill for the HY markets that we did in the prior chart for IG. The UST curve rules the roost for HY bond yields with historically tight spreads. Coupon income and less duration exposure are on the short list of attributes that have helped HY outperform IG. Both markets pay low risk premiums vs. UST in historical context.
The good news for HY exposure is that the most aggressively leveraged deals are over in private credit and therefore the HY mix has less spread gap risk and default risk than in prior origination cycles. The HY bond index of $1.36 trillion in face value shows over 52% of that in the BB tier.
Contributors:
Glenn Reynolds, CFA glenn@macro4micro.com
Kevin Chun, CFA kevin@macro4micro.com
See also:
Footnotes & Flashbacks: State of Yields 11-3-24
Footnotes & Flashbacks: Asset Returns 11-3-24
Mini Market Lookback: Showtime 11-3-24
Payroll Oct 2024: Noise vs. Notes 11-2-24
All the Presidents’ Stocks: Beware Jedi Mind Tricks 11-1-24
PCE Inflation Sept 2024: Personal Income and Outlays 10-31-24
Employment Cost Index Sept 2024: Positive Trend 10-31-24
3Q24 GDP Update: Bell Lap Is Here 10-30-24
The Politics of Objective GDP Numbers: “Flex Facts” on Growth 10-30-24
Tariffs: The EU Meets the New World…Again…Maybe 10-29-24
JOLTS Sept 2024: Solid but Lower, Signals for Payroll Day? 10-29-24
Trump, Trade, and Tariffs: Northern Exposure, Canada Risk 10-25-24
Durable Goods Sept 2024: Taking a Breather 10-25-24
New Home Sales: All About the Rates 10-25-24
PulteGroup 3Q24: Pushing through Rate Challenges 10-23-24
Existing Home Sales Sept 2024: Weakening Volumes, Rate Trends Worse 10-23-24
State Unemployment Rates: Reality Update 10-22-24
Housing Starts Sept 2024: Long Game Meets Long Rates 10-18-24
Trump at Economic Club of Chicago: Thoughts on Autos 10-17-24
Retail Sales Sep 2024: Taking the Helm on PCE? 10-17-24
Industrial Production: Capacity Utilization Soft, Comparability Impaired 10-17-24
CPI Sept 2024: Warm Blooded, Not Hot 10-10-24
HY OAS Lows Memory Lane: 2024, 2007, and 1997 10-8-24


