
Footnotes & Flashbacks: Asset Returns 11-3-24
We look at another week of poor returns as Oct was punished by rates and valuation nerves with Election Day arriving on Tuesday.


Anyone feeling tense?
We look at another week where the peak Mag 7 reporting and waves of important macro data reassured on the economic cycle and the ability of the FOMC to ease this coming week but did not fortify nerves on valuation in equities and lagging returns on duration in bonds.
The very strong LTM and YTD numbers have stalled over the past month with a heavy mix of negative returns, but banks and financials were solid and select tech names made a bit of a comeback in October.
The gut check has now arrived on how the market will be pricing in the post-election variables such as tariffs, mass deportation, and deficit expectations based on who wins the White House and whether there will be any checks and balances.

The above table updates the high-level benchmarks we watch in debt and equities each week with a more granular review of 32 benchmarks and ETFs further below. All four debt benchmarks are negative again this week for the trailing 1-month period with longer-duration indexes the bigger losers and IG Corporates and UST a little more in the red for this rolling 1-month period.

The above chart updates the 1500 and 3000 series with the 1-month numbers getting worse after this week and especially so in Energy. We see Real Estate sagging again on the curve while Financials have performed well with more FOMC easing action expected following a very good earnings season for banks. That leaves 4 out of 6 lines in negative range for the 1-month period vs. 1 out of 6 last week for the rolling month.
The rolling return visual
In the next section, we get into the details of the 32 ETFs and benchmarks for a mix of the trailing periods. Below we offer a condensed 4-chart view for an easy visual on how the mix of positive vs. negative returns shape up. This is a useful exercise we do each week looking for signals across industry groups and asset classes. We also have a YTD version that we include in the broader commentary on the time horizons further below.

The above chart highlights another adverse trend in 1 week and 1 month as the yield curve trends undermine performance and the valuation run across the past year is facing some second guessing. As we detail below, the 32 asset lines posted a median return of around 25% for the trailing 1-year, and that is a very tough act to follow with so many outlying policy outcomes to handicap (taxes, tariffs, mass deportation, etc.).
For example, the “drill drill drill” promise from Trump is controversial, but such a plan could be a gigantic household tax cut if oil collapses. At the same time, that implies that E&P names get slaughtered (and especially if the Saudis respond with a market share war again).
Tariffs and mass deportation could be an economic disaster via trade retaliation or trade wars or if broad-based, rising costs tied to the tariffs (which are paid by the BUYER not the selling country) results in inflation and/or margin erosion. We have covered all those topics in other work we have done (see Tariffs: The EU Meets the New World…Again…Maybe 10-29-24, Trump, Trade, and Tariffs: Northern Exposure, Canada Risk 10-25-24, Trump at Economic Club of Chicago: Thoughts on Autos 10-17-24 ).
The Magnificent 7 heavy ETFs…
Some of the benchmarks and industry ETFs we include have issuer concentration elements that leave them wagged by a few names. When looking across some of the bellwether industry and subsector ETFs in the rankings, it is good to keep in mind which narrow ETFs (vs. broad market benchmarks) get wagged more by the “Magnificent 7” including Consumer Discretionary (XLY) with Amazon and Tesla, Tech (XLK) with Microsoft, Apple, and NVIDIA, and Communications Services (XLC) with Alphabet and Meta.

The above chart covers the tech bellwethers as we update each week. We line them up in descending order of total returns for the 1-week period. We discussed this chart earlier in our Mini Lookback (see Mini Market Lookback: Showtime 11-3-24) The main takeaway for this past week was only 2 of the 5 Mag 7 names that reported passed muster in the market with AMZN and GOOG getting it done and META, AAPL, and MSFT getting snubbed.
The chart tells the story with NASDAQ, S&P 500, and Equal Weight NASDAQ 100 (QQEW) all in the red and TSLA slammed.

We already spent some time on the trailing week in our Mini Outlook posted earlier, and the 5-27 score for positive vs. negative is just a small improvement on last week’s 2-30. All 7 bond ETFs were negative and yet the HY ETF (HYG) and Short Duration 1Y to 3Y UST bond ETF (SHY) were both in the top quartile. Energy and interest-rate sensitive ETFs had another bad week as we already covered with an unfriendly UST curve we will look at in our separate Footnotes publication on yields.
In the top 5 with positive numbers, we see the Communication Services ETF (XLC) getting a lift from Alphabet among the 2 Mag 7 earnings reports that satisfied the markets this week with the other 3 disappointing. We looked at the tech bellwethers above. The Regional Bank ETF (KRE) and Financials (XLF) will likely get some positive news this coming week from the FOMC after a good earnings season.
The Transports ETF (XTN) has been performing better of late after a long stretch mired in the bottom quartile earlier in 2024 with some supportive cyclical trends and earnings season helping for some (not all) major names. XTN’s airline concentration benefited from the recent performance along with some names such as XPO and GXO.
A significant source of relative strength has been small caps (RUT) in recent periods. The Russell 2000 has been more consistent in contrast to the false start back in late 2023. Small caps have some overlap with the HY issuer base and with the BDC sector and their counterparties, so that is good news. While BDCs were soft for the 1-week period, the BDC ETF (BIZD) squeezed back into the top quartile this past month alongside small caps as covered in the next chart.

The 1-month time horizon score was 12-20 with the bond ETFs spread across the second, third, and bottom quartile in a low return month of October as detailed earlier. The median performance of the 32 benchmarks and ETFs was around -1.5%, so the post-Sept payroll struggle made for a rough month generally in the yield curve rebellion (see Payroll Sept 2024: Rushing the Gate 10-4-24).
The trailing 1-month mix shows the rough stretch for bonds and interest rate sensitive equities with the bottom 5 seeing Homebuilders (XHB) in last place and the long duration 20+ Year UST ETF (TLT) in second to last with the longer duration IG Corp ETF (LQD) third to last. We also see Utilities (XLU) and Real Estate (XLRE) in the bottom 5.
The winners on the month include some names with solid quarterly earnings reports such as the Regional Banks (KRE) and the broader Financials ETF (XLF). As mentioned above in the 1-week slot, Transports have been helped by a big airline rally as well as some decent cyclical indicators supporting some freight and logistics performers (XPO, GXO).
For the past month, the tech sector has performed reasonably well with Communications Services (XLC), NASDAQ, and the Tech ETF (XLK) in the top quartile. We framed the bellwether trailing 1-month mega-names earlier in this note with NVIDIA and Taiwan Semi ringing up double-digit returns for 1-month.
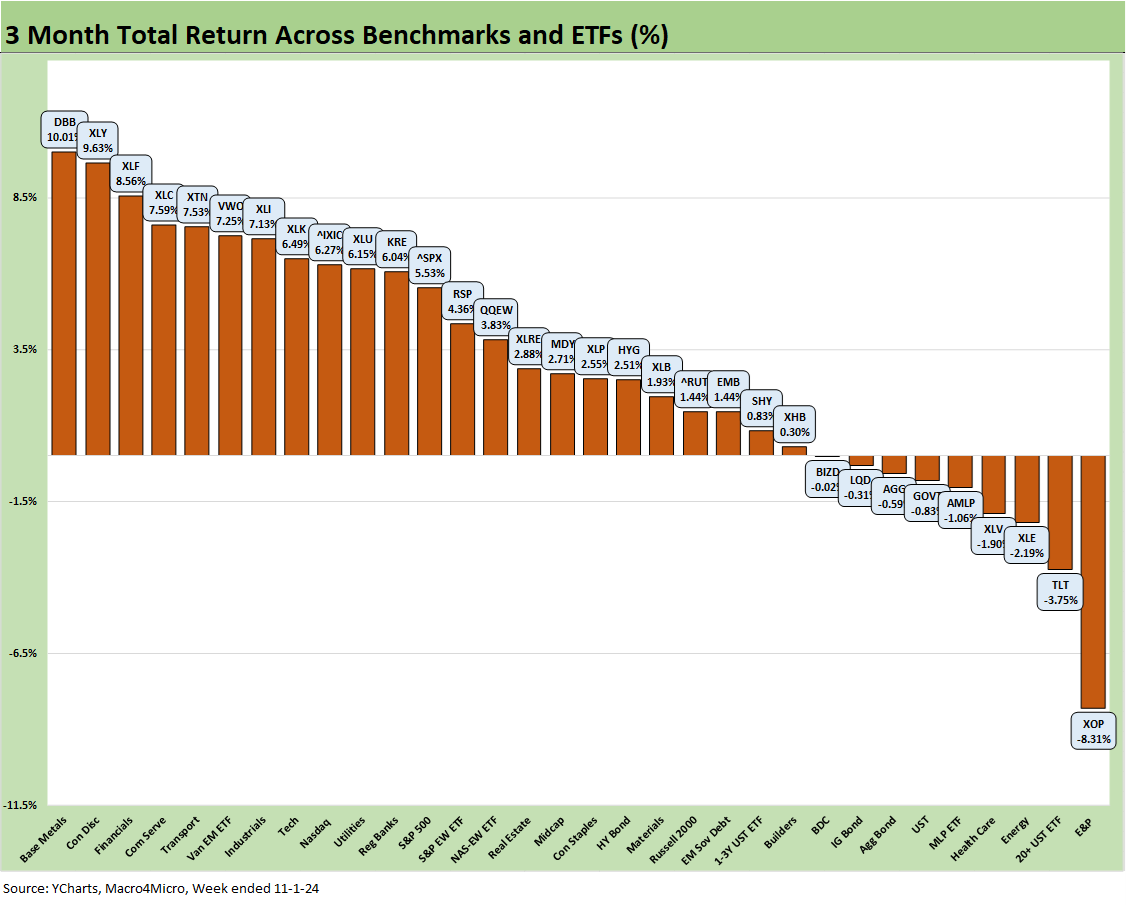
The 3-month time horizon gets the mix back into a net positive at a score of 23-9. The median return across the 32 line items is around +2.6% so that marks a notable fade in what has been a banner year in equities.
We see E&P on the bottom on measured Israeli target selection in Iran (energy not targeted) and less volatile headlines on the Lebanon front as the market settles into status quo chaos with the main swing factor potentially being Iran trying a head fake and escalating. The rhetoric has been mixed.
The recent adverse moves in the UST curve came after the initial easing and FOMC optimism sent the 10Y UST down to 3.6% vs. the current level just below 4.4%. We see the long duration UST 20+ Year ETF (TLT) in second to last with the UST ETF (GOVT), AGG, and IG Corp (LQD) also in the bottom quartile.
The top performer was Base Metals (DBB) as the market was pumped up around the China stimulus with the EM Equities ETF (VWO) also in the top quartile. For Mag 7 influences, we see the Consumer Discretionary ETF (XLY) and Communications Services ETF (XLC) and Tech ETF (XLK) all in the top quartile.
We also had some cyclical flavor with Industrials (XLI) and financial services with the Financial ETF (XLF) after a good earnings season for banks generally but major banks specifically.

The above chart reflects the impressive head start for equities in 2024 as the rally rolled out of Nov-Dec 2023 boom into a banner year and even better LTM metrics as we detail in the next chart. At 30 positive and 2 in negative range, there is not much new in this time horizon even after a few mediocre weeks that followed the big Sept payroll surprise.
The median returns in the mix of 32 asset lines is around 11%, but that is after an Oct fade. The LTM median asset return that includes the Nov-Dec 2023 rally is around 25.5%, so late 2023 is a major swing factor.
For the YTD period, we see the long duration UST ETF (TLT) and E&P (XOP) in the negative range with the TLT ETF at -5.1%. The bond ETFs have 6 of the 8 asset lines in the bottom quartile with HY (HYG) near the bottom of the third quartile.
The winners in the top quartile are Mag 7 heavy with Communications Services (XLC) on top at #1 and the Tech ETF (XLK) at #8 with the Mag 7 heavy NASDAQ and S&P 500 in the top quartile also. The Utilities ETF (XLU) and Homebuilders (XHB) have hung in the top quartile even if XHB has been taking some heat the past month as mortgages moved back closer to 7% and valuations were getting challenged after such an exceptional run. We see Financials (XLF) and Industrials (XLI) adding healthy diversified flavor in the mix of industries in the upper leaderboard ranks.

The LTM number still include the monster rally of Nov-Dec 2023 (see Footnotes & Flashbacks: Asset Returns 1-1-24 ). Homebuilders (XHB) still hold the prize at #1 with +56% returns, but that was +73% on an LTM basis a few weeks ago. Regional Banks (KRE) at #2 and Financials (XLF) at #3 show the top 3 leaders as being outside tech. The next tier in the top quartile is where tech and tech influences show up in force with Communications Services (XLC,) NASDAQ, S&P 500, and the Tech ETF (XLK).
We see that 6 of the 8 in the bottom quartile are bond ETFs. The EM Sovereign Bond ETF (EMB) is just across the line at the bottom of the third quartile. Interest rates right now are critical factors in the top and bottom quartile return changes. The FOMC is teed up again this week but will likely be a minor side story with the election pyrotechnics ready to explode.
Contributors:
Glenn Reynolds, CFA glenn@macro4micro.com
Kevin Chun, CFA kevin@macro4micro.com
See also:
Mini Market Lookback: Showtime 11-3-24
Payroll Oct 2024: Noise vs. Notes 11-2-24
All the Presidents’ Stocks: Beware Jedi Mind Tricks 11-1-24
PCE Inflation Sept 2024: Personal Income and Outlays 10-31-24
Employment Cost Index Sept 2024: Positive Trend 10-31-24
3Q24 GDP Update: Bell Lap Is Here 10-30-24
The Politics of Objective GDP Numbers: “Flex Facts” on Growth 10-30-24
Tariffs: The EU Meets the New World…Again…Maybe 10-29-24
JOLTS Sept 2024: Solid but Lower, Signals for Payroll Day? 10-29-24
Footnotes & Flashbacks: Credit Markets 10-28-24
Footnotes & Flashbacks: State of Yields 10-27-24
Footnotes & Flashbacks: Asset Returns 10-27-24
Mini Market Lookback: Burners on Full 10-27-24
Trump, Trade, and Tariffs: Northern Exposure, Canada Risk 10-25-24
Durable Goods Sept 2024: Taking a Breather 10-25-24
New Home Sales: All About the Rates 10-25-24
PulteGroup 3Q24: Pushing through Rate Challenges 10-23-24
Existing Home Sales Sept 2024: Weakening Volumes, Rate Trends Worse 10-23-24
State Unemployment Rates: Reality Update 10-22-24
Housing Starts Sept 2024: Long Game Meets Long Rates 10-18-24
Trump at Economic Club of Chicago: Thoughts on Autos 10-17-24
Retail Sales Sep 2024: Taking the Helm on PCE? 10-17-24
Industrial Production: Capacity Utilization Soft, Comparability Impaired 10-17-24
CPI Sept 2024: Warm Blooded, Not Hot 10-10-24
HY OAS Lows Memory Lane: 2024, 2007, and 1997 10-8-24