
Footnotes & Flashbacks: State of Yields 8-17-24
After some swings around econ releases, the week saw a muted net move in UST after constructive CPI and mixed economic data.


Before we serve a -50 bps cut, we need a few more ingredients…
The CPI story line was slightly better this past week (see CPI July 2024: The Fall Campaign Begins 8-14-24) even if UST bulls calling for -50 bps need rose-colored-glasses to look past the resilient consumer seen in retail sales (see CPI July 2024: The Fall Campaign Begins 8-14-24) and focus more on continued weak manufacturing data (see Industrial Production: Capacity Utilization Trends 8-15-24).
There is a lot of critical data between now and the mid-Sept FOMC meeting (Sept 17-18 with updated forecasts and dot plot), and before the FOMC we will get a range of updates including the 2nd cut of 2Q24 GDP, more housing data, and updated PCE inflation.
That critical PCE price data comes ahead of a post- Labor Day payroll release that will loom larger after the last VIX reaction and mini-panic after the July employment release (see Payroll July 2024: Ready, Set, Don’t Panic 8-2-24).
While some of the street talking heads in the media cite the Jan 2001 and Sept 2007 historical parallel of how to kick off an easing with -50 bps, we find that historical example to be dubious considering the traumatic economic and market backdrops of 2001 and the fall of 2007.
Just the protracted nature of such a steep inversion on the front end is getting a bit perverse when looking back across the cycle with headline CPI at a 2% handle in a growing economy, but a string of late cycle -25 bps cuts would fit in with the 1998 and 2019 Fed strategy.
The political sideshows continued with Trump talking 10% to 20% across the board tariffs and Harris going to the “price gouging” playbook.

The above chart revisits the historical timeline of the UST curves across the pre-crisis years and outside the periods of ZIRP, QE, and “normalization” attempt that started at the end of 2015 through the end of 2018 before the FOMC started cutting rates to bail out the Trump’s faltering economy in 2019 ahead of the return to ZIRP as COVID struck in March 2020.
The history of these curve migrations across the years reminds us how extraordinarily low interest rates are today. The current UST curve just doesn’t seem low for those who see the post-2008 yield curve backdrop as “normal.” My personal favorite is the 9% handle 3M UST in the credit cycle peak year of 1989 ahead of the underwriting cycle cracking and the string of securities firm bailouts and collapses in 1990 (see UST Moves: 1988-1989 Credit Cycle Swoon 10-20-23, UST Curve History: Credit Cycle Peaks 10-12-22, Greenspan’s First Cyclical Ride: 1987-1992 10-24-22).
That 1989 yield curve was not too far from some segments of the UST curve that the Jimmy Carter administration saw in 1978 before inflation and the economic cycles went to hell and a double dip recession unfolded from 1980 to 1982 (see UST Moves 1978-1982: The Inflation and Stagflation Years 10-18-23).
The chart also includes the recent 10-19-23 peak date when the UST just missed on the 5% line for the 10Y UST. Then came the monster UST rally and risky asset rebound of Nov-Dec 2023. As we look at where the inversion stands today vs. the other modest and brief inversions of 2000 and 2006, the financial system backdrop and asset risk profiles are much better positioned today relative to the TMT cycle and the housing bubble and game of counterparty roulette seen in the structured credit boom.

The above chart updates the UST deltas from the 10-19-23 and YTD deltas from 12-31-23. As we have been covering across the weeks, the sharp rise in the UST curve across the YTD period earlier in the year has now given way to a bull steepening with the short end now adding to the deltas from 1Y to 5Y while the 10Y is essentially flat to the start of the year and 30Y modestly higher.
The expectation for a bull steepening led by the front end is more intuitive on likely FOMC action than expecting the sub-4% 10Y UST to follow the easing without some form of very ugly recession or global conflagration to take the 10Y UST meaningfully lower. The supply-demand aspects of clearing the market for new UST supply tends to get downplayed by triple jointed quants and economists married to their models, but record deficits, record interest costs, tariff threats, trade war risks (you think China will be UST demand friendly if you attack their economy on such a scale?) present some tricky risk variables.
The weak dollar advocacy by Trump /Vance that might call into question import price trends and the worries of non-dollar investors not looking to get slammed by a weak dollar. The obvious question is “Would China retaliate by dumping holdings or opting for a buyer’s strike?” That is not a new discussion at all on China holdings, but Taiwan issues could complicate that answer this time.
How the global currency evolution will unfold is a topic for us all to get better schooled on with the China-led central bank digital currency rolling along and being embraced by numerous commodity sellers and buyers. Part of the impulse is to avoid complications in USD as the denomination that has dominated for decades. Some have pointed at this trend as a way for nations to mitigate sanctions risk and bank actions that can be taken as seen with Russia (SWIFT mechanism etc.)
It has always been easy to read the headlines and move on past dollar displacement risk, but the risks and the scenarios will get harder to ignore. That would flow into UST demand as the risk-free asset of choice. Constant threats of default by the Congressional extremists are not exactly a UST demand aphrodisiac (Jan 2025 debt ceiling beckons). That currency twist is just one more thing on the list to get smarter on after the elections (if the results are in fact accepted by whoever loses). Over the decades, the only crowd more zealous (battier?) than gold bugs are the “dollar collapse” bears.

The above chart updates the UST curve migration visual. We include the memory jogger on the dates and size of the FOMC actions. At the risk of being a broken record, we always point at the convergence of the 10Y UST area between 12-31-22 and 12-31-23 despite the 100 bps differential in fed funds. In theory, that reminds us that the 10Y UST does not necessarily need to move lower as the dust settles on the direction of tariffs, the economic cycle, oil prices, etc. As we noted in the prior chart, the borrowing needs are not small. More downgrades of UST debt are also not out of the question.

The above chart updates the 1-week move in UST deltas. The retail sales day saw some double-digit intraday swings. As we discuss in the separate Footnotes publication on asset returns, the bond ETFs had another week of positive returns even if those returns reside in the bottom quartile in the face of a great week for equity returns

The above chart updates the YTD moves after much of the year showed the UST higher. We added a YTD timeline in the separate asset return commentary to capture a broader mix of time horizon returns (1-week, 1-month, 3-month, YTD, and 1-year). The YTD numbers still have the long duration UST 20+ Year ETF (TLT) in second-to-last place against a peer group of 32 asset lines that include only 1 in the red (Transports ETF, ticker XTN). In other words, 2024 has still been a bad year for duration but with a “lot of year” and FOMC decisions left on the game clock.

The above chart updates the running UST deltas from the 10-19-23 peak date on the 10Y UST. That has been a great run for duration with pockets of volatility along the way. During the time frame, the long duration UST (TLT) generated a total return of just under 22% since the UST peak in Oct 2023. That TLT return is just short of the Equal Weight S&P 500 ETF (RSP) which weighed in at just under 25% for the same time horizon. The short duration UST 1Y-3Y ETF (SHY) returned around +5.4%.
Those comparative returns offer another reminder of why people diversify and why risk-adjusted returns are also about investment time horizons. The YTD 2024 returns in TLT have been very weak. If we go back to the March 2022 period when ZIRP ended and the tightening cycle began, TLT returned worse than -25% with SHY just under +4%. This has been an unforgiving tightening cycle. That is just the reality of bond math.

The above mortgage rates have shown marked improvement from the high 7% area on the Freddie benchmark as we covered along the way. The 6.49% Freddie Mac benchmark is a slight uptick from 6.47% last week.
We frame the most recent Freddie 30Y against the rate in place at the end of the peak homebuilding year of 2005 and mid-2006 when the RMBS anxiety was setting in on subprime. We also plot the UST curve for each date. The current market has the lowest 10Y UST but is in the middle on mortgage rates.
The ability to move the needle on monthly payments for housing affordability will remain a major challenge in terms of breaking the logjam on existing home sales, whether for freeing up home equity cash proceeds or for move up transactions.
The mortgage rate question marks will continue to be a major part of the UST shapeshifting handicapping around how the longer end of the curve will react to the FOMC lowering the outsized inversion from the front end that has been breaking records for its “length of stay.”
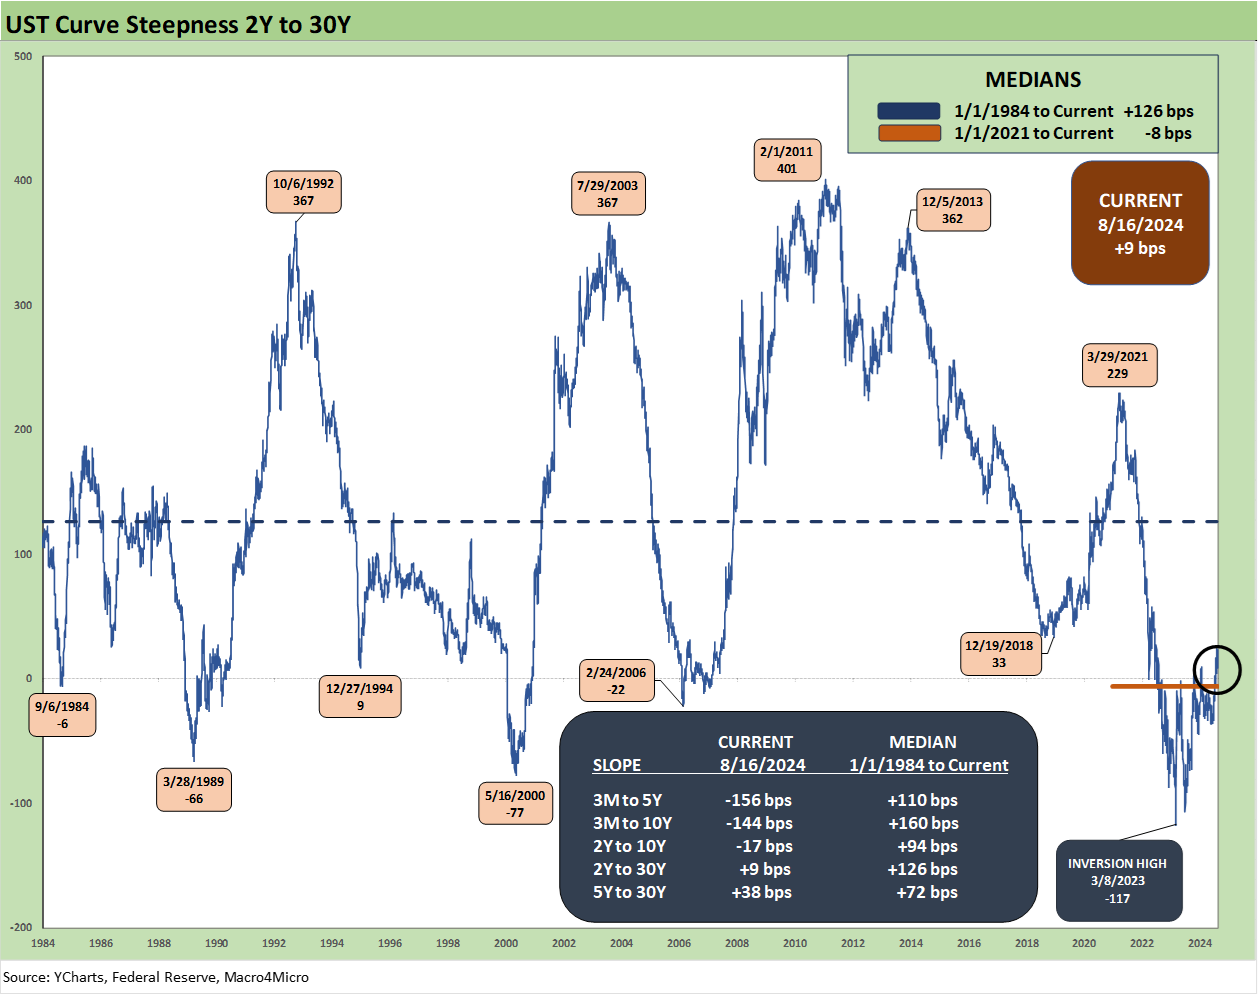
The above chart updates the long term slope for the 2Y to 30Y from 1984. We see a median of +126 bps vs. the current upward slope of +9 bps. The box also details the other UST segment slopes we track and posts the current slopes and long-term medians for each. In theory, the 2Y could decline -100 bps without the 10Y moving and still be short of the median.
There is a lot of room for debate as to how these slopes could frame up when you start to ponder the checklist of structural differences in this market that we have looked at in past commentaries. Just the scale of the deficits and funding needs and absolute rate levels of the curve created a lot of “to and fro” questions. These may lack answers given how many tectonic policy shifts could unfold, and the speculation checklist is a long one. In some cases, history offers little to guide the assumptions. We expect a bull steepener but have a very hard time getting comfortable that the 10Y can stay low with so much chaos and so many policy threats out of Washington.

The above chart just shortens the timeline from the start of 2021 to capture the full ride. We see a peak -117 bps inversion In March 2023 (revisited -107 bps in July 2023) after a plunge from the peak upward slope of +229 bps in March 2021. The market saw inflation coming but the FOMC sat on its hands.
Based on the liability management demands, it is also clear that a lot of opportunities to lock in low coupons were not taken by the UST. That has been true of every administration since 2008. The easy money on the front end promoted imprudent decisions on terming out.
The GOP used to complain about it under Obama until the Trump team did likewise and team Biden followed suit. Trump also blew the deficit into the stratosphere after Obama (see US Debt % GDP: Raiders of the Lost Treasury 5-29-23). Parties do not put their hands up in the air unless they are pointing at the other guy. The typical location of their thumb is a separate topic.

We wrap with the running UST migration charts and UST deltas from the end of ZIRP in March 2022. We use March 1, 2022 as the start date (ZIRP ended again effective as of 3-17-22). That is a world class bear inversion with 3M over +500 bps higher, the 2Y +275 bps, and the 10Y UST +217 bps higher.
See also:
Footnotes & Flashbacks: Asset Returns 8-17-24
Housing Starts July 2024: The Working Capital “Prevent Defense” 8-16-24
Retail Sales: Third Wind? 8-15-24
Industrial Production: Capacity Utilization Trends 8-15-24
Total Return Quilt: Annual Lookback to 2008 8-14-24
CPI July 2024: The Fall Campaign Begins 8-14-24
Footnotes & Flashbacks: Credit Markets 8-12-24
Footnotes & Flashbacks: State of Yields 8-11-24
Footnotes & Flashbacks: Asset Returns 8-11-24
HY Industry Mix: Damage Report 8-7-24
Volatility and the VIX Vapors: A Lookback from 1997 8-6-24
Footnotes & Flashbacks: Credit Markets 8-5-24
Footnotes & Flashbacks: State of Yields 8-4-24
Footnotes & Flashbacks: Asset Returns 8-4-24
HY Pain: A 2018 Lookback to Ponder 8-3-24
Payroll July 2024: Ready, Set, Don’t Panic 8-2-24
Employment Cost Index: June 2024 8-1-24
JOLTS June 2024: Countdown to FOMC, Ticking Clock to Mass Deportation 7-30-24
Footnotes & Flashbacks: Credit Markets 7-29-24
Presidential GDP Dance Off: Clinton vs. Trump 7-27-24
Presidential GDP Dance Off: Reagan vs. Trump 7-27-24
2Q24 GDP: Into the Investment Weeds 7-25-24
GDP 2Q24: Banking a Strong Quarter for Election Season 7-25-24