
Footnotes & Flashbacks: Credit Markets 8-5-24
HY credit pricing was whipsawed as a soft payroll number and a few other macro releases set off a chain reaction of position nerves.


Maybe we should ease? Bring my FOMC sheet music…
The pattern of HY benchmarks bouncing off cyclical spread lows (or near lows) into a severe OAS widening is hardly new given the history after late June 2014 (late summer oil crash), early Oct 2018 (4Q18 HY OAS crash), and February 2020 (March COVID). Only Oct 2018 offers a good parallel in terms of a lack of very clear fundamental triggers. We went down memory lane on that late 2018 period for some ideas (see HY Pain: A 2018 Lookback to Ponder 8-3-24).
The tendency of HY to highly correlate with nasty equity sell-offs is common, but the good news here is that the beatdowns in tech are more about the mega-names and excessive multiples and not debt-fueled capex expansion with weak earnings and negative cash flow. The TMT crash after the early 2000 peak was part excessive valuation of TMT names but also debt-driven telecom and media expansion. Today is more about tech equity valuation not corporate debt.
The +62 bps widening on the week in US HY from +310 bps took excess returns down hard from a running YTD excess return of +264 bps (total return +437 bps) to an excess return of +86 bps and total return of +424 bps in a reminder of how the UST can ease your corporate bond total return pain at a time like this.
IG bonds had a milder move but the +11 bps OAS widening to +106 bps translates into excess return pain (by IG index standards) with YTD excess returns down to +42 bps YTD to end last week from +127 bps YTD the prior week.
As we publish this report, the market saw Japan have its version of our Friday sell-off, but it was just that much worse. Theories on why it is worse in Japan (carry trades, etc.) is not our topic, but the US markets are warming up for more pain at open with Europe looking at 3+% area sell-offs as we go to print. The Mag 7 is also set up for another beatdown today. As we go to print, futures show the Dow is down over 1100 and NASDAQ is down by just under 1000. The 10Y UST is 3.7%. Wild times are back.
Credit market returns see credit pain and UST gain…
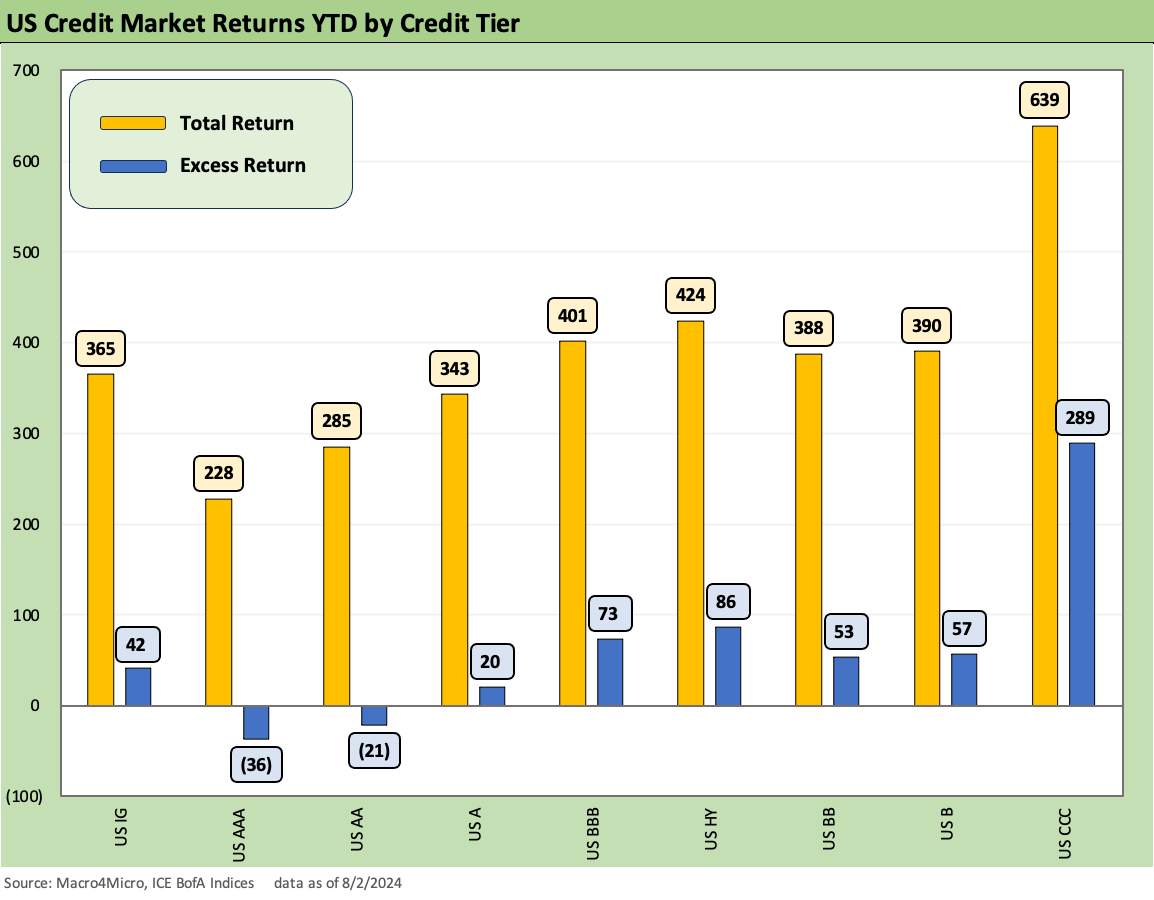
The above chart details the YTD total returns and excess returns across the credit tiers as HY is still winning vs IG on spread compression (for now…on a YTD basis) and higher coupons plus the new return contributions of the UST. The YTD UST deltas are finally positive again as covered in our Footnotes publication on yields (see Footnotes & Flashbacks: State of Yields 8-4-24).
The UST delta chart told a story of the UST curve finally helping in 2024 and duration winning but credit returns hitting an air pocket and seeing some setbacks. At least the BBB to CCC credit tiers are posting positive excess returns even if they just took a haircut.
The scale of the negative reaction strikes us as excessive as a few macro indicators unleashed the growing anxiety around valuations and calling out the Fed by “pushing the sell button.” Sharp selloffs tend to have reverberating effects that need to play out whether tied to more leveraged investors or defensive selling. The names are different, but the reactivity is not. On a side note, try to envision a China and EU trade war, a weak dollar policy, an exit from NATO, and turning Ukraine into more of a killing field than we see now. That is for another day.
The level of compression to date across gross spreads and quality spread differentials were not reflecting the bigger mix of risks that lie ahead after the election on extreme levels of policy uncertainty. In the case of tariffs and mass deportation, there is an element of “damage certainty” in one candidate but less certainty in the other depending on what tax programs can get through the House. Tax reform is easier to campaign on since they are highly dependent on winning the House and fielding a majority approval bill in the Senate. The tariffs and deportation are less likely to seek Congressional support at all. There is a choice in there with different execution risks.
On the theory that risky asset markets are forward looking, we would argue that is not the case of late in HY credit, so the sell-off is still at compressed spreads ahead of the activity that will unfold to start this week.
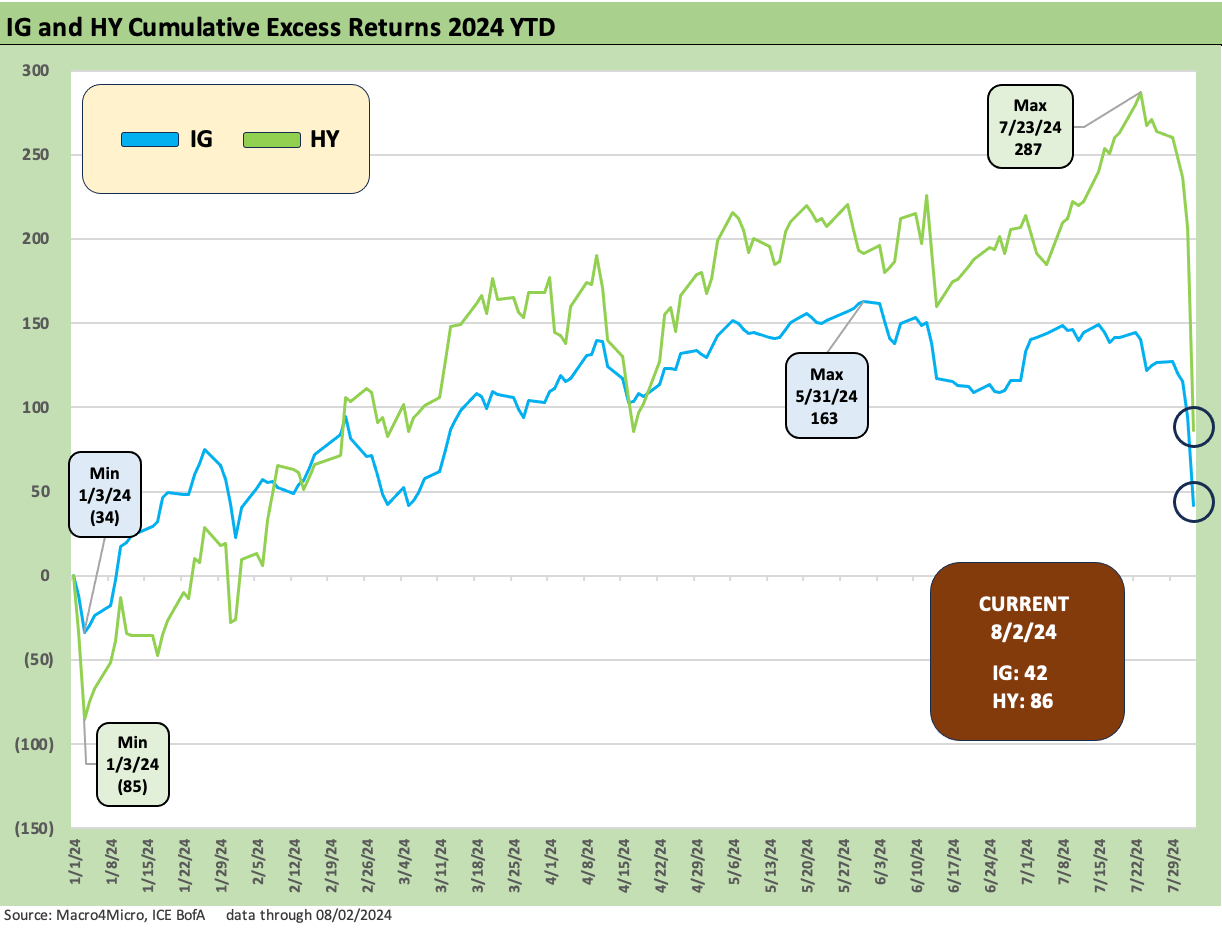
The above chart updates the running YTD excess returns for IG vs. HY through Friday as the peak credit returns through late July gave way to a dramatic plunge last week. We note the running highs for each HY and IG with the dates and returns noted.
The action has now shifted to the UST return contribution in total return with credit pricing getting squeezed in the face of cyclical uncertainty and what the Fed is (or is not) going to do about it.
The Fed is taking a lot of heat right now with talking heads on CNBC theorizing on “emergency cuts” with some very smart, name brand Wharton Professor types. The political overtones cut both ways, so the FOMC will need to be careful on the “when” and the “how much” and the language of the moves. That is a needle to thread in a market full of rope (not the noose in front of the Capitol…that has been spoken for).
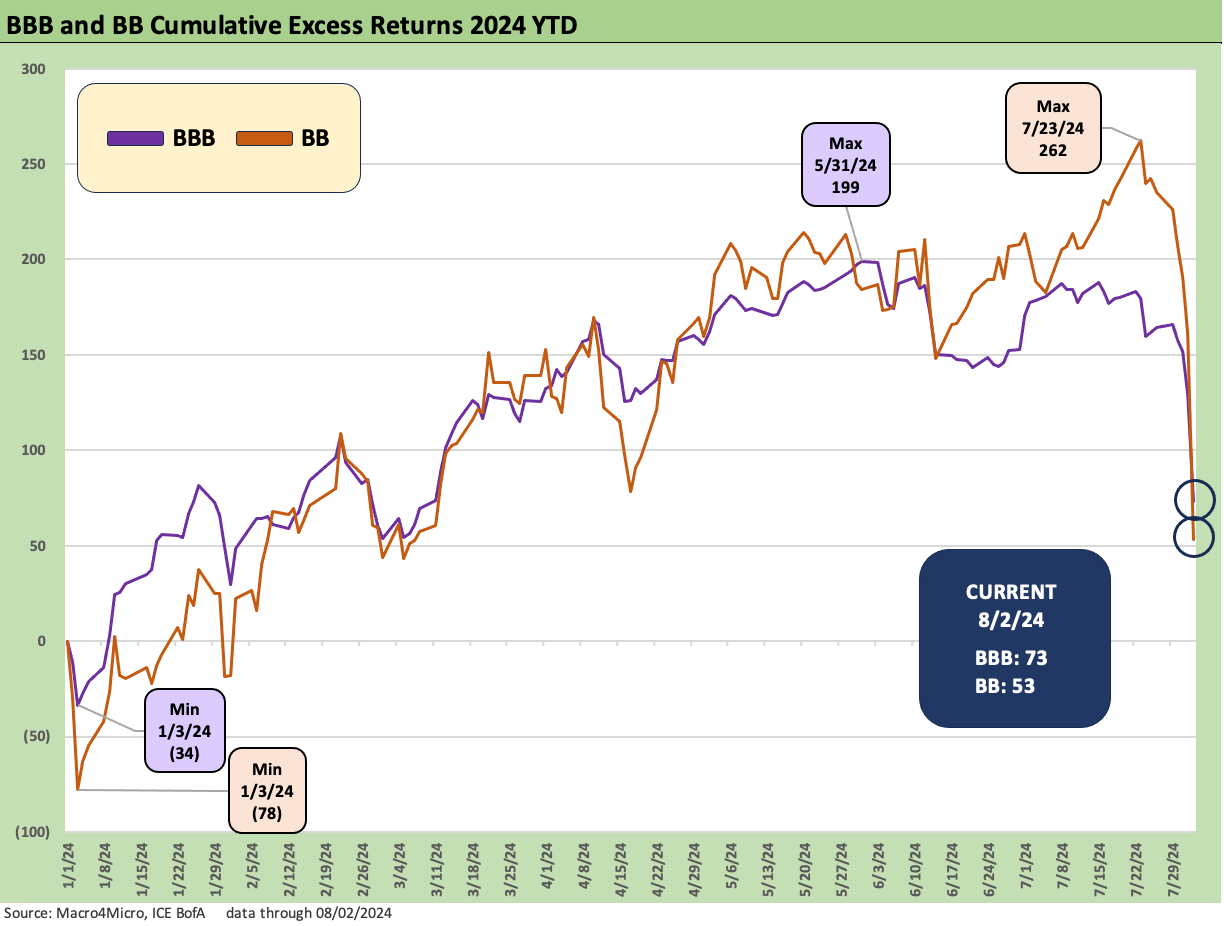
The running excess returns for the BBB vs. the BB tier just took a material hit as the BB tier OAS gapped wider by +58 bps over the past week while the BBB tier moved by +13 bps on the week. Within IG, the BBB tier has outperformed the A tier by a healthy amount (as it should with higher risk), but the BB tier just did a big fade and is now underperforming the BBB tier.
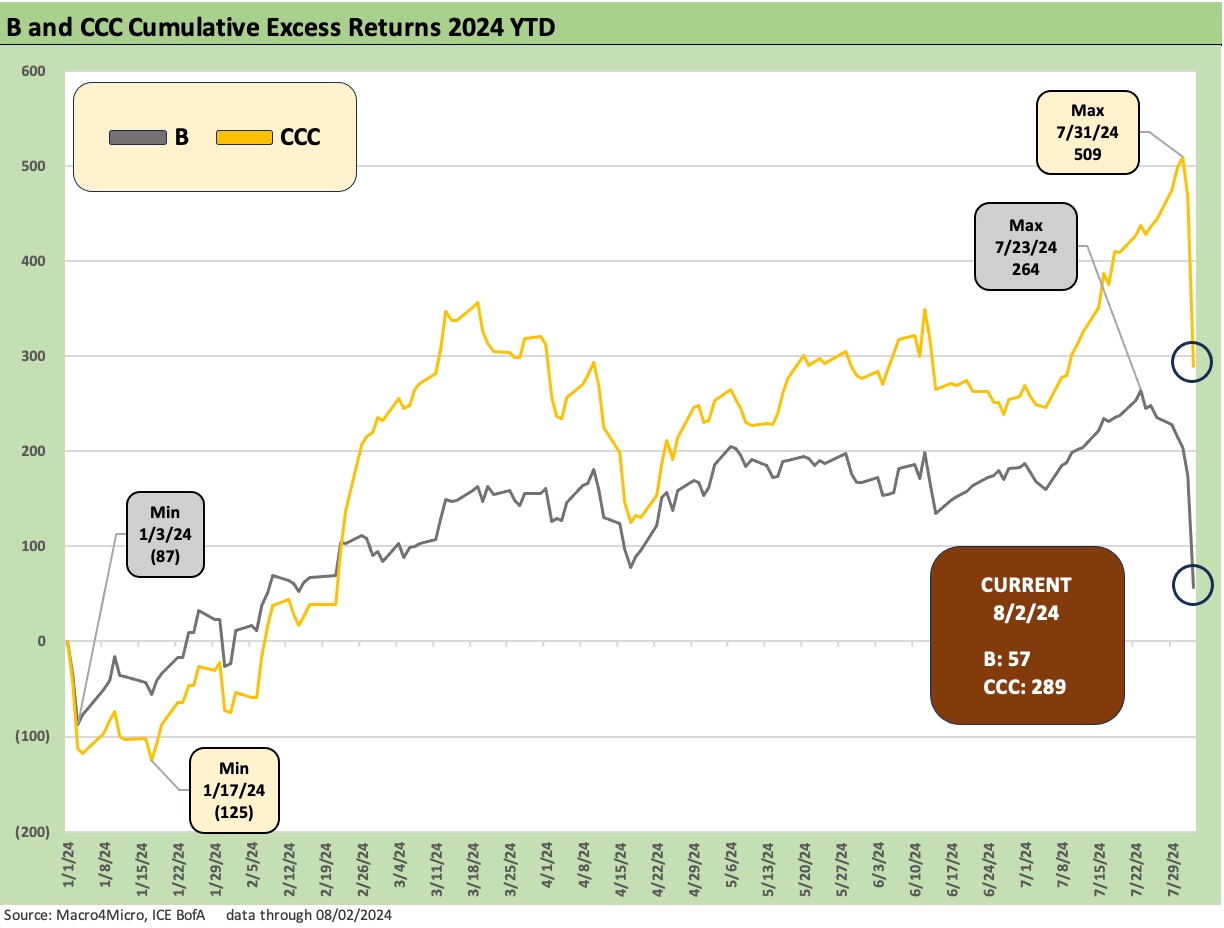
As we covered in recent commentaries (including The B vs. CCC Battle: Tough Neighborhood, Rough Players 7-7-24), the CCC tier is more about issuer picking (and disaster avoidance) than credit tier weighting, but the CCC tier has been outperforming the B tier by a material amount YTD. That continues with the effects of the recent selloffs. The B tier widened by +64 bps last week and the CCC tier by +81 bps. We look at quality spread differentials further below.
Digging into some spread trends…
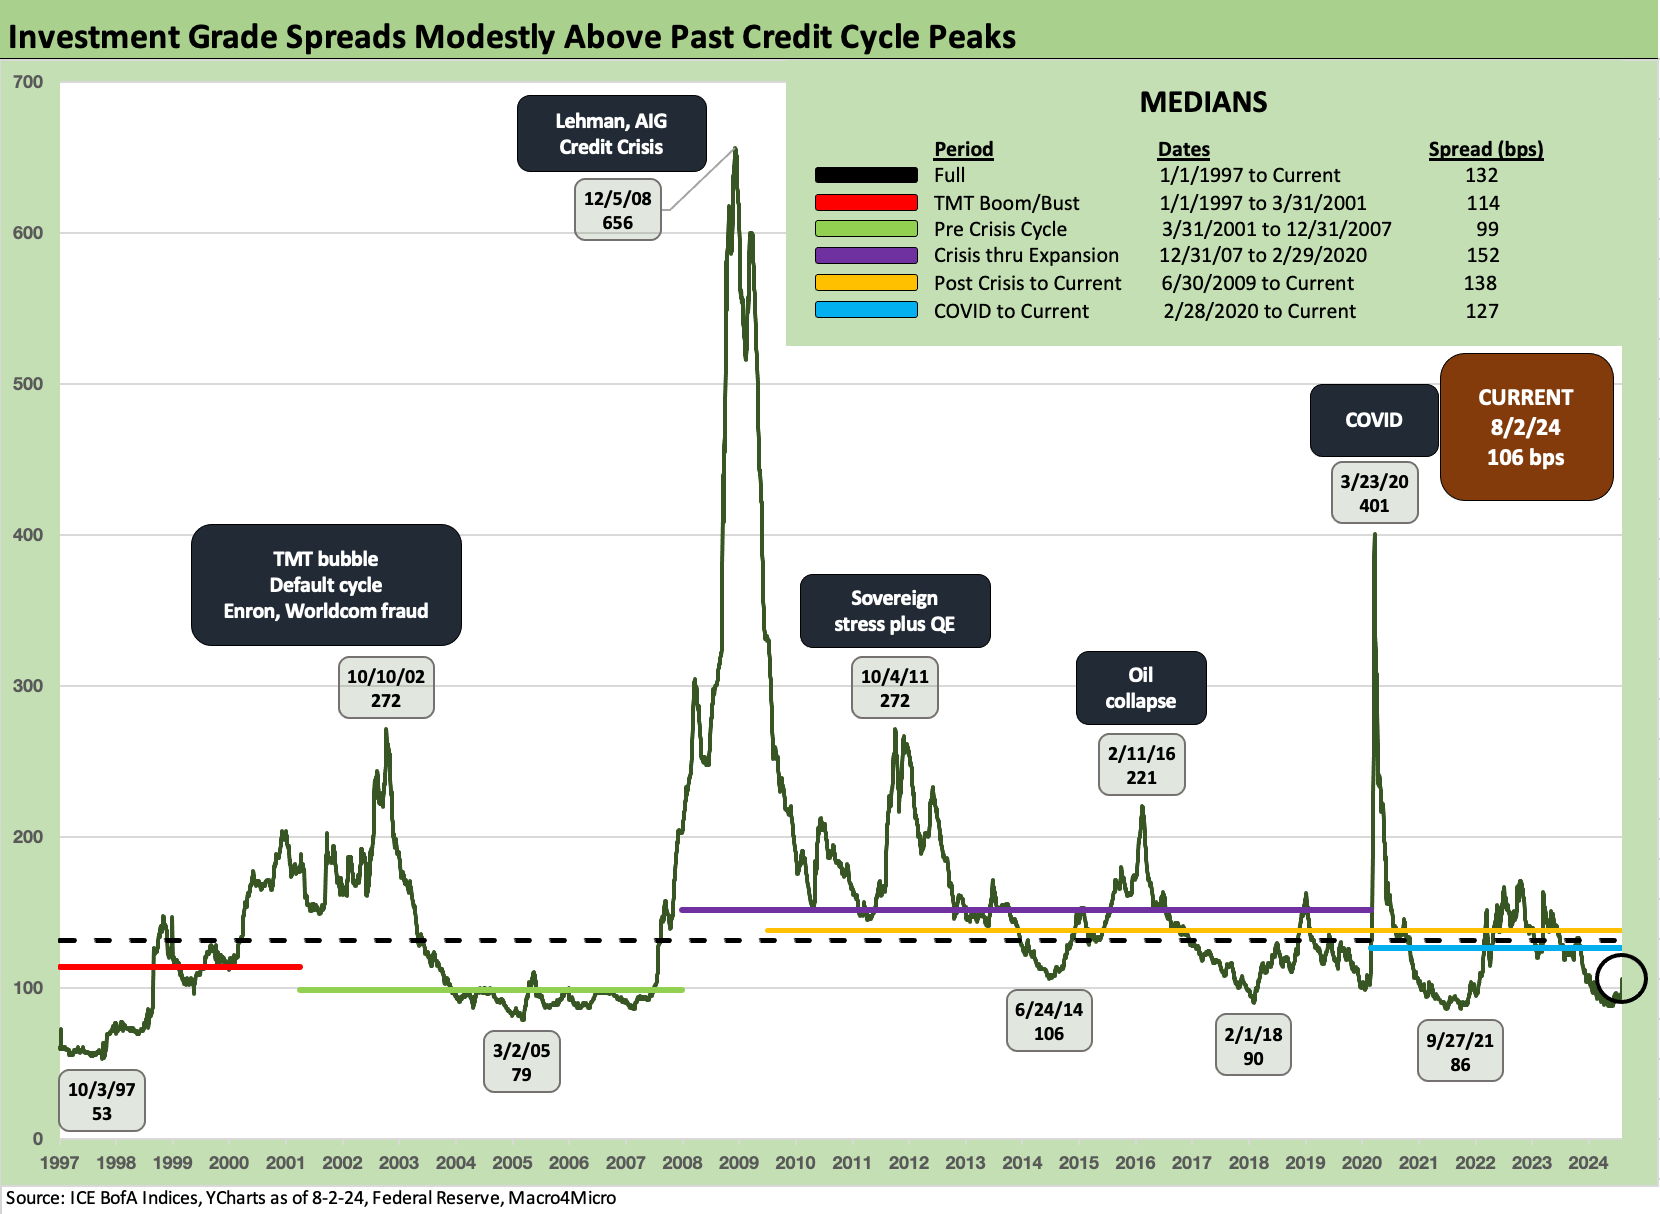
IG spreads moved +11 bps wider on the week from +95 bps to +106 bps which takes IG OAS wider from the recent lows and above the timeline lows noted on the chart above. Current levels are still tight to the long-term median of +132 bps and all the subset medians noted in the chart.
The quality spreads widening from the AA to BBB tier did not send flags up with the A tier up by +10 bps and the BBB tier by +13 bps. YTD BBB excess returns are still well ahead of the single A Tier at +73 bps to +20 bps for the single A tier.
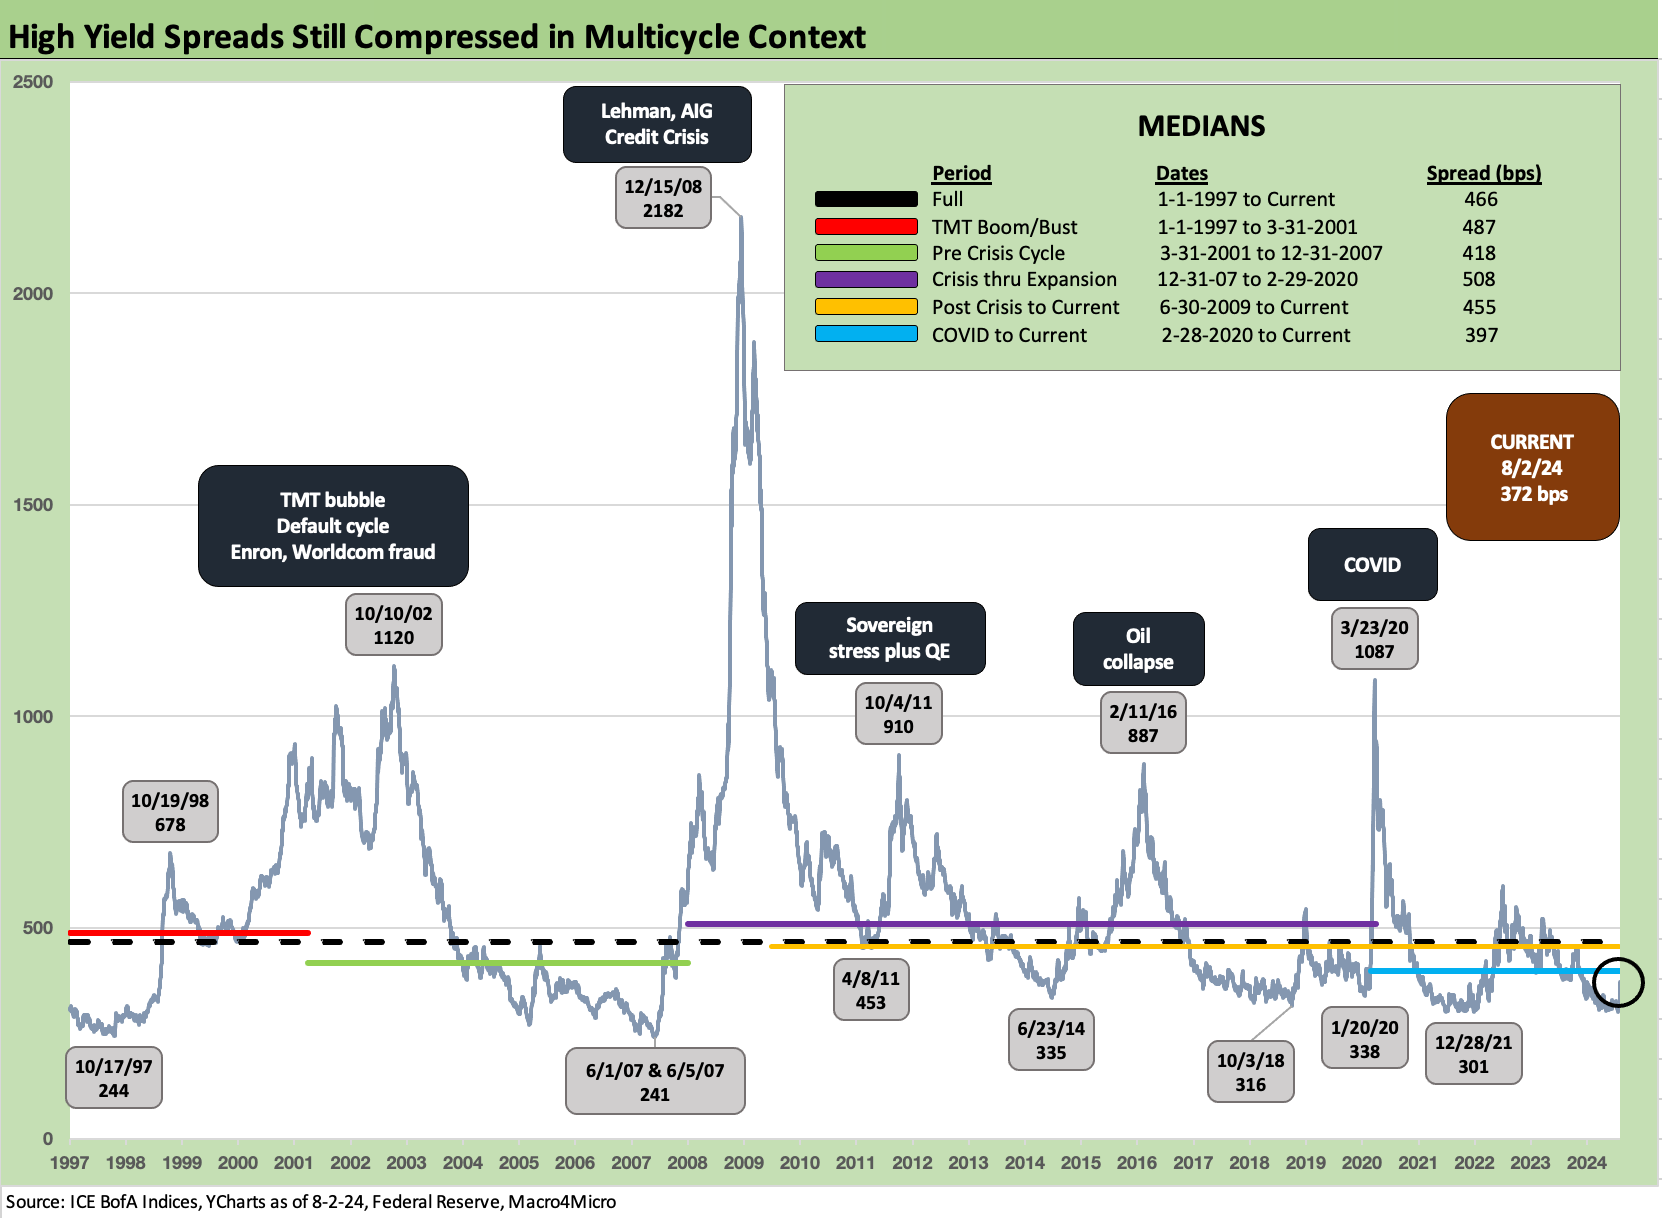
HY OAS trends took a beating last week with a +62 bps widening to +372 bps from +310 bps. As noted in the OAS lows in the time series above, that +310 bps last week was close to the Dec 2021 low of +301 bps and inside the +316 bps low of early Oct 2018. We looked at the prior 2018 period in a comment this weekend as a useful historical lookback in what can go wrong when a late cycle case of nerves breaks out (see HY Pain: A 2018 Lookback to Ponder 8-3-24).
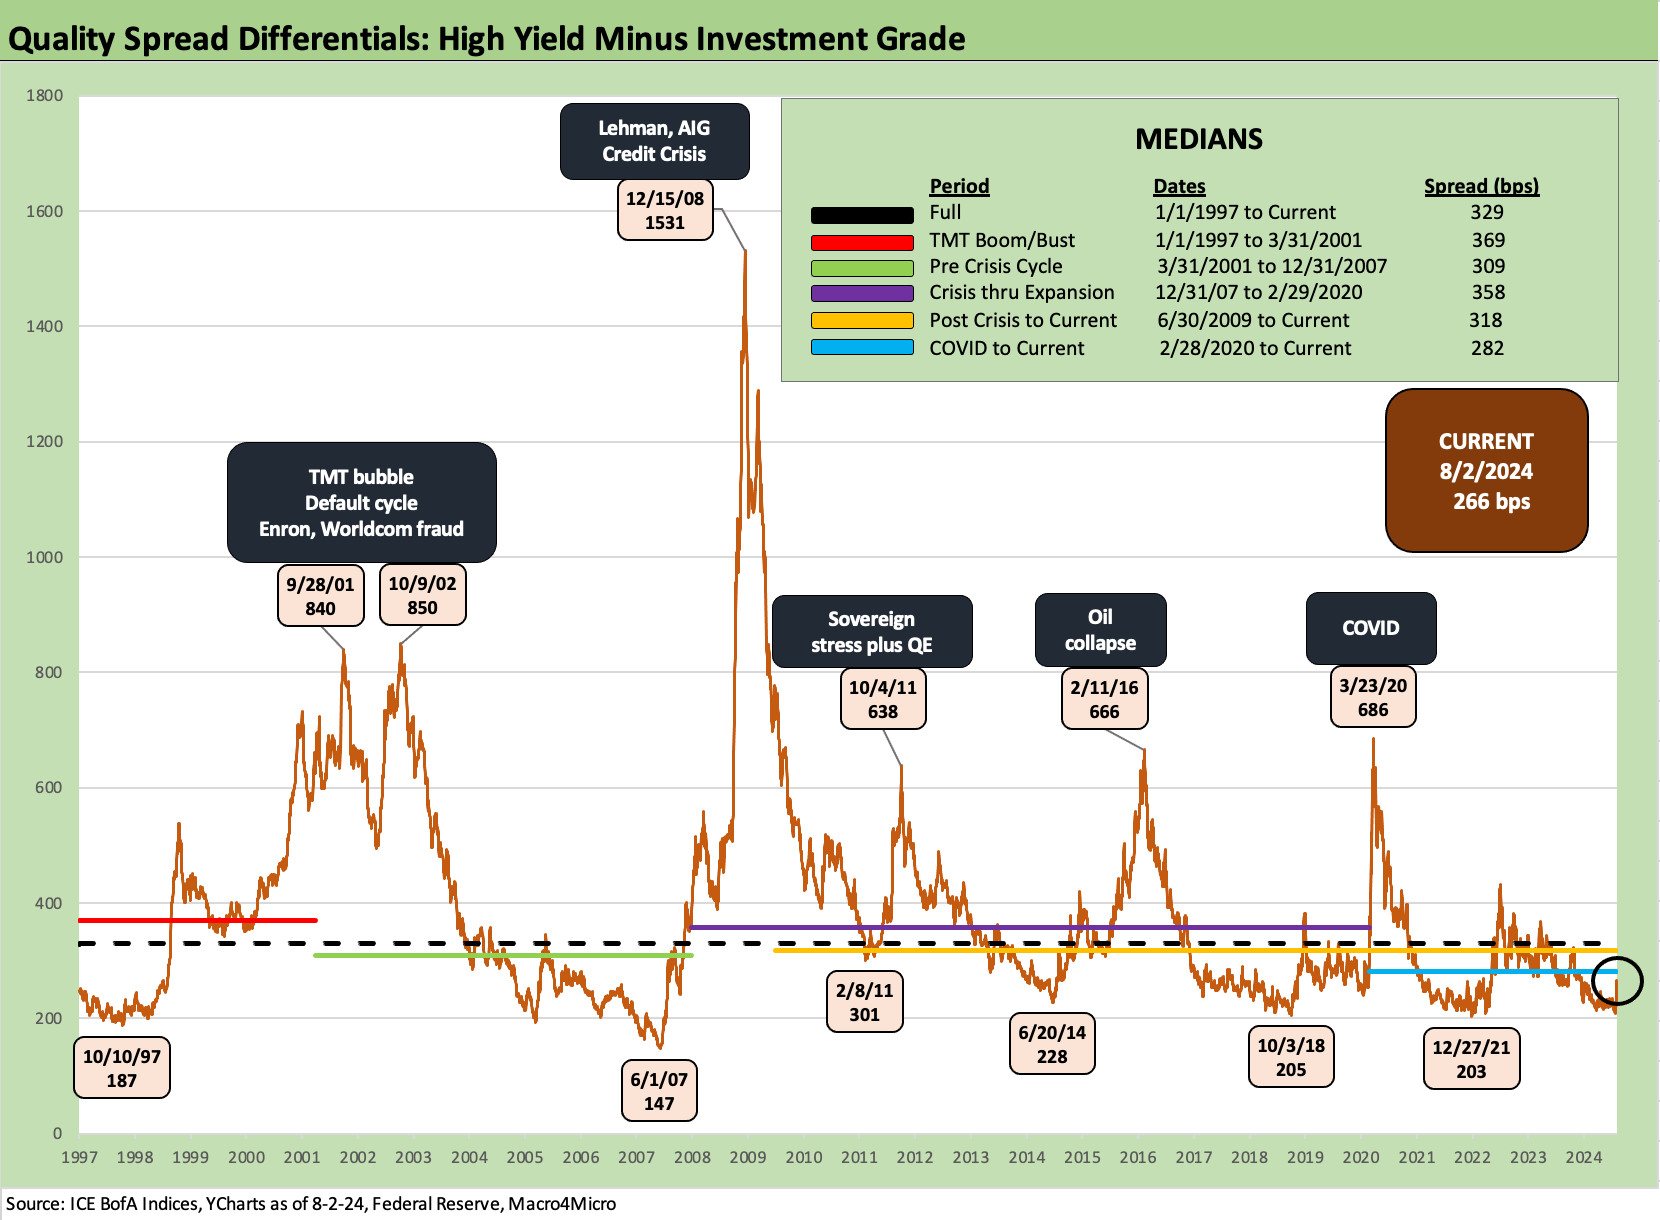
The HY minus IG quality spread differentials widened last week by +51 bps from +215 bps to +266 bps this week as the decompression wave naturally hit the HY market harder. That quality spread widening pattern is consistent with late credit cycle decompression waves of the past.
The +266 bps is still well inside the long-term median of +329 bps. The narrowest timeline median for this differential as broken out in the chart from prior cycles was +309 bps in the period from 2001 to 2007. That was a market with 1% fed funds on the way into 2004 and a structured credit binge underway. The current post-COVID cycle has shown the narrowest median at +282 bps as of the end of this past week.
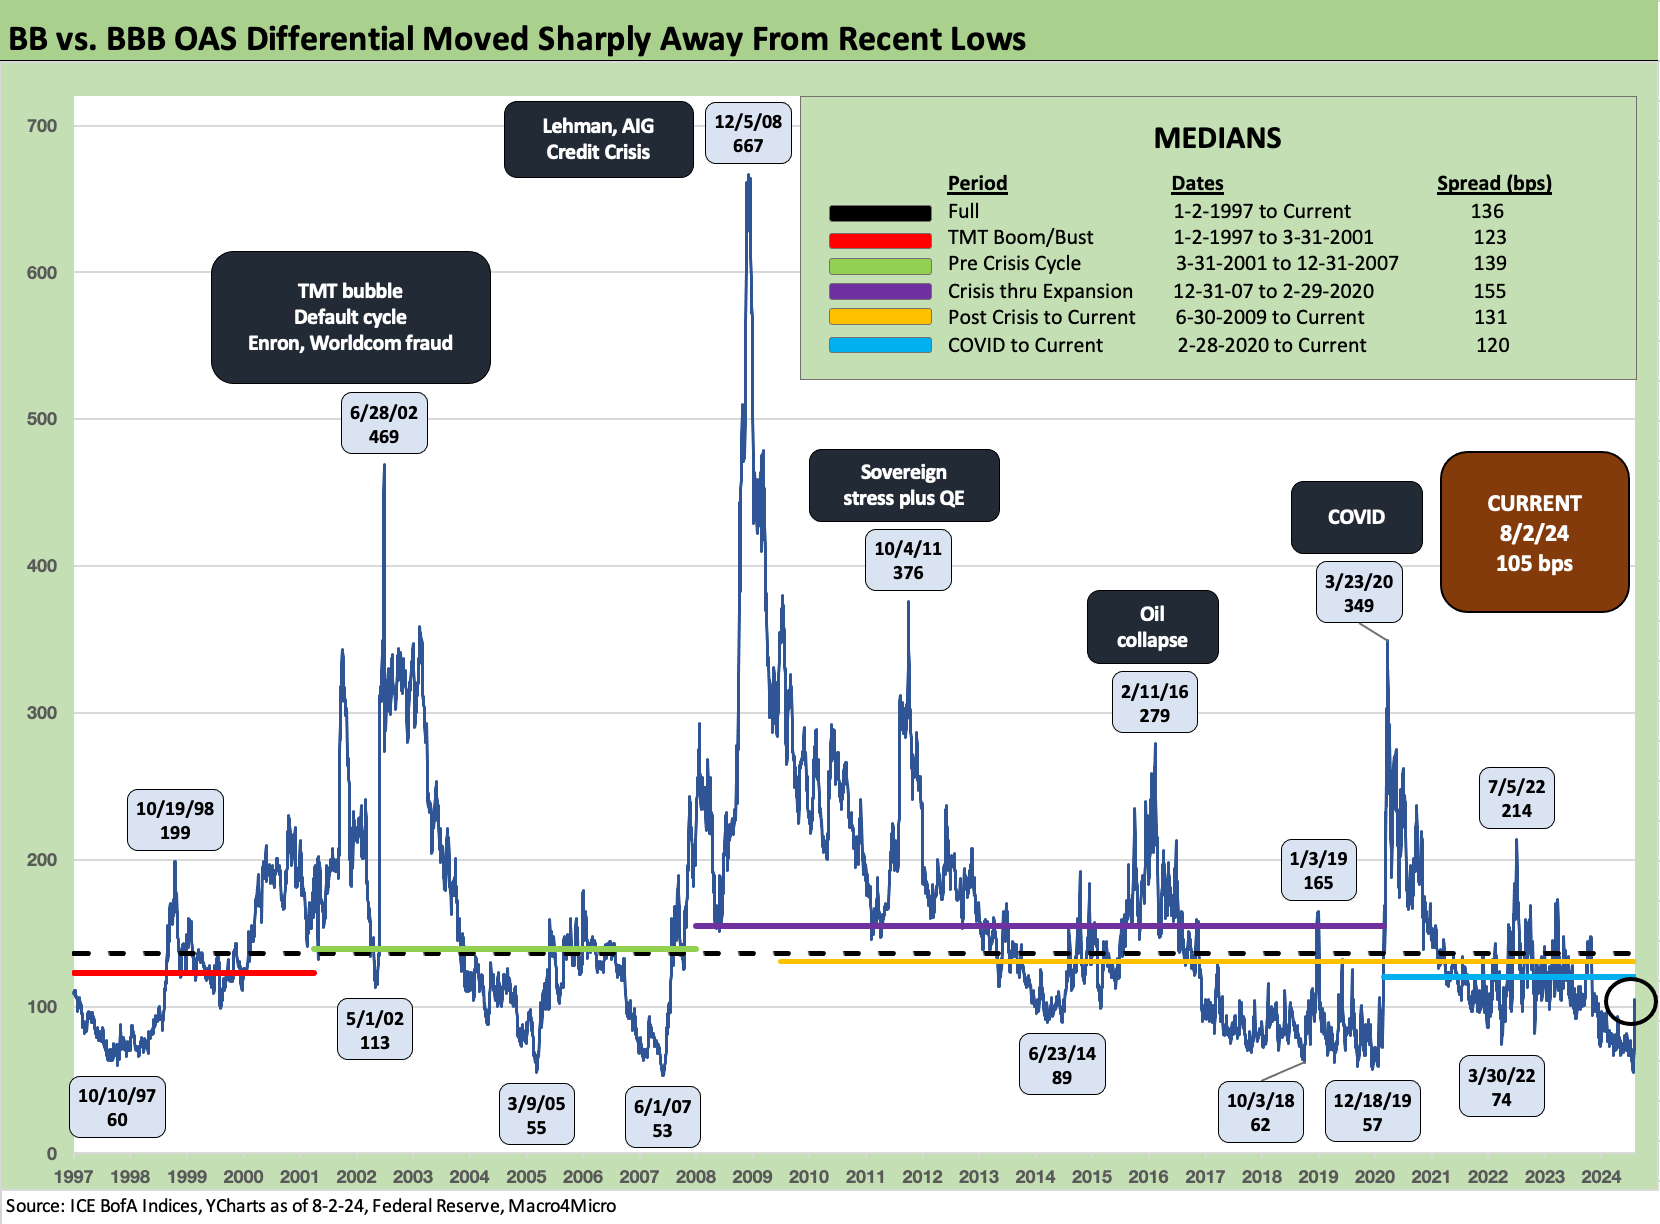
The “BB minus BBB OAS” differential has moved sharply wider from the multicycle lows the prior week that had touched down to +60 bps. The widening of the BB tier by +58 bps vs. the BBB tier widening of +13 bps takes the differential from +60 bps to +105 bps. That level is still below all the timeline medians noted above.
If we do have a recession unfolding (that would take a PCE and fixed investment swoon we don’t see), then that +105 would have a balancing act with BB widening but also BBB tier OAS pressure as the falling angel name picking starts anew with a lot of long-dated BBB paper to fear in repricing risk. (Just look at the supply of long Boeing paper and potentially renewed auto cycle pressure in that scenario.) We are not calling for that outcome, but some will see that as a rising risk and trade accordingly.
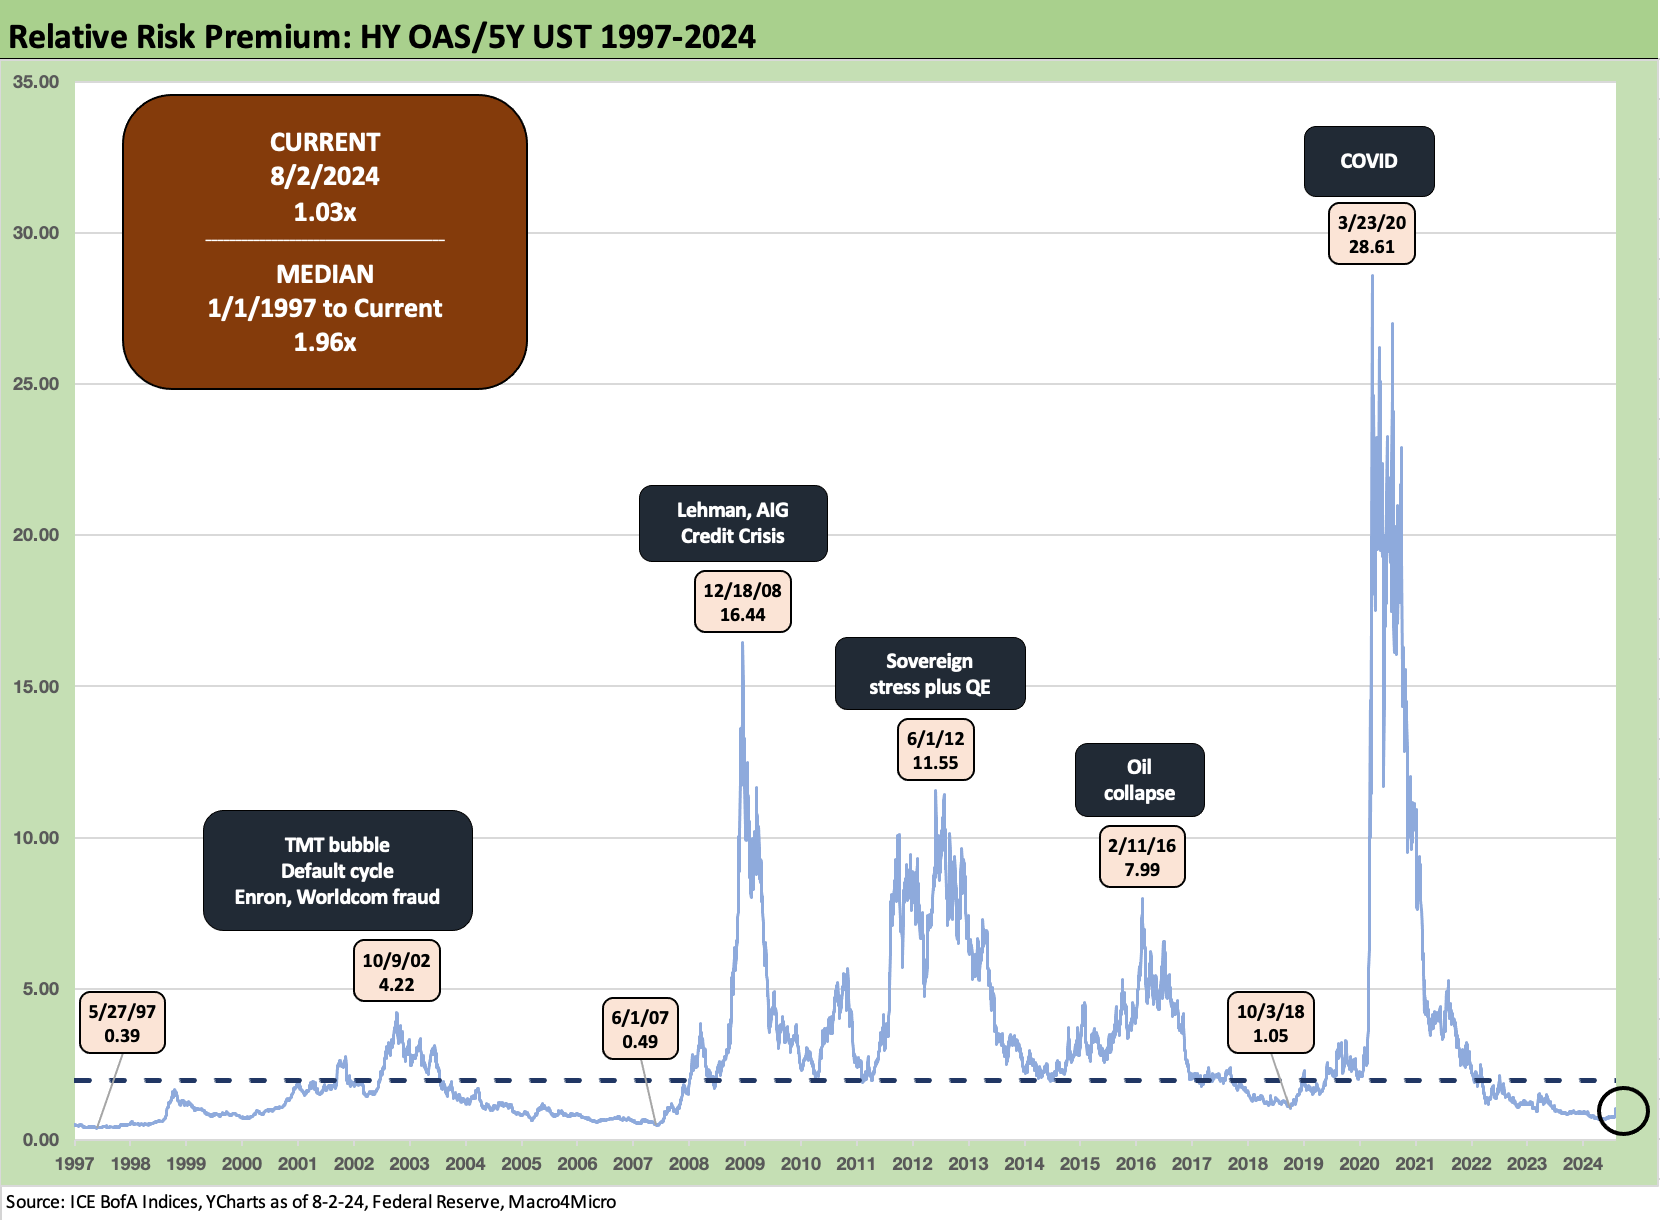
The above chart updates a metric we use for some historical context on incremental risk compensation relative to the risk-free asset (then again, hold that risk-free thought at debt ceiling time).
We use HY OAS/5Y UST Yield to frame the relationship. That just offers one more angle on what an investor gets paid to take credit risk in HY. The sell-off still leaves the ratio at 1.03x vs. a long-term median of 1.96x. In other words, this relative compensation remains extremely compressed even after the risk pricing battering of the past week.
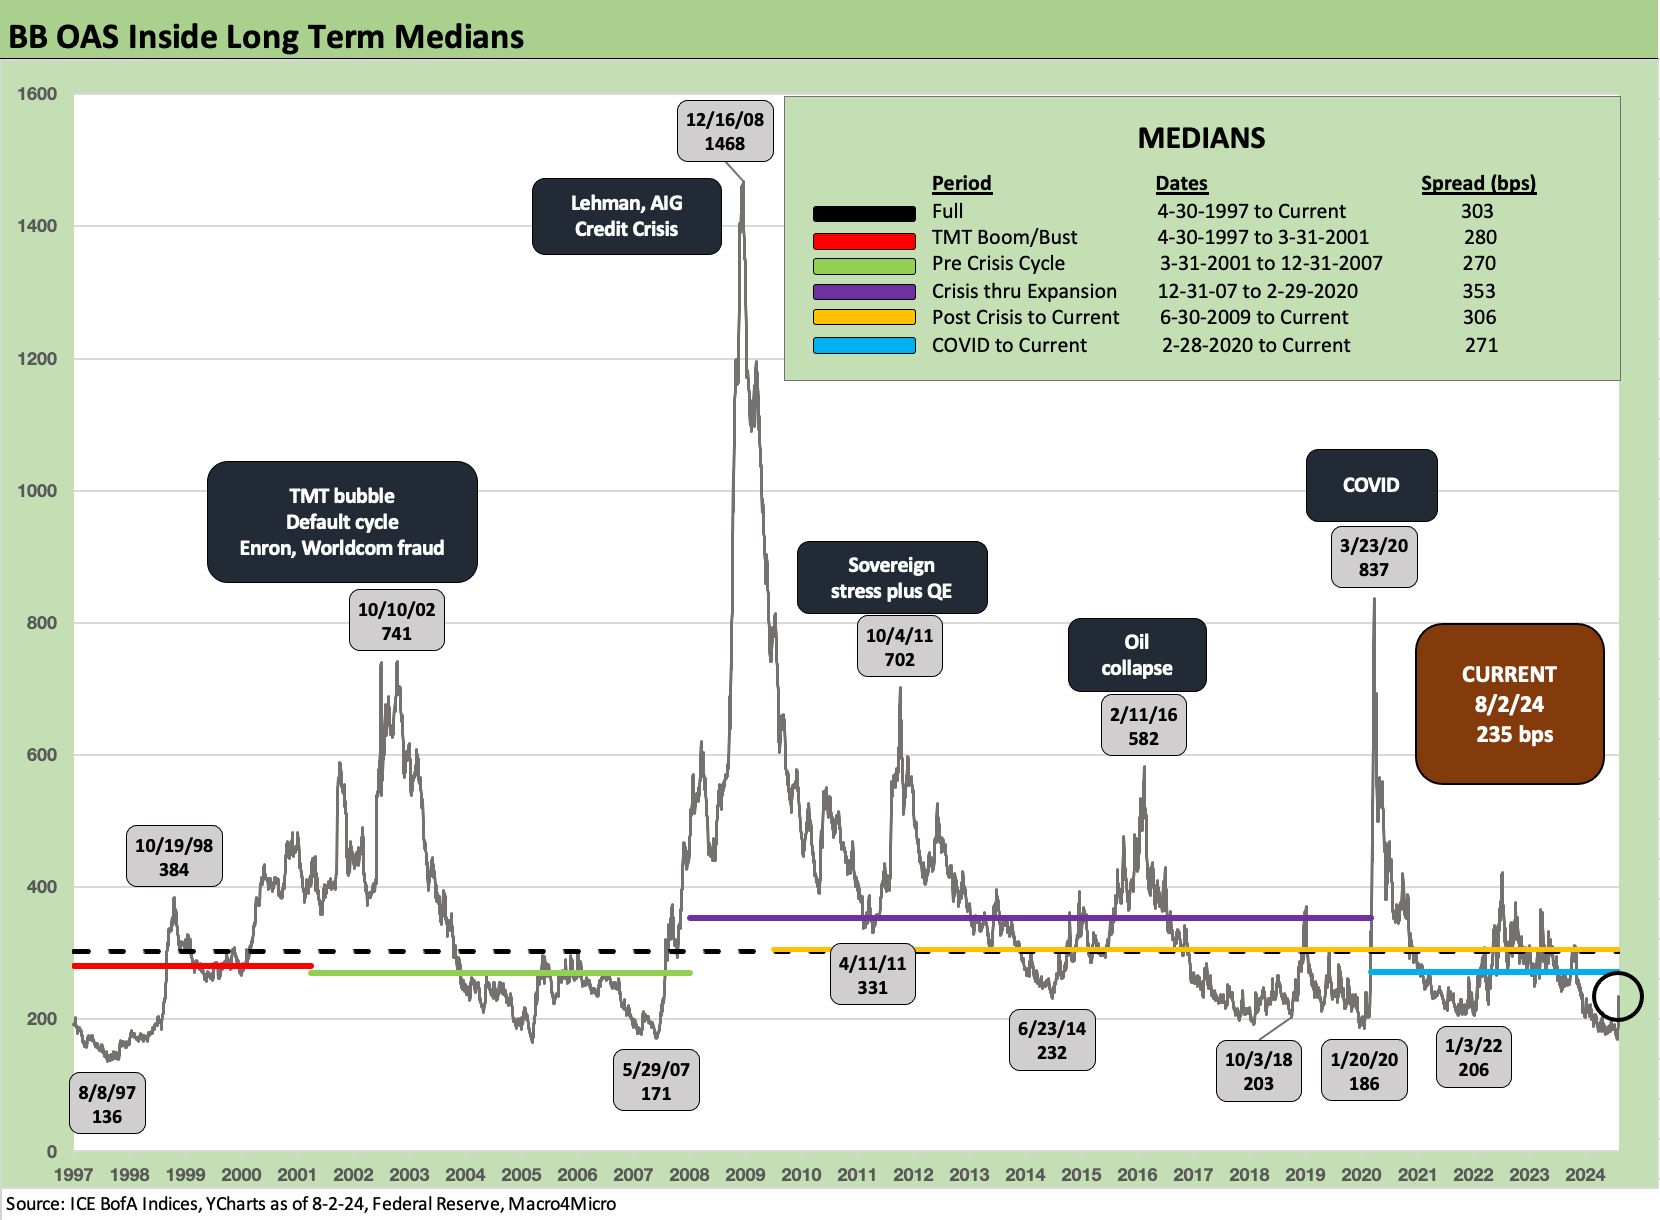
BB OAS moved +58 bps wider to +235 bps after being down at a pricey +177 bps the prior week. That was a major move, but the +235 is still comfortably inside the long-term median of +303 bps and all the subset medians detailed in the box within the chart.
Last week was very close to the late May 2007 level of +171 bps. As we know from history, the middle of June 2007 was the credit bubble peak and a few days after that +171 bps low as the HY index hit cyclical lows at +241 bps (see earlier chart on HY).
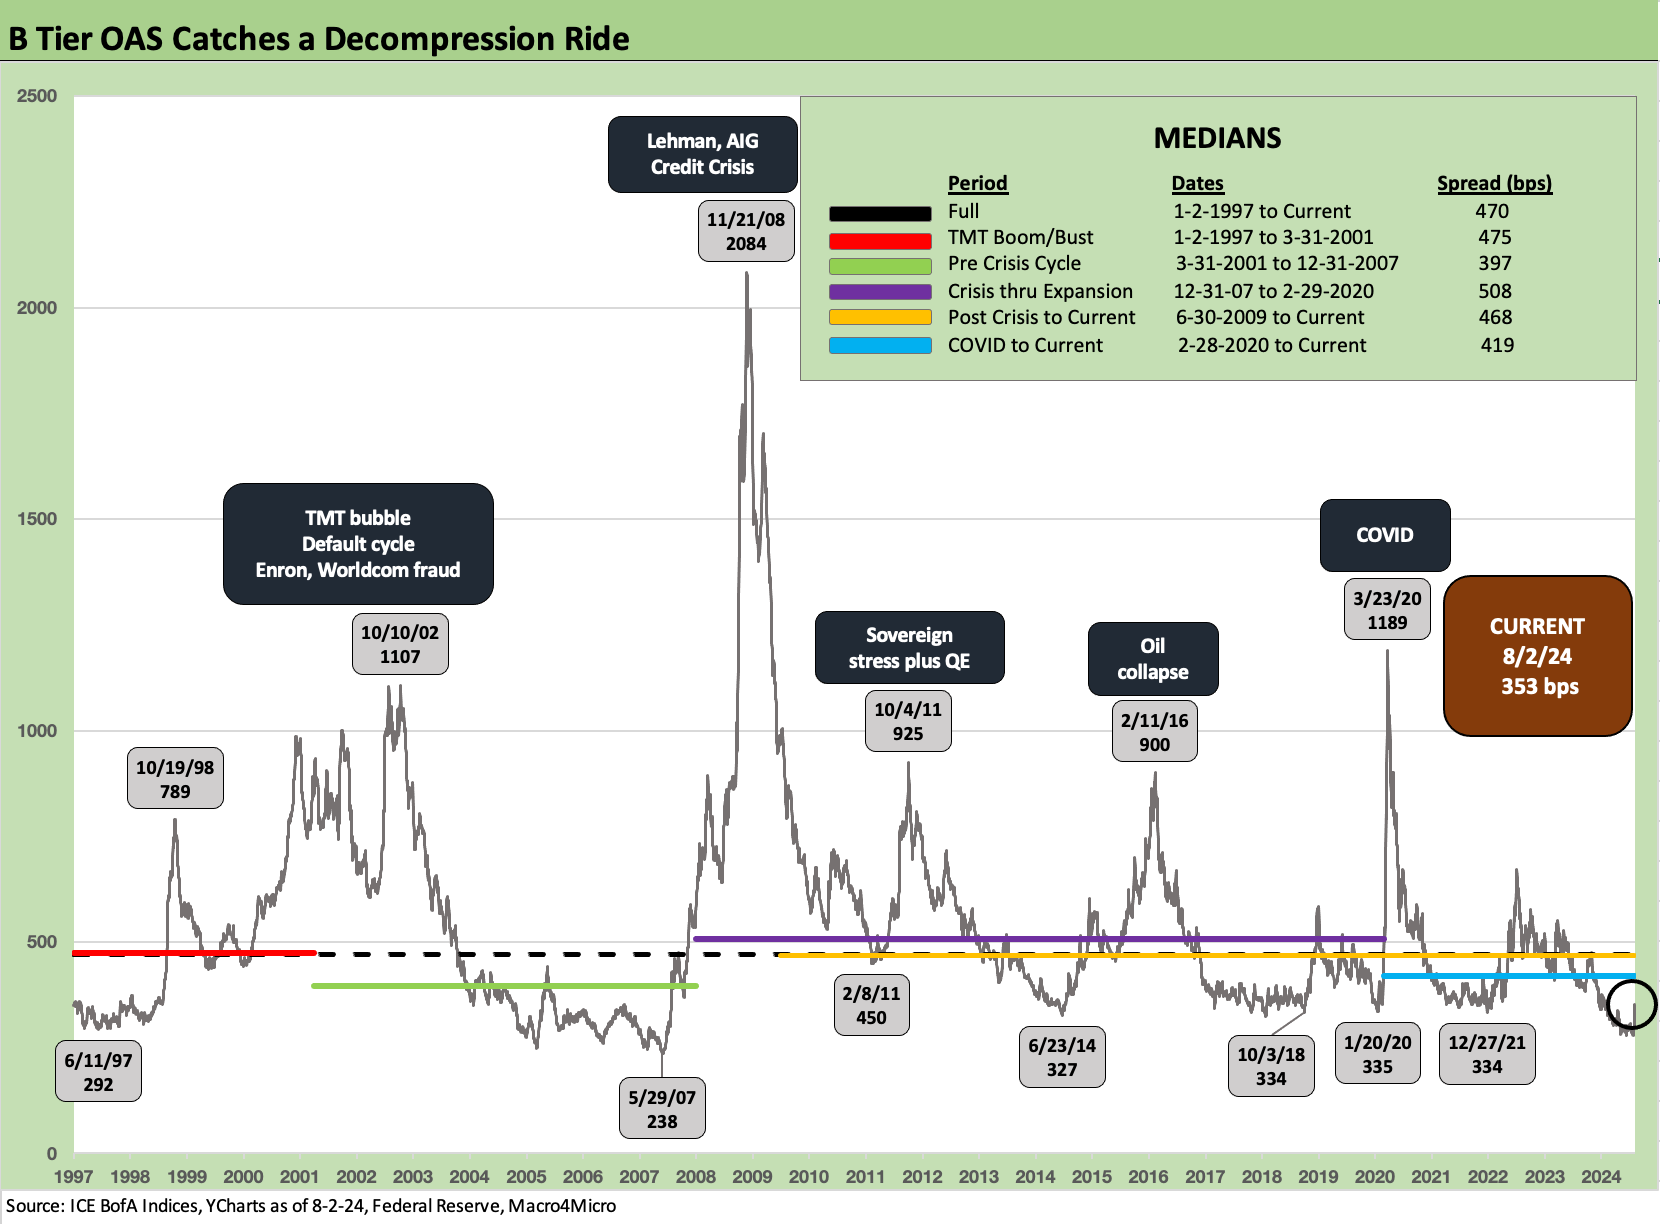
The B tier gapped out by +64 bps the past week to +353 bps from +289 bps. As we see in the lows along the time series above, that +289 bps takes you back to mid-2007 to find lower spreads (much lower at +238 bps on 5-29-07). The repriced B tier at +353 bps is only modestly above the lows of Dec 2021, Jan 2020, Oct 2018, and June 2014. The latest setback took B tier spreads from extremely compressed to just compressed.
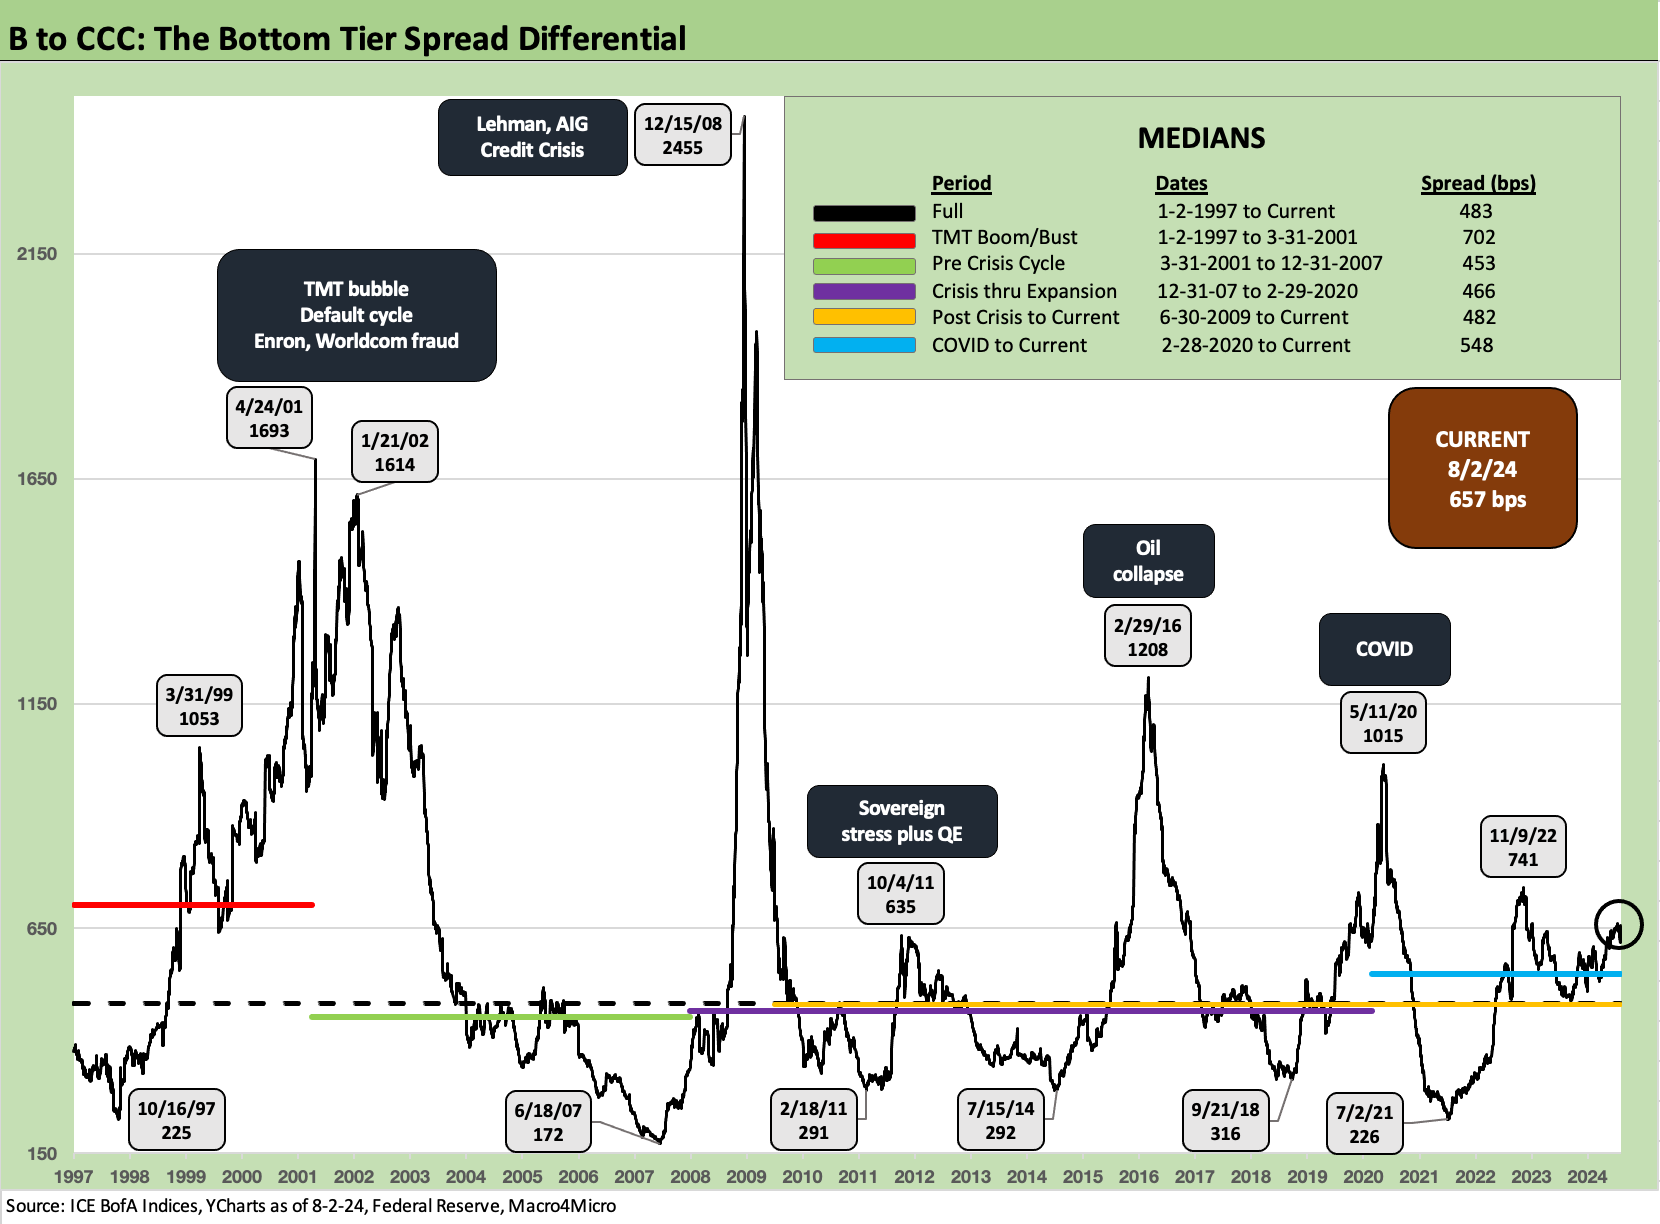
The B to CCC tier differential is a topic we discussed at length in a detailed commentary a few weeks back (see The B vs. CCC Battle: Tough Neighborhood, Rough Players 7-7-24). Our view has not changed since then.
CCC is all about the single name selection and less about credit tier aggregate OAS for the mix. As a collection of names at this point, the quality spread differential is well above the long-term median and all the median timelines in the chart except the late TMT cycle median of 1997 to 2001, which was an especially awful underwriting cycle.
Looking across some yields…
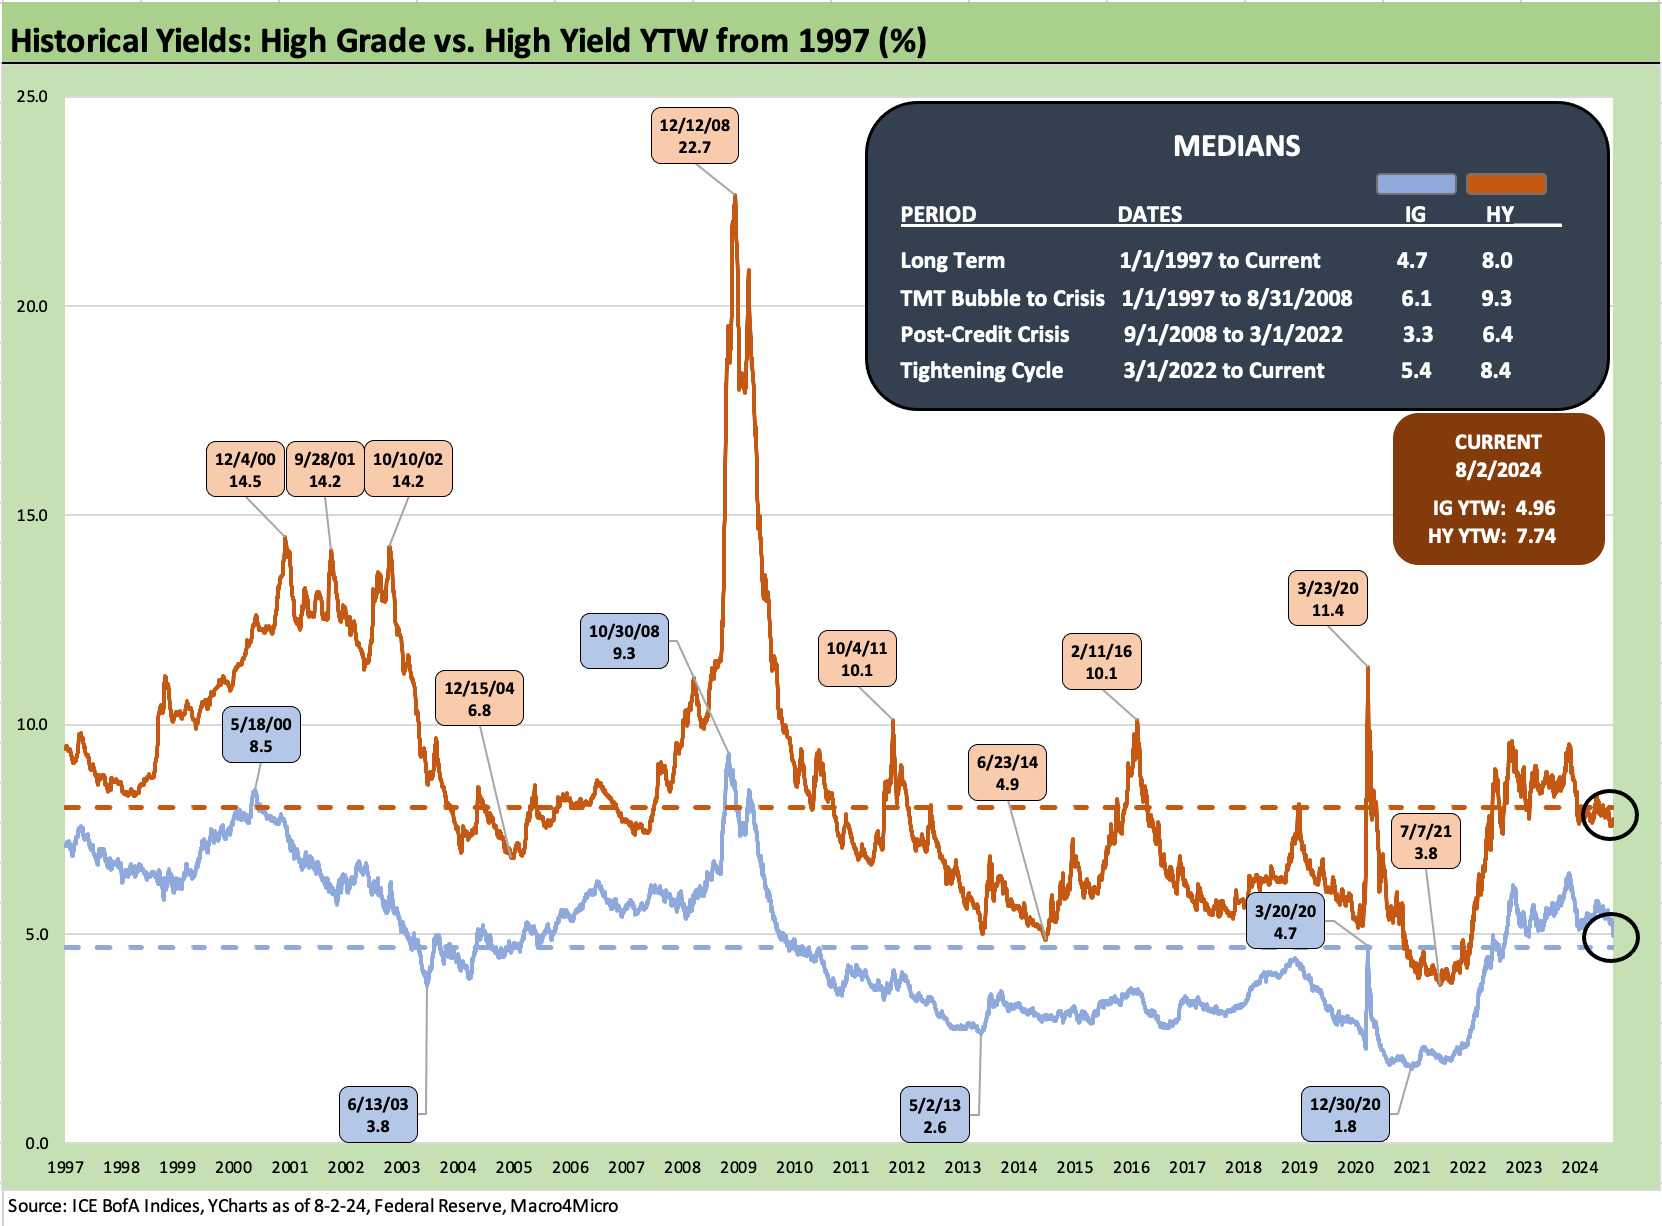
The above chart updates the running YTW for the IG and HY indexes across time. We use it to highlight what we see as the most relevant median, which is the YTW from outside the ZIRP years and post-ZIRP normalization period. In this case, these are the pre-crisis medians of 6.1% for IG and +9.3% for HY.
The other periods and related medians are distorted by monetary policies and thus artificially depress the all-in yields. We also have some distortions during crisis moments such as Dec 2008 and March 2020 (COVID). It is food for thought. At the very least, it implies that the current 7.74% is low for HY and the same for the 4.96% for IG. The UST is the fact in the yield and “the art with a dash of science” is in what the fair value credit risk premium is for a given market backdrop. The long-term medians including all those ZIRP and QE years bring a long-term median of 4.7% for IG and +8.0% for HY.
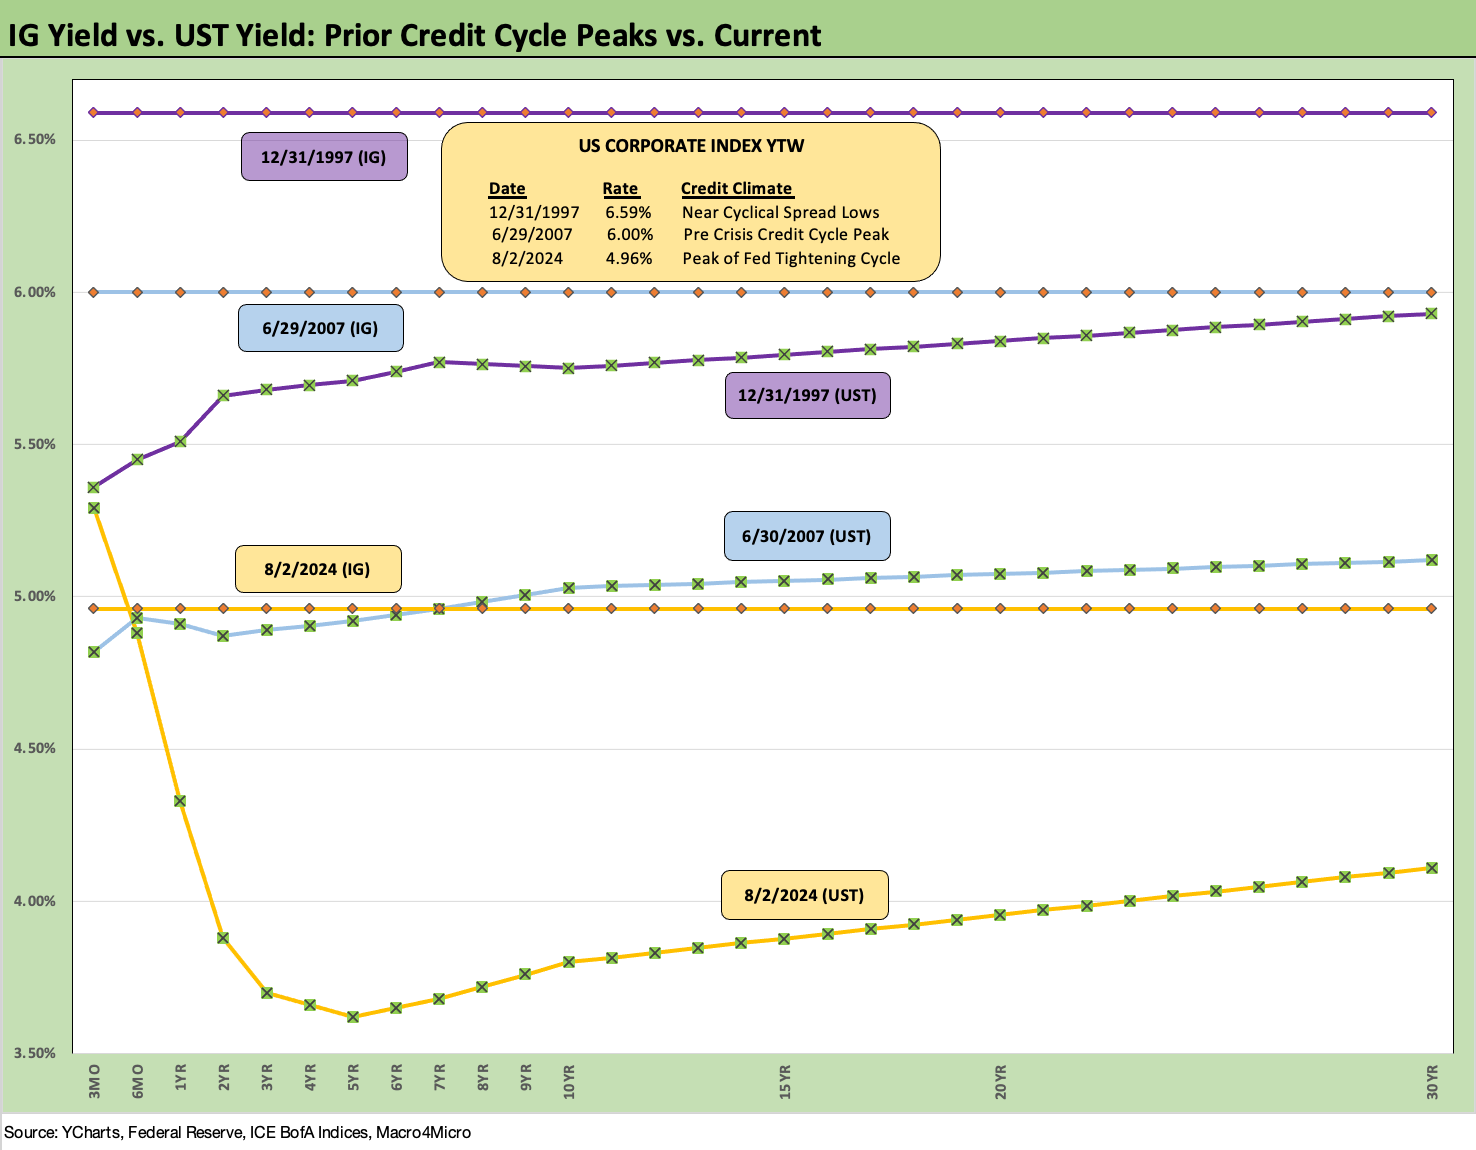
The above chart is something we use for historical context as we compare current IG index yields to prior credit market peaks in late 1997 and mid-2007. We also detail the UST curves in those earlier peak periods.
The current UST curve is exceptionally low vs. those earlier periods with the main distortion being the front end inversion and very steep inversion of the 3M UST to 5Y UST slope or 3M to 10Y slope (see Footnotes & Flashbacks: State of Yields 8-4-24).
IG typically sets its sundial by the UST market and not the equity markets, but those correlations can shift in extreme scenarios such as the credit crisis, when IG’s correlation with the S&P 500 soared.
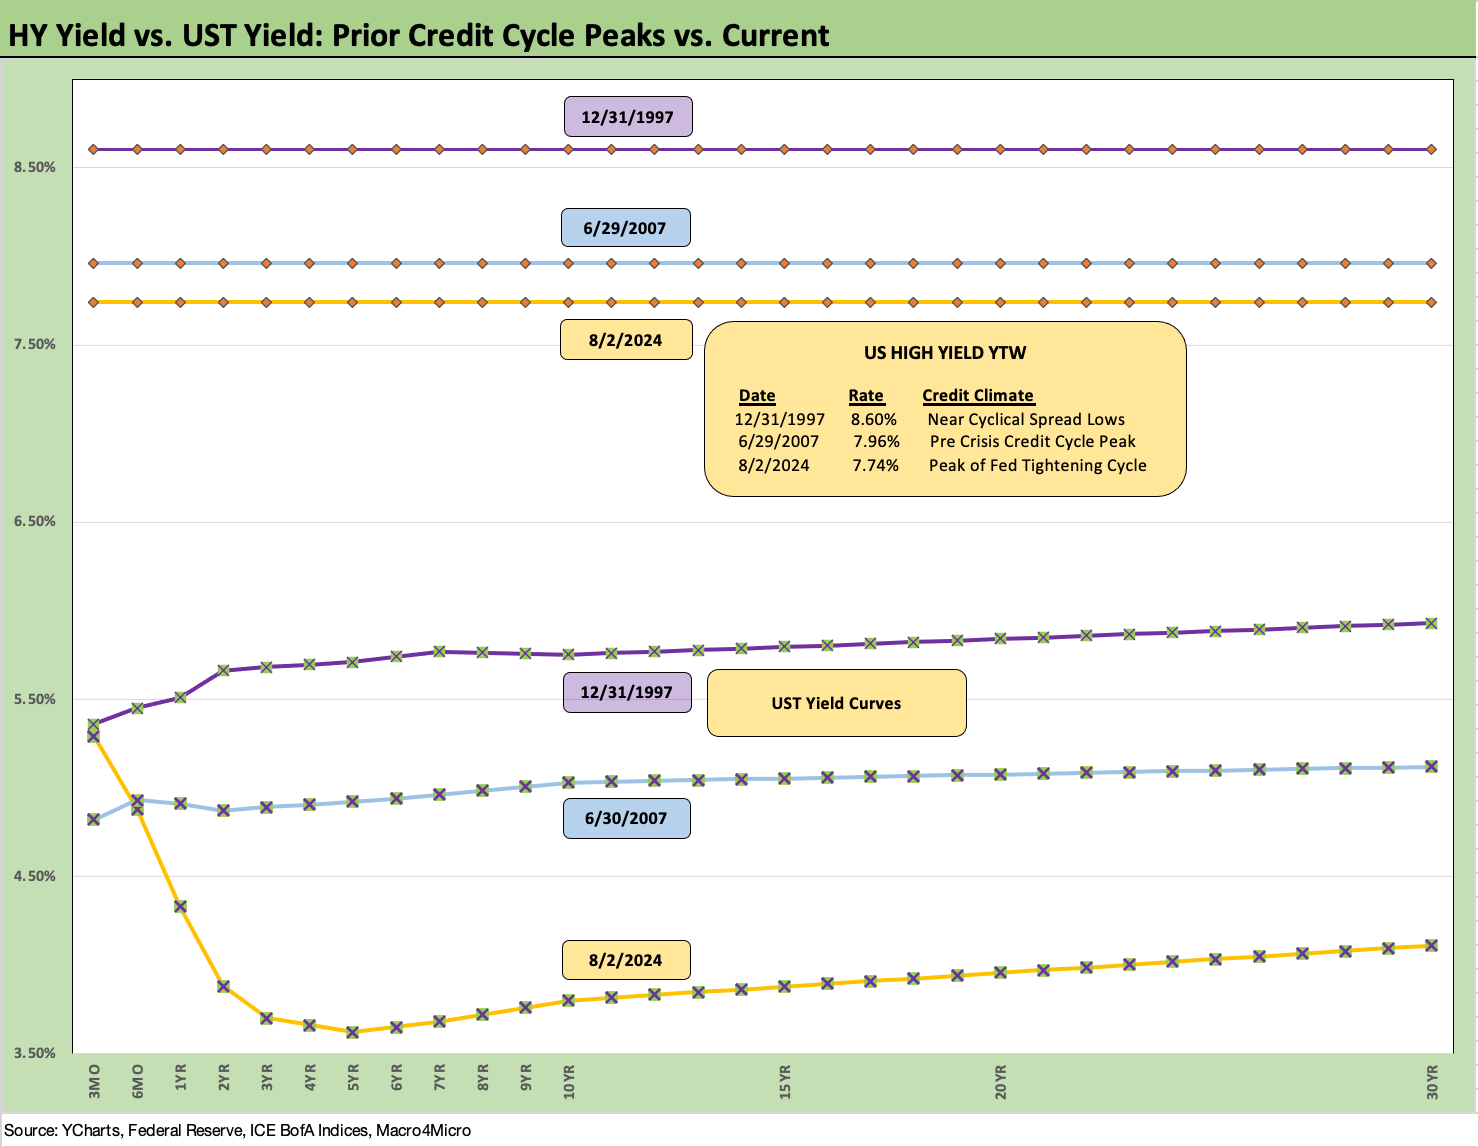
The above chart does the same drill for the HY bond index as we did for IG bonds. The same distorted relationship exists for the current UST curve on an inversion that as of this week will likely be seen as unsustainable. We had summarized all the relevant cyclical story lines for these periods in an earlier commentary (see HY Spreads: Celebrating Tumultuous Times at a Credit Peak 6-13-24).
Powell and the FOMC appear sensitive to their long term reputations, and easing too early and inflation surging again would send them back to the 1970s Hall of Shame. Holding the line too long with this headline backdrop and market chaos with a ticking clock to the ugliest election since 1860 would assure a bad history.
We would expect the FOMC to fold just as Greenspan did in 1991 and 2001. That came at a later cost, but a quick -50 bps buys time. Trump will scream bloody murder, but he was demanding negative rates (“I want what Germany has!”) back in his term. For those who want to go into the “not-so-wayback machine,” the warnings to him from advisers on inflation risk was met with the (paraphrase) response of “that’s the next guy’s problem.” You don’t get on the inflation hawk medal podium that way. Trump is the Violet Beauregarde from Willie Wonka (ironically, the girl who turns blue) who wants everything her way. Of course, Trump loves a good confederate name.
Contributions:
Glenn Reynolds, CFA glenn@macro4micro.com
Kevin Chun, CFA kevin@macro4micro.com
See also:
Footnotes & Flashbacks: State of Yields 8-4-24
Footnotes & Flashbacks: Asset Returns 8-4-24
HY Pain: A 2018 Lookback to Ponder 8-3-24
Payroll July 2024: Ready, Set, Don’t Panic 8-2-24
Employment Cost Index: June 2024 8-1-24
JOLTS June 2024: Countdown to FOMC, Ticking Clock to Mass Deportation 7-30-24
Footnotes & Flashbacks: Credit Markets 7-29-24
Footnotes & Flashbacks: State of Yields 7-28-24
Footnotes & Flashbacks: Asset Returns 7-28-22
Presidential GDP Dance Off: Clinton vs. Trump 7-27-24
Presidential GDP Dance Off: Reagan vs. Trump 7-27-24
PCE June 2024: Inflation, Income, and Outlays 7-26-24
2Q24 GDP: Into the Investment Weeds 7-25-24
GDP 2Q24: Banking a Strong Quarter for Election Season 7-25-24
Footnotes & Flashbacks: Credit Markets 7-22-24
Footnotes & Flashbacks: Credit Markets 7-15-24
Footnotes & Flashbacks: Credit Markets 7-8-24
The B vs. CCC Battle: Tough Neighborhood, Rough Players 7-7-24
 |
|