
Footnotes & Flashbacks: Asset Returns 8-11-24
The wild Hi-Lo swings came after two days of chaos that reverted back to normal volatility and cyclical angst with a “net” move on the week that was minor.


“I am a steel trap on facts. No way there were two 1,000 point Dow drops in the same week in Feb 2018 and all negative returns for the benchmarks for calendar 2018. Didn’t happen. Greatest economy in history.”
The week started with a VIX fixation with an intraday 65 on Monday, but then the markets turned around into a muted week on a net basis. There was no shortage of Tuesday morning quarterbacks as the world turned, people spent money, motive power did not cease, and Dagney Taggert started to look like Miss Havisham waiting for the Apocalypse.
The journey from Friday to Friday ended up like surfing a rogue wave with a safe landing as stock benchmarks posted some decent rallies, HY spreads tightened, and some calm crept back into the evolving sense of risk aversion that has not fully taken hold with so much economic activity going on.
While there are plenty of reasons to worry about the massive differences in policy “evolution” and dysfunction potential ahead of the election and who takes the White House (election rejection risk, debt ceiling, Tariffs ‘R’ Us, mass deportation and a new ICE age, etc.), there are plenty of econ indicators to frame up and FOMC color to gain between now and then.
We will get a full calendar of economic releases this week across inflation (CPI index), the consumer (retail sales, consumer sentiment), and some input from the economic multiplier effects sectors (Industrial Production, Housing Starts).

The above table sends a message not much different than last week in that large caps and growth stocks are feeling some pain. The jury is still out (or on volatility vacation?) on whether a sector rotation is underway. The more logical explanation might be that the cyclical debate is heating up and that tech valuations still make many investors nervous.
The major debt benchmarks we watch are all back to positive on the rolling 1-month period, 3 months, 6 months, and 1 year. Considering how the curve was beat up for much of this year and last summer and early fall, that is an impressive comeback even if the key drivers of the UST shift have both good news (lower inflation) and bad news (slowing consumer, lagging manufacturing, and perhaps repressed Washington policy fears around pent-up post-election discounting).

The above table updates the 1500 and 3000 series. Growth is ugly again this week in what was a brutal month for tech. The 6-month returns for Growth are now in last place on this list but still ahead for the trailing year. Looking back 3 years before Russia-Ukraine and the tightening cycle, Energy is the running total return winner with Industrials now ahead of Growth. Real Estate is dead last in the red zone over 3 years.
The always-volatile energy sector has lagged of late, but the Middle East tension with Iran and Israel is always a day at the casino lately in the “will they or won’t they” guesswork on retaliation, the Strait of Hormuz traffic jam potential, and the usual geopolitical scenario spinning. Real Estate has been mounting an impressive comeback in income stock math of late, and the handicapping of where the UST curve will take the valuation of REITs is a challenge until the FOMC gives more color and we see a few more CPI/PCE releases.
The rolling return visual
In the next section, we get into the details of the 32 ETFs and benchmarks for the usual trailing periods. Below we offer a condensed 4-chart view for an easy visual before we break out each time period in the commentary further below. This is a useful exercise we do each week looking for signals across industry groups and asset classes.

The above chart at a glance highlights the world did not end this week with winners and losers to be researched as they wind down reporting season. The macro picture gets a little more muddied by cyclical crosscurrents tied to domestic data such as a muted, lower but positive payroll number. The market also felt some global capital markets noise including the latest round of the carry trade debate. That is not new but one that is heavy on extrapolation steroids as experienced in past cycles. Anything that involves central bank policies, the murky nature of currency trends, leveraged counterparties, and global flows always can generate some systemic nerves.
The fact that the 1-month trailing period is 20-12 in favor of positive returns and 3 months posts 21-11 in positive range might indicate that a call for cyclical last rites needs more evidence at this point. The fact that 10 of the asset return line items were positive over the past week (measured from the closing price on Friday 8-2-24) is a reality check. We have had worse weeks in 2024 but not as volatile. We saw worse action early in 2018 before the equity market raced to highs and HY spreads to low before it all then tanked in 4Q18 (see HY Pain: A 2018 Lookback to Ponder 8-3-24).
Whether the wild price action of the VIX (see Volatility and the VIX Vapors: A Lookback from 1997 8-6-24) or the sheer scale of the price action for a few days signals trouble ahead, it is easy enough to see why the timeline shortens to a Sept FOMC move followed by a few more useful sets of data to help frame election worries. Cycles do age, and the curve has taken a toll.
The Magnificent 7 heavy ETFs…
Some of the benchmarks and industry ETFs we include have issuer concentration elements that leave them wagged by a few names. When looking across some of the bellwether industry and subsector ETFs in the rankings, it is good to keep in mind which narrow ETFs (vs. broad market benchmarks) get wagged more by the “Magnificent 7” including Consumer Discretionary (XLY) with Amazon and Tesla, Tech (XLK) with Microsoft, Apple, and NVIDIA, and Communications Services (XLC) with Alphabet and Meta.
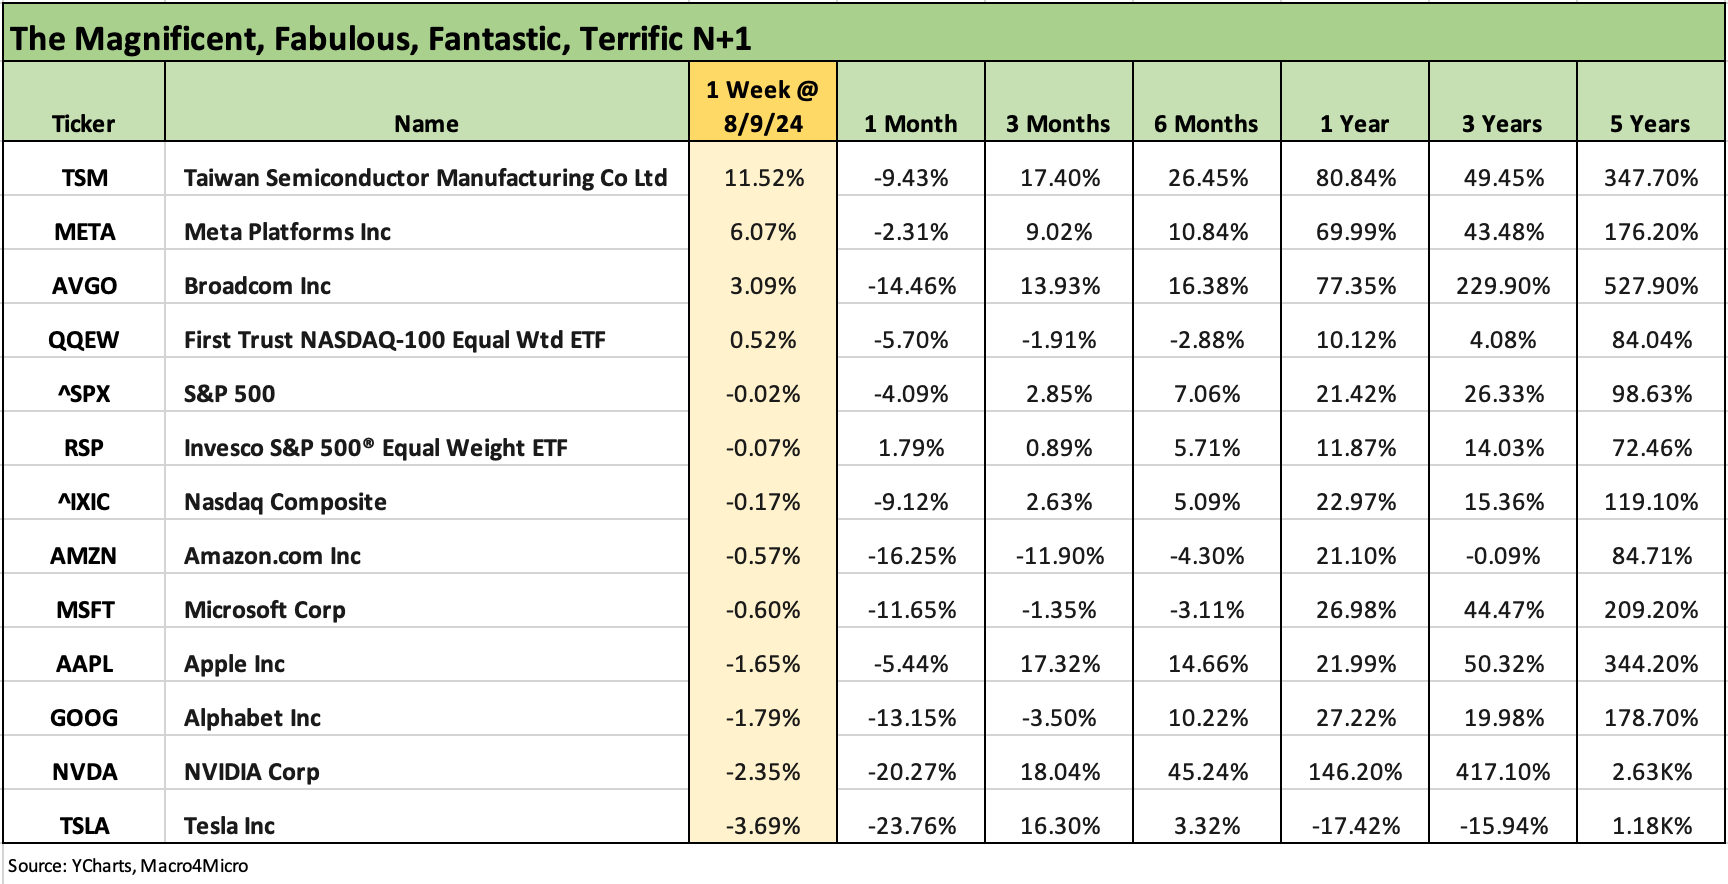
The above table updates the trouble in tech paradise for the past week and month. Taiwan Semi reported some good numbers this week to take some heat off Trump’s threats against Taiwan and the usual anxiety around the chip markets and how that will evolve in the periods ahead on trade tensions. The week was still obviously an ugly one with 6 of the Mag 7 in the red and 5 of 7 in double-digit negative range for the trailing month.

The above chart updates the 1-week returns for a cross-section of ETFs and benchmarks. Given the dislocations from Friday close to Monday open, we highlight that we generate our 1-week returns from Friday close. As a result, they might differ from some weekly returns that get published around and about. The beatdown ahead of Monday open was pretty nasty for many equities from the Friday close. In other words, we saw some material differences between Friday close and Monday open.
The scoresheet shows 10 positive and 22 negative total returns for the week. Under the circumstances, those final return numbers were not too bad the way the market chaos was shaping up from the Friday mess (see Payroll July 2024: Ready, Set, Don’t Panic 8-2-24).
The UST market had rallied sharply from the Friday close, so based on the returns from the panic peak through Friday (8-9-24) close, the bond ETFs had a tough 5-day ride from after that initial pop higher on the panic. This chart shows the long duration 20+ year UST ETF (TLT) in second to last place, but it is also now in the top quartile for the 1-month return numbers at #5 in the next chart. For the 1-week period from Friday close, the big rally in HY spreads on the week sent HYG into a rebound up into the high end of the second quartile but into the third quartile for 1-month with a material spread widening of +32 bps.
The top sectors for the week are revealing around cyclical views with Industrials (XLI) at #1, E&P (XOP) at #2, Energy (XLE) at #3, EM equities (VWO) at #4 and most importantly Financials (XLF) at #5. That mix in the top tier leaders give some immediate pushback on excessive systemic and cyclical fears.
Over in last place for the week on the right, we see the Homebuilders (XHB) in the confusion of the Friday to Monday dislocations as the UST whipped around. The 1-week numbers from such a pricing dislocation over the weekend comes with more than a few asterisks.
Despite the week, XHB is #1 for the 1-month period as noted in the next chart with the Real Estate ETF (XLRE) just behind XHB. Interest rate sensitive assets are catching even stronger tailwinds. As noted, TLT was hurt as it came off the massive rally and the markets saw less panic. Regional Banks with their small cap bias took a beating despite XLF ranking in the top quartile. We see Russell 2000 small caps in the low end despite the ensuing rally after the Monday open (which was well below the Friday close).

The 1-month chart smooths out the “Friday close/Monday open” dislocations and gives a more rational view of relative performance during earnings season. The top quartile is heavy on the interest rate sensitive names with the top 5 comprised of XHB, XLRE, KRE, XLU, and TLT. Bond ETFs have 1 in the top quartile (TLT), 4 in the second quartile (GOVT, AGG, LQD, EMB), and 2 in the third quartile (SHY, HYG). HYG took a hit on spread widening over the month despite the rally this past week.
The bottom tier shows the tech beatdown including XLK in last place ahead of NASDAQ (IXIC) and Consumer Discretionary (XLY) with the TSLA and Amazon pain detailed earlier. Base Metals continues its problems as it falls from earlier speculative peaks with China and cyclical worries globally not helping the story line. We see the BDC ETF (BIZD) in a fade on rates and growing concerns around where credit quality could head.

The 3-month score of 21-11 in favor of positive is not signaling an expectation of near term tragedy with the 2Q24 earnings season pretty much over as the S&P 500 has over 90% of earnings reports complete. The notable winners are tied to the UST rally with 3 bond ETFs (TLT, AGG, GOVT) in the top quartile and the other 4 in the second quartile (LQD, EMB, HYG, SHY).
We see E&P (XOP), Base Metals (DBB), Transports (XTN), and Energy from the bottom up in a less than stellar sign around global cyclical expectations (notably China) with major developed market cycles also getting second-guessed.

The LTM returns mix is still holding the line at 30-2 with Transports (XTN) and E&P (XOP) on the bottom and TLT building in some comfort on the lowest of the positive returns. The mix in the top tier still has builders at #1 (XHB) with tech-heavy ETFs (XLC, XLK) and broad market benchmarks still feeling the Mag 7 year (NASDAQ, SPX). Financials (XLF) is a reassuring member of the top 5 given all the noise around systemic risks and geopolitics. Regional Banks (KRE) are only a few notches down into the second quartile.
The weakest returns include 4 bond ETFs in the bottom quartile (TLT, GOVT, SHY, AGG) with duration-heavy LQD at the bottom of the third quartile and EM Sovereigns (EMB) near the top of the third quartile. A good run for HY (HYG) has that bond ETF just across the line in the second quartile.
See also:
HY Industry Mix: Damage Report 8-7-24
Volatility and the VIX Vapors: A Lookback from 1997 8-6-24
Footnotes & Flashbacks: Credit Markets 8-5-24
Footnotes & Flashbacks: State of Yields 8-4-24
Footnotes & Flashbacks: Asset Returns 8-4-24
HY Pain: A 2018 Lookback to Ponder 8-3-24
Payroll July 2024: Ready, Set, Don’t Panic 8-2-24
Employment Cost Index: June 2024 8-1-24
JOLTS June 2024: Countdown to FOMC, Ticking Clock to Mass Deportation 7-30-24
Footnotes & Flashbacks: Credit Markets 7-29-24
Presidential GDP Dance Off: Clinton vs. Trump 7-27-24
Presidential GDP Dance Off: Reagan vs. Trump 7-27-24
2Q24 GDP: Into the Investment Weeds 7-25-24
GDP 2Q24: Banking a Strong Quarter for Election Season 7-25-24
The B vs. CCC Battle: Tough Neighborhood, Rough Players 7-7-24