
Footnotes & Flashbacks: State of Yields 8-11-24
The UST market sees a partial retracement of the major UST rally off the prior Friday’s chaos that spilled into Monday.


“Listen kid, don’t take any crap from the White House or ideologues in Congress.”
The favorable yield curve shift during the prior Friday panic started to quickly reverse over the past week as the end of the world was not imminent and many reminded themselves that economic activity is not set by the yen carry trade and intraday VIX.
The wild swings of Friday to Monday gave way to some rallies in risk and retracement along the UST curve as the “sell first and ask questions later” impulses eased, and the market refocused on the reality on the ground rather than the extrapolated fears of what might happen if everything goes wrong.
The UST curve is dramatically below levels seen outside ZIRP markets and the years before the credit crisis, but the inversion is seen as overdone and has to move lower or corporate capital budgeting and payroll plans might get dialed back and consumers further fade to the point of economic contraction.

The above chart updates the positioning of the current UST curve relative to past cycles that were “non-ZIRP” and “non-QE” markets. We exclude any curves from the intermittent bouts of “normalization” that came after Dec 2015 until ZIRP came back in March 2020 with COVID on the way to the start of the tightening cycle and inflation fighting in March 2022.
The ability to normalize and wean the market off the post-crisis easy money period was undermined by Trump across 2018 into 2019 as he screamed for Germany’s negative rates. The 2019 easing came for other reasons as the economy struggled in the face of tariffs and trade battles. That history does not come up much in a partisan election year, but those in the markets remember. The worries are real that 2025 prospects will again fight history by expecting a different outcome from tariffs.
For now, the above UST curve highlights that UST rates are very low, but the pivotal UST declines needed on the front end are controlled by the Fed. Then the long end controlled by the market can start to cast their votes on how they see the residual effects of inflation as they also cast their votes in the election. The outcome of the election will be assessed for likely inflation effects. The potential for broad, onerous tariffs and mass deportations is seen as a material risk by many (including us). Ideologues and economic pragmatists will have some unpleasant risks to balance (perhaps with their own conflicting mix of beliefs and partisan instincts).

The above chart updates the running UST deltas from the 10-19-23 10Y UST peak. We also update the running deltas from the 12-31-23 UST. The shapeshifting and deltas have been impressive after a stretch of adverse UST deltas during much of 2024 now moving into rally mode along the shorter segments of the curve. The UST curve is now upward sloping beyond 5Y to 30Y with a notable inversion still in place from 3M to 5Y UST.

The above chart updates the placement of Friday’s UST curve in the context of some notable dates before and during the Fed tightening cycle. We also include a memory box on the FOMC actions along the way to the current 5.25% to 5.5% range. We include a 12-31-21 UST curve as a frame of reference.
The convergence of the 12-31-22 and 12-31-23 curve in the long end (10Y and beyond) despite a 100 bps differential in fed funds is our gut check on whether we should be confident that the 10Y can move lower on 50 to 100 bps of FOMC easing. That is not assured.

The above chart updates the weekly move in UST off the lows after the shift lower seen in the UST last week (see Footnotes & Flashbacks: State of Yields 8-4-24). This week, we see a double-digit adverse shift across the UST curve. The UST tempo could pick up again this coming week depending on some critical data ahead with CPI and Retail Sales among others.

The above chart updates the YTD deltas as more of the UST curve is now lower after a protracted period in 2024 where duration was getting hit. The 10Y to 30Y UST steepened while the 1Y to 7Y moved lower in a bull steepening pattern in that segment.

The above chart updates the running shift lower from the 10Y UST peak date of 10-19-23. Duration has now had a good run after getting beaten up through the early fall of 2023 ahead of the major rally of Nov-Dec 2023.

Mortgages have come down notably for the Freddie Mac 30Y that is posted on Thursday. As we detail below, the Freddie 30Y mortgage tracks the 10Y UST and it has been a painful ride for home affordability. Recent improvements in affordability helped by high 6% handles but monthly payments are still sticker shock for many.

The pattern noted in the chart above highlights what a bruising journey it has been for mortgages, and that has fallen hard on some of the existing homeowners who might want to sell and then buy another home on the other side of the transaction. We have covered the challenge of “golden handcuffs” or the “locked-in effect” and its role in the housing market in our homebuilding and housing sector research. The magnitude of the move still leaves a lot of room to adjust, but the rates will need to come down by more than -50 bps to make a meaningful difference.
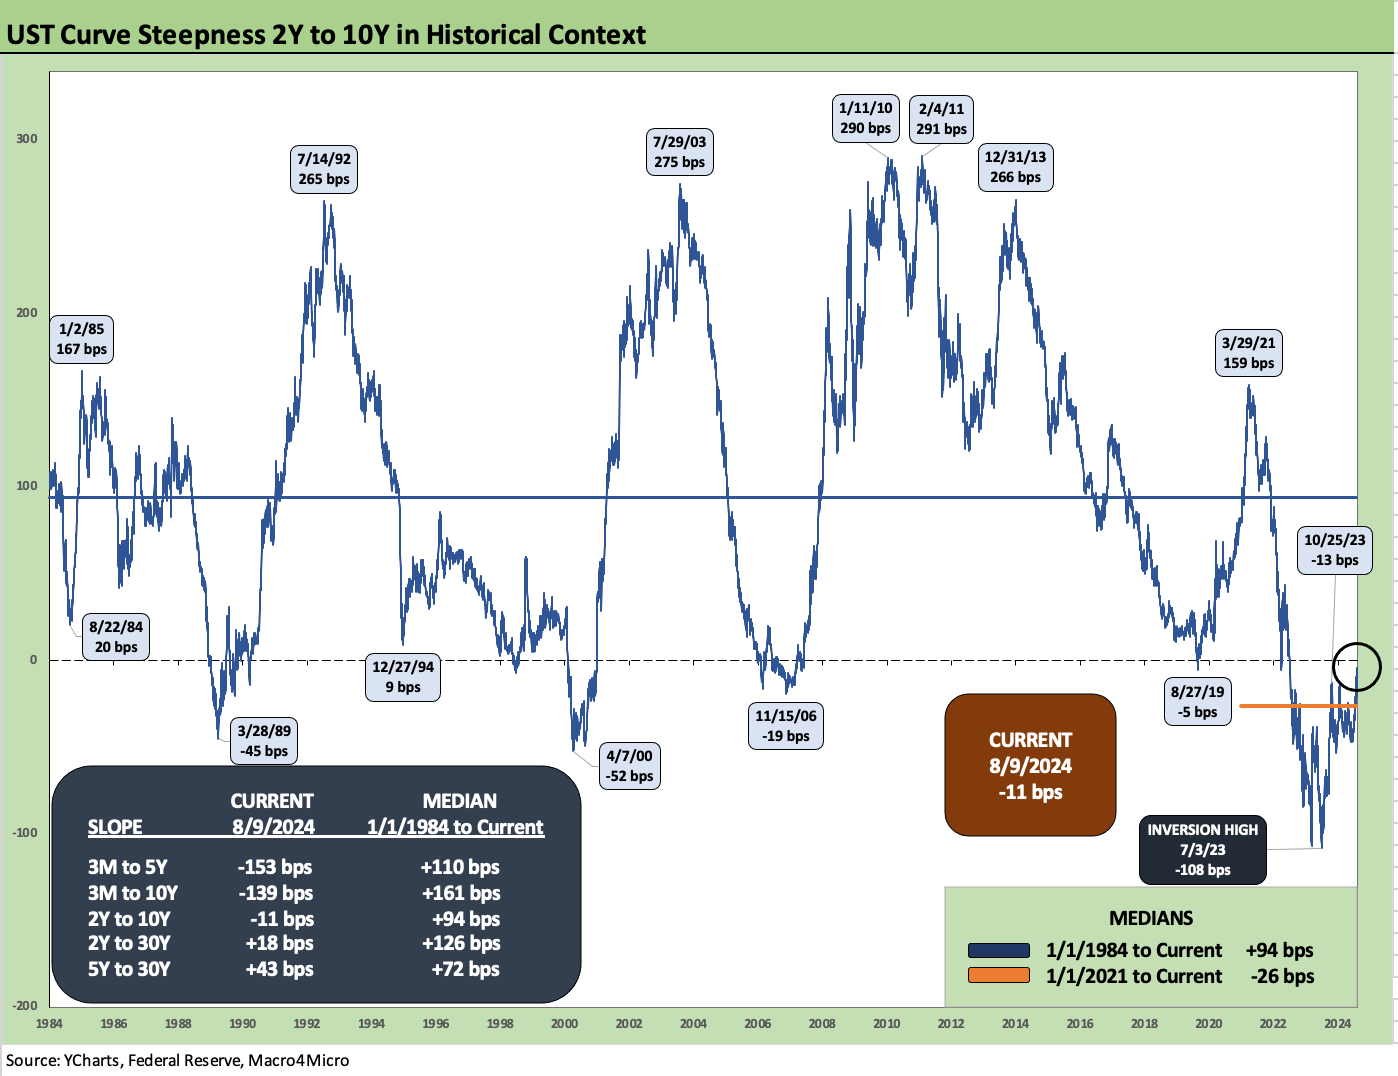
The above chart updates the 2Y to 10Y UST slope since 1984. The current inversion is now down to -11 bps vs. a long-term median of +94 bps. The inversion in place now is similar in magnitude to the summer of 2019 when the Fed was easing late in the cycle and in Nov 2006 when the housing bubble was peaking and the RMBS and structured finance bomb was ticking. The 2006 period was unique in capital markets history.
In contrast, the 2019 period was mired in tariffs and trade strife that generated underlying economic problems that drove the Fed to ease on weak investment and exports with 3 cuts in 2H19. COVID hit in early 2020 before the scenarios could play out. There are more direct lessons to learn from 2019 than 2006 for today’s policy makers. We can assume the lessons have not been learned on tariffs and trade.

The above chart shortens the timeline for the 2Y to 10Y slope shapeshifting to the period from Jan 2021, across the tightening cycle, and on through today. We see the peak upward slope of +159 bps down to a peak inversion of -107 bps in March 2023 and -108 bps in July 2023. We have come a long way back to -11 bps, but the norm of +94 bps ups the ante on how the 10Y UST can go materially lower with a few FOMC cuts unless there is pervasive sentiment of recession risk with lower inflation.

We wrap with the UST deltas from March 1, 2022 (ZIRP was effective as of 3-17-22) through this past Friday. We include the 10-19-23 UST peak date and 12-31-20 UST as frames of reference. The outsized inversion more than a year after the last easing action of July 2023 at low current PCE price inflation and CPI levels are getting beyond cyclically anomalous at this point. We will get another CPI print this week (see PCE June 2024: Inflation, Income, and Outlays 7-26-24, CPI June 2024: Good News is Good News 7-11-24). The market is tense after last week, so a setback in inflation could roil the market.
See also:
HY Industry Mix: Damage Report 8-7-24
Volatility and the VIX Vapors: A Lookback from 1997 8-6-24
Footnotes & Flashbacks: Credit Markets 8-5-24
Footnotes & Flashbacks: State of Yields 8-4-24
Footnotes & Flashbacks: Asset Returns 8-4-24
HY Pain: A 2018 Lookback to Ponder 8-3-24
Payroll July 2024: Ready, Set, Don’t Panic 8-2-24
Employment Cost Index: June 2024 8-1-24
JOLTS June 2024: Countdown to FOMC, Ticking Clock to Mass Deportation 7-30-24
Footnotes & Flashbacks: Credit Markets 7-29-24
Presidential GDP Dance Off: Clinton vs. Trump 7-27-24
Presidential GDP Dance Off: Reagan vs. Trump 7-27-24
2Q24 GDP: Into the Investment Weeds 7-25-24
GDP 2Q24: Banking a Strong Quarter for Election Season 7-25-24
The B vs. CCC Battle: Tough Neighborhood, Rough Players 7-7-24