
Footnotes & Flashbacks: Asset Returns 8-17-22
We update the risky asset rally and duration ride over an eventful week of stock moves, UST swings, and credit spread compression.


The Fed is on the way… any day now… almost there…I got ya covered…
A major rally in equities brought the best week of 2024, a volatile week for the UST curve that ended with a modest net positive, and some reassuring data from CPI and Retail Sales allowed some to forget the extreme early August volatility (see Volatility and the VIX Vapors: A Lookback from 1997 8-6-24).
There are ample warning signs of slowing in the consumer sector despite the modest but positive retail numbers while housing starts reflect the wear and tear of mortgage rates with the housing policy debates soon to get underway after a sweeping Harris plan could stoke up the housing policy discussions.
The wild asset return patterns since early August offer a reminder of the volatility to the downside of unpleasant surprises with the UST still quite low relative to past cycles outside the ZIRP and normalization periods (see Footnotes & Flashbacks: State of Yields 8-11-24).
Credit spreads tightened and remain compressed in historical context after a wild swing with HY OAS closing this week back in the area of multicycle lows at +329 bps (see Footnotes & Flashbacks: Credit Markets 8-12-24).

The above chart updates the high-level index benchmarks we use for debt and equity. This week, we added a YTD column and line up the asset classes in descending order of total returns for the YTD period.
The table shows the 4 major equity benchmarks are all still in the red for the trailing 1-month period despite the big week for equities. We detail the 1-week period further below in our “review of 32” covering bellwether ETFs and major index benchmarks. This week, the 32 benchmarks and ETFs were all positive with tech or Mag 7 benchmarks holding down the top 5 positions. The Tech ETF (XLK) pulled away from the field at over +7% for the week. The lowest return for the week was a slight positive for the 1Y to 3Y UST ETF (SHY) below +1%.
For the 1-month period detailed above for equities, we show that the tech-centric NASDAQ and the US-centric small caps (Russell 2000) still took the worst beating for that 1-month period despite the rally week. The Russell 2000 had a solid recent week at +2.9% but it is down in the bottom 5 of the 32 for the 1-month as we cover below. The small cap excitement will be the shortest sector rotation theme in history unless the Fed can breathe new life into it. The dazzling Russell 2000 move during the month of Dec 2023 did not last even with the soft landing theme holding during 2024 (see Footnotes & Flashbacks: Asset Returns 1-1-24).

The above chart updates the 1500 and 3000 series in equities. We still see 4 of the 6 benchmarks we track in negative return territory with Financials barely positive. Growth has been the worst performer for the month but remains the YTD winner with 4 of the 6 benchmarks in double digit returns. For the rolling 3 months, Real Estate is in the lead as the constructive UST expectations have been helping a wide range of REITs and offering up hopes for extending the real estate cycle for investors even as subsector prospects materially vary.
The rolling return visual
In the next section, we get into the details of the 32 ETFs and benchmarks for a mix of the trailing periods. Below we offer a condensed 4-chart view for an easy visual on how the mix of positive vs. negative returns shape up. This is a useful exercise we do each week looking for signals across industry groups and asset classes.

The shape of the time horizon charts we summarize above do not signal panic by any stretch although the mixed performance and volatility spike of the past month sharpens the senses as we hit the halfway point in 3Q24. The FOMC decisions are dead ahead, and the policy gap between Trump and Harris could not be greater without hitting escape velocity on a path into space.
Considering how rough the past month was in the headlines (“end of the world is nigh… emergency cuts now…the recession is here…”) that 1-month return profile in the upper right was not too bad as we roll out of an all-positive week of returns as noted in the upper left.
The challenges are not small with plenty of risk ahead, but the median GDP levels by quarter (and PCE and fixed investment by quarter) have been higher in the current administration than the last administration and the CPI inflation rate at least broke into the 2% handle range this past week (see CPI July 2024: The Fall Campaign Begins 8-14-24).
Unemployment rates are moving higher but with near record payroll ranks (“workers with paychecks”). The mix of variables makes for a tricky basket of ingredients within the largest and most diverse economy in history with healthy banks. That said, geopolitics and domestic political hatred are not to be taken lightly as they bring a “holy war” mentality into the equation (that was also for domestic politics).
The Magnificent 7 heavy ETFs…
Some of the benchmarks and industry ETFs we include have issuer concentration elements that leave them wagged by a few names. When looking across some of the bellwether industry and subsector ETFs in the rankings, it is good to keep in mind which narrow ETFs (vs. broad market benchmarks) get wagged more by the “Magnificent 7” including Consumer Discretionary (XLY) with Amazon and Tesla, Tech (XLK) with Microsoft, Apple, and NVIDIA, and Communications Services (XLC) with Alphabet and Meta.

The above chart tells a story of a banner week but a very rough month for the Mag 7 and the extended group of names we track each week. We include 9 single names (Mag 7 + Taiwan Semi and Broadcom) and 4 index benchmarks (two equal weight ETFs). We line up the companies and benchmarks/ETFs in descending order of 1-week total returns. We use this chart as an easy snapshot of “tech-land” each week after such a protracted period of the market being “wagged” by a relative handful of megacaps.
The table shows 6 of the Mag 7 in positive range for the week (ex-Alphabet) and 6 of 7 negative for the 1-month period (ex-Meta). The YTD numbers diverge more meaningfully from NVIDIA on top to Tesla on the bottom with negative YTD returns. TSLA is also negative for 1-year and 3-year.

The 1-week period pitches a shutout with all positive returns at 32-0. We see the Tech ETF (XLK) at #1 with +7.67% and the UST 1Y-3Y ETF (SHY) on the bottom at sub 1% returns. The top quartile was led by a top 5 comprised of tech-heavy line items or a Mag 7 heavy cap weighting (S&P 500). Regional Banks (KRE) and Financials (XLF) notably ranked in the top quartile with the small caps at #8.
With a very muted but net favorable move in the UST curve this week favoring duration (covered in a separate “Footnotes” publication on yields to be posted later), we see all 7 bond ETFs positive but with 4 bond ETFs in the bottom quartile with (ordered from the bottom up) SHY, GOVT, AGG and HYG. The lower end of the third quartile has the remaining bond ETFs. LQD won the clash of the bond ETFs this week on a combination of duration and a credit spread rally.
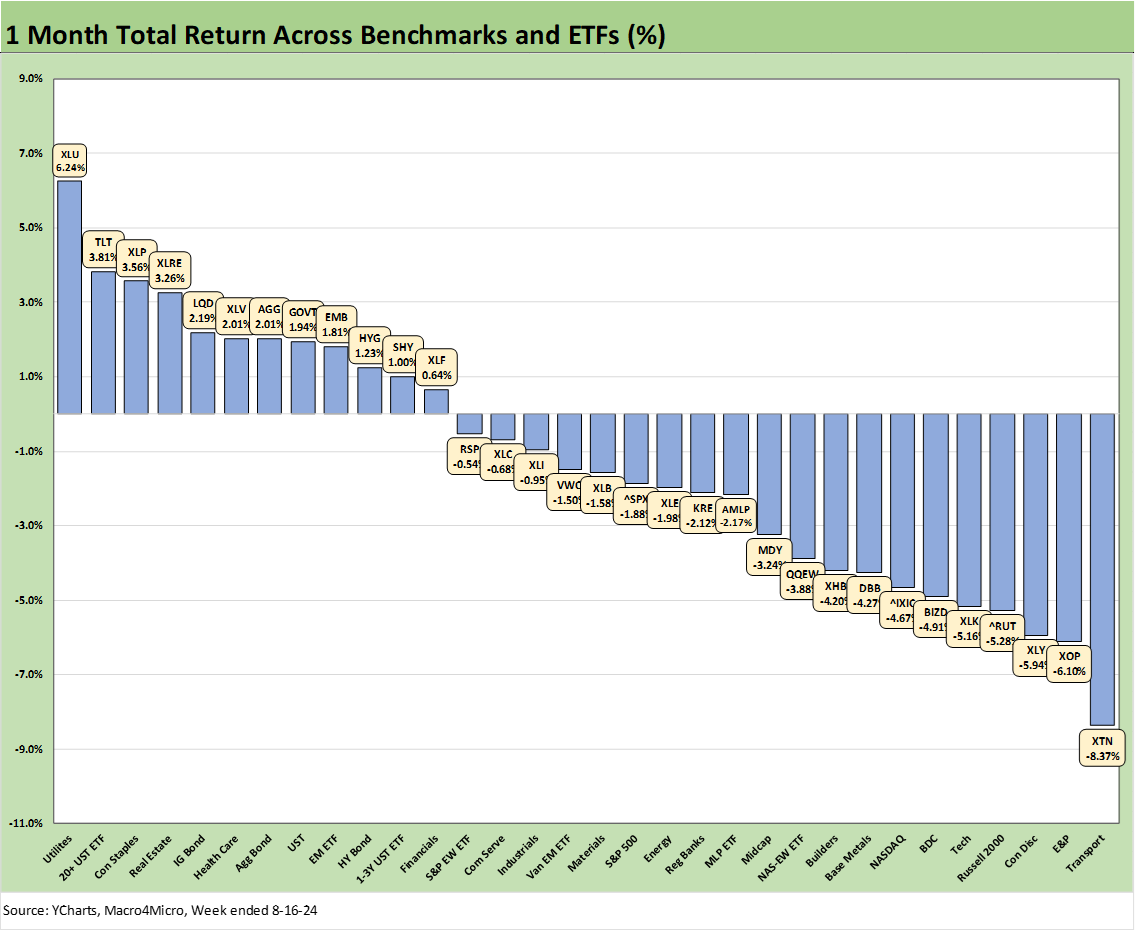
The 1-month period posted a score of 12-20 after last week’s 20-12. For the bond ETFs, the top quartile holds 4 of the 7 bond ETFs with TLT at #2 and LQD at #5 as both of those ETFs benefit from longer duration. We also see AGG and GOVT in the top quartile with EMB, HYG, and SHY leading off in the top 3 spots of the second quartile.
The “vote” on where duration heads from here is not as simple as believing the expected FOMC cut in Sept or more cuts in 4Q24 will translate into a meaningful downward shift in the 10Y UST or anything close to a parallel shift. Steepening is a safe bet, but the longer end of the curve may not cooperate when the election brings a choice of a tariff heavy plan and two candidates not inclined to put a major dent in the deficit if either candidate sweeps the White House, Senate, and House.
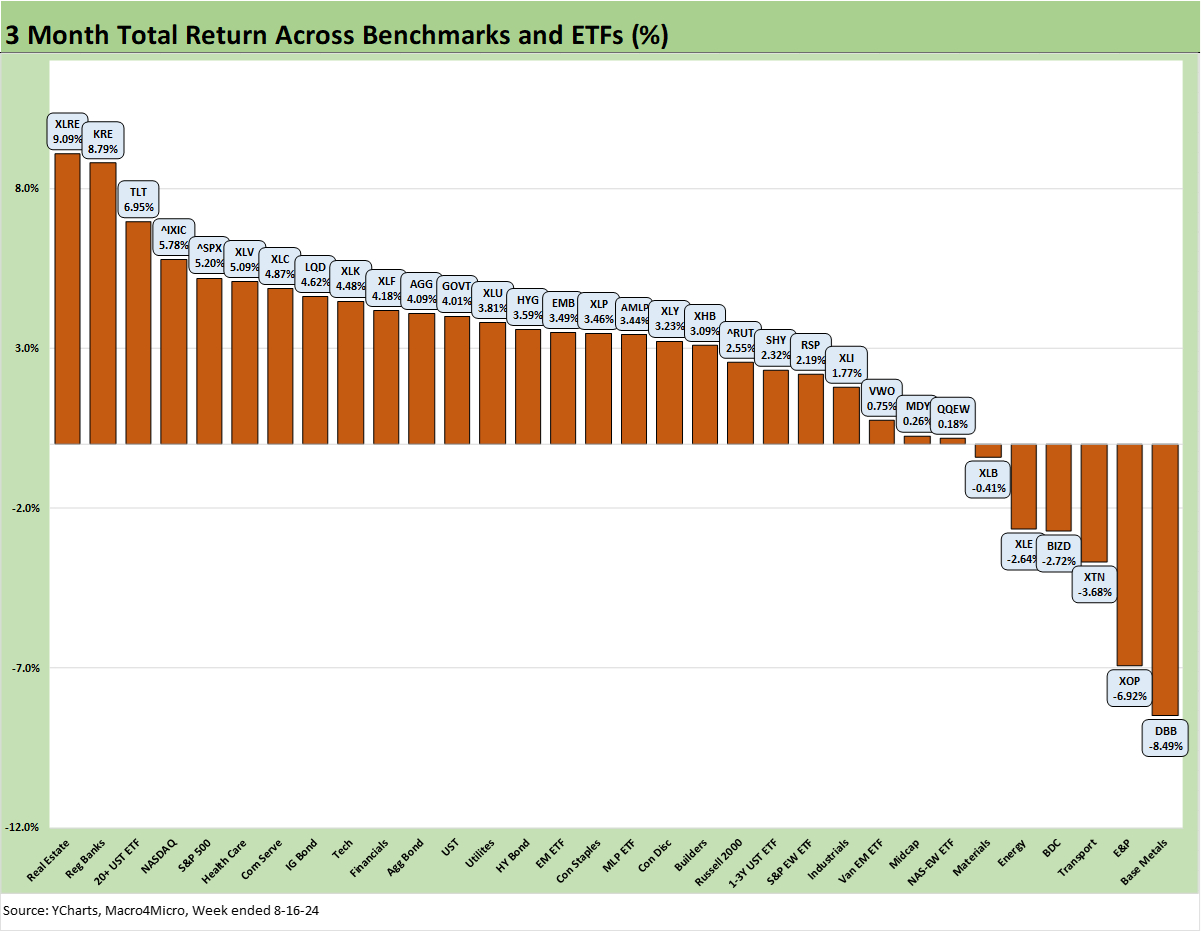
The 3-month returns weighed in at 26-6 with the nastier negative returns evident in Base Metals (DBB) and E&P (XOP). The Transport ETF (XTN) has been a constant struggle, is the sole ETF in negative range YTD, and is one of two negative returns for the LTM period (again with XOP).
The top 3 spots on the left have “yield curve” written all over them with Real Estate (XLRE), Regional Banks (KRE), and the long duration 20+ Year UST ETF (TLT). We also see LQD in the top quartile joining TLT. The second quartile includes 4 bond ETFs with AGG, GOVT, HYG and EMB. The third quartile includes the 1Y to 3Y UST (SHY).

We added a YTD chart to the weekly asset return collection given the stage of the year, the notable recent swings in the market, the recession debates that had been catching on of late, and movement of the bond ETFs ahead of some critical decisions in the fall.
The immediate visual above is that only 1 line is negative with a score of 31-1. The long-struggling Transports (XTN) have had a very hard time moving the needle. Weak manufacturing numbers, trade threats galore ahead, and a recession handicapping exercise that will not go away is not a set of factors that help transport optimism.
The YTD time horizon loses the benefit of the big Nov-Dec 2023 rally, but we still see tech heavy ETFs and benchmarks well represented in the upper ranks with Communications Services (XLC) at #2, NASDAQ at #3, Mag 7 heavy S&P 500 at #4 and Tech ETF (XLK) at #8.
Interest rate sensitivity also plays a big role with the winners with Utilities (XLU) at #1 and bolstered by a dual track story line including secular trends in power demand. A reassuring member of the top quartile is Financials (XLF) while Homebuilders (XHB) have held in the top quartile despite the recent fade on slowing demand and stubborn mortgage rates in historical context despite the move into 6% handles.
For bond ETFs, we see 5 of 7 bond ETFs are in the bottom quartile (TLT, GOVT, SHY, AGG, LQD) with two in the lower part of the third quartile (EMB, HYG). Interest sensitive equities certainly move quickly relative to bond ETFs.

The LTM period is still holding in at 30-2 with minimal negative returns. The Transport ETF (XTN) and E&P ETF (XOP) are the same as last week with the bond ETFs all in positive range with 4 of 7 bond ETFs in the bottom quartile (SHY, GOVT, TLT, AGG) and the other 3 in the third quartile (LQD, HYG, EMB).
See also:
Housing Starts July 2024: The Working Capital “Prevent Defense” 8-16-24
Retail Sales: Third Wind? 8-15-24
Industrial Production: Capacity Utilization Trends 8-15-24
Total Return Quilt: Annual Lookback to 2008 8-14-24
CPI July 2024: The Fall Campaign Begins 8-14-24
Footnotes & Flashbacks: Credit Markets 8-12-24
Footnotes & Flashbacks: State of Yields 8-11-24
Footnotes & Flashbacks: Asset Returns 8-11-24
HY Industry Mix: Damage Report 8-7-24
Volatility and the VIX Vapors: A Lookback from 1997 8-6-24
Footnotes & Flashbacks: Credit Markets 8-5-24
Footnotes & Flashbacks: State of Yields 8-4-24
Footnotes & Flashbacks: Asset Returns 8-4-24
HY Pain: A 2018 Lookback to Ponder 8-3-24
Payroll July 2024: Ready, Set, Don’t Panic 8-2-24
Employment Cost Index: June 2024 8-1-24
JOLTS June 2024: Countdown to FOMC, Ticking Clock to Mass Deportation 7-30-24
Footnotes & Flashbacks: Credit Markets 7-29-24
Presidential GDP Dance Off: Clinton vs. Trump 7-27-24
Presidential GDP Dance Off: Reagan vs. Trump 7-27-24
2Q24 GDP: Into the Investment Weeds 7-25-24
GDP 2Q24: Banking a Strong Quarter for Election Season 7-25-24