
JOLTS June 2024: Countdown to FOMC, Ticking Clock to Mass Deportation?
With eyes focused more on Friday’s payroll than the1-month lag in JOLTS numbers, the job openings remain solid.


Has anyone ever seen these two guys in the same room?
The oddsmakers have a Sept FOMC cut in the bag, but the JOLTS stats showing job openings do not help the easing story, and openings remain materially above the highest numbers seen under Trump (7.5 million, Nov 2018).
The labor markets and supply-demand imbalances across occupational categories are heading toward some potential tectonic changes in 2025 with mass deportation a hot topic as seen on posters and signs at the GOP convention.
To date, the mass deportation advocates do not bring any economic analysis or signs of research into how it would be conducted (sort of like “repeal and replace” health care planning).
The wildcard in framing payroll totals and job openings is the ill-defined and amorphous mass deportation game plan with the underlying theme of “Stephen Miller will be coming to a guarded stadium near you.”
Market watchers and analysts should be thinking about what Project 2025 plans to do with Dept of Commerce (Census, BEA, and BLS data etc.) as the extreme, controlling elements seek to avoid accountability (and accuracy) by eliminating/downsizing qualified staff and consolidating control under centralized sharpie holders and “like minded” staff (see Payroll June 2024: The Race Gets Confusing 7-5-24). Maybe JOLTS will disappear in 2025 since job openings are higher than Trump’s highest even after the sharp decline from the 12.2 million peak level.
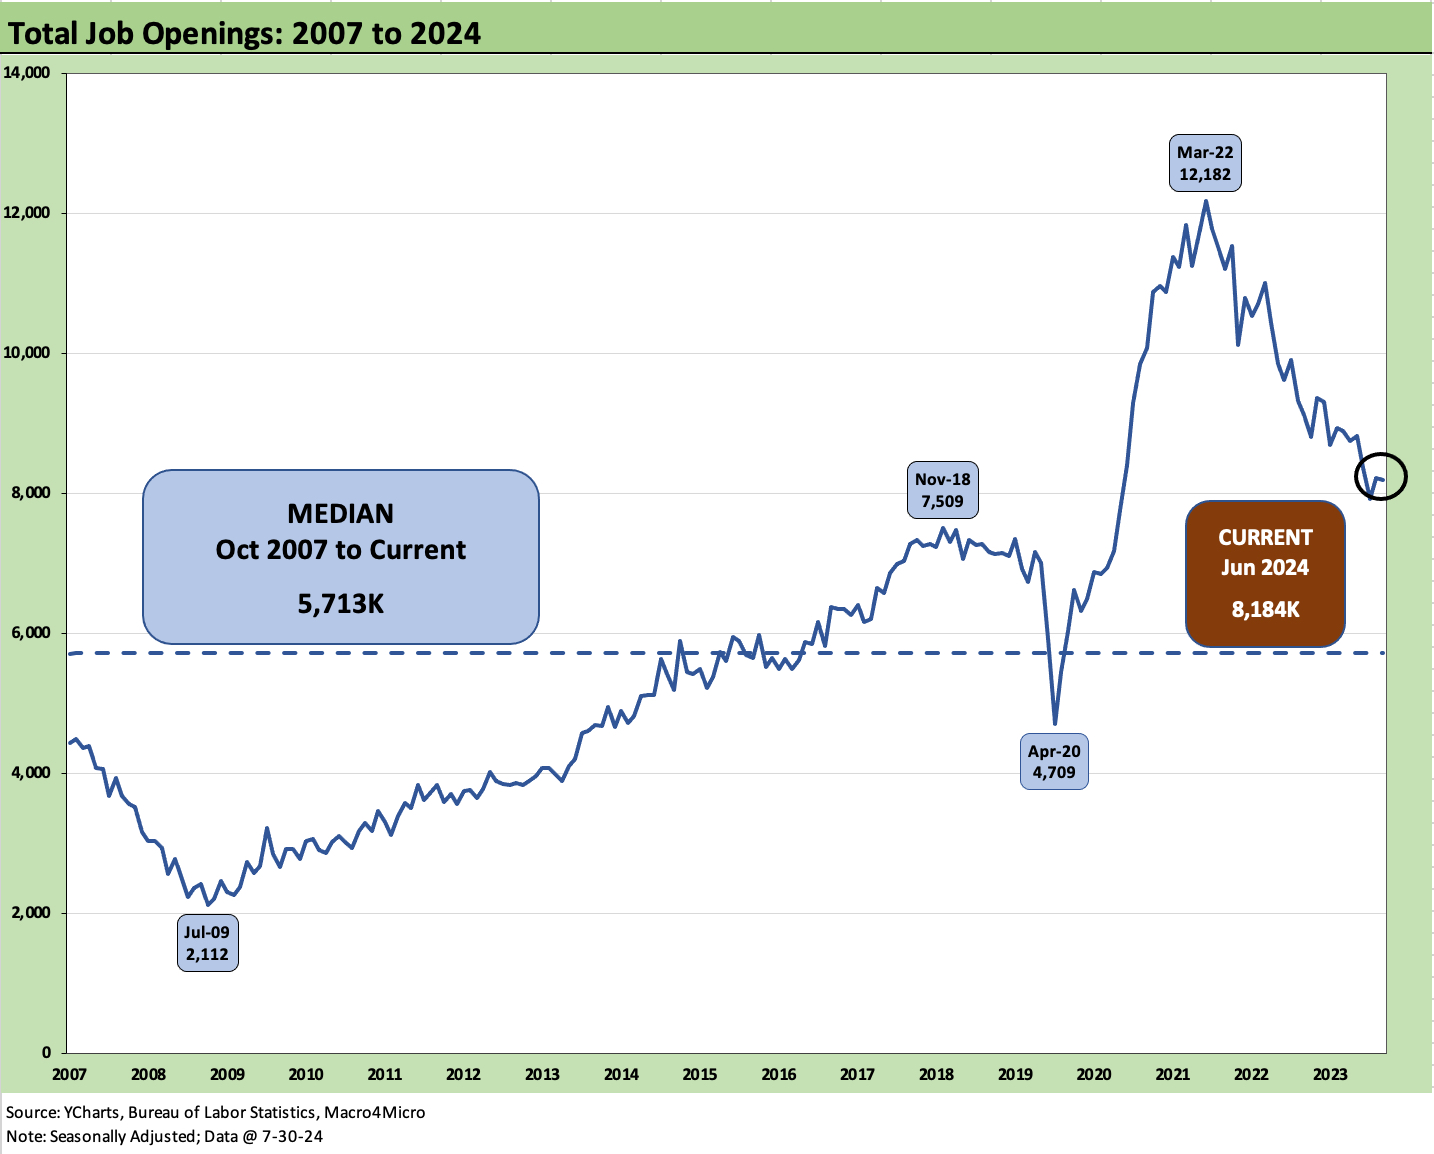
The above chart updates the running Job Openings data, which comes with a 1-month lag. The 8.2 million is an impressively stable number considering the debates around the direction of the economy. The peak of 12.2 million was reached in April 2022 just as ZIRP was ending and the tightening cycle was underway. The decline in job openings over time makes sense since jobs do get filled as people get hired.
That hiring process flows into the payroll number each month when those numbers get reported. We will get those on Friday. We update the occupational deltas also each month. Last month the payroll numbers were solid (see Payroll June 2024: The Race Gets Confusing 7-5-24, JOLTS May 2024: The Jobs Oasis Still Has Water 7-2-24).
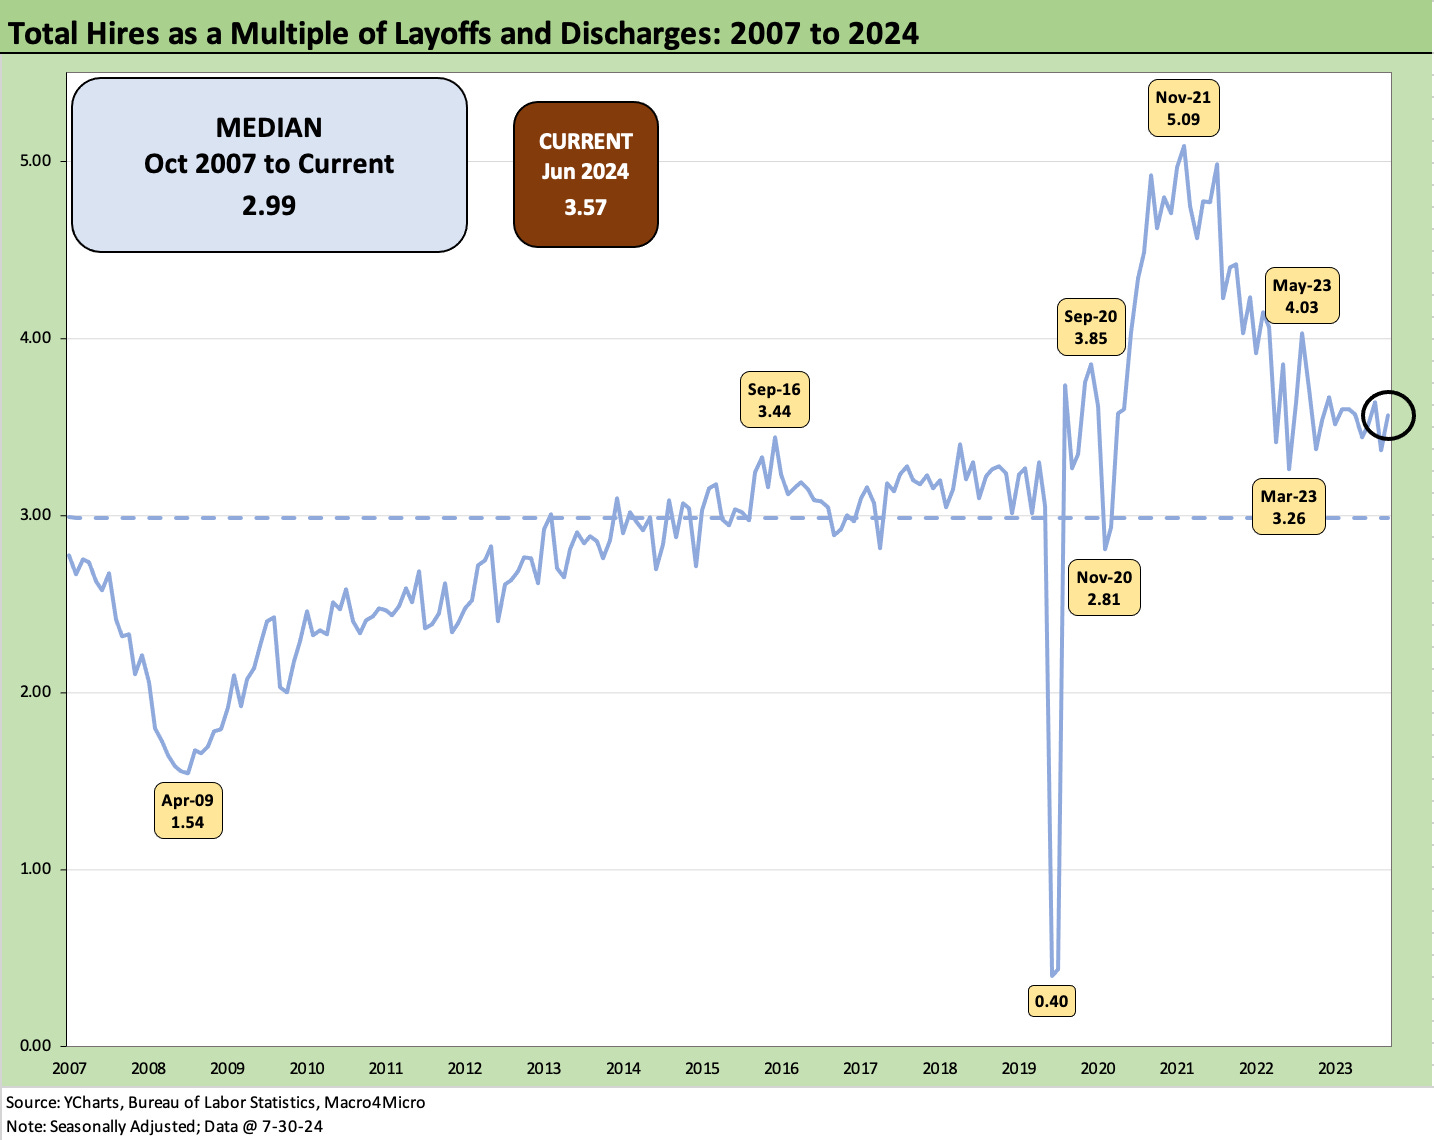
The above chart updates the ratio of Hires to Layoffs/Discharges. That ratio remains quite healthy at almost 3.6x.
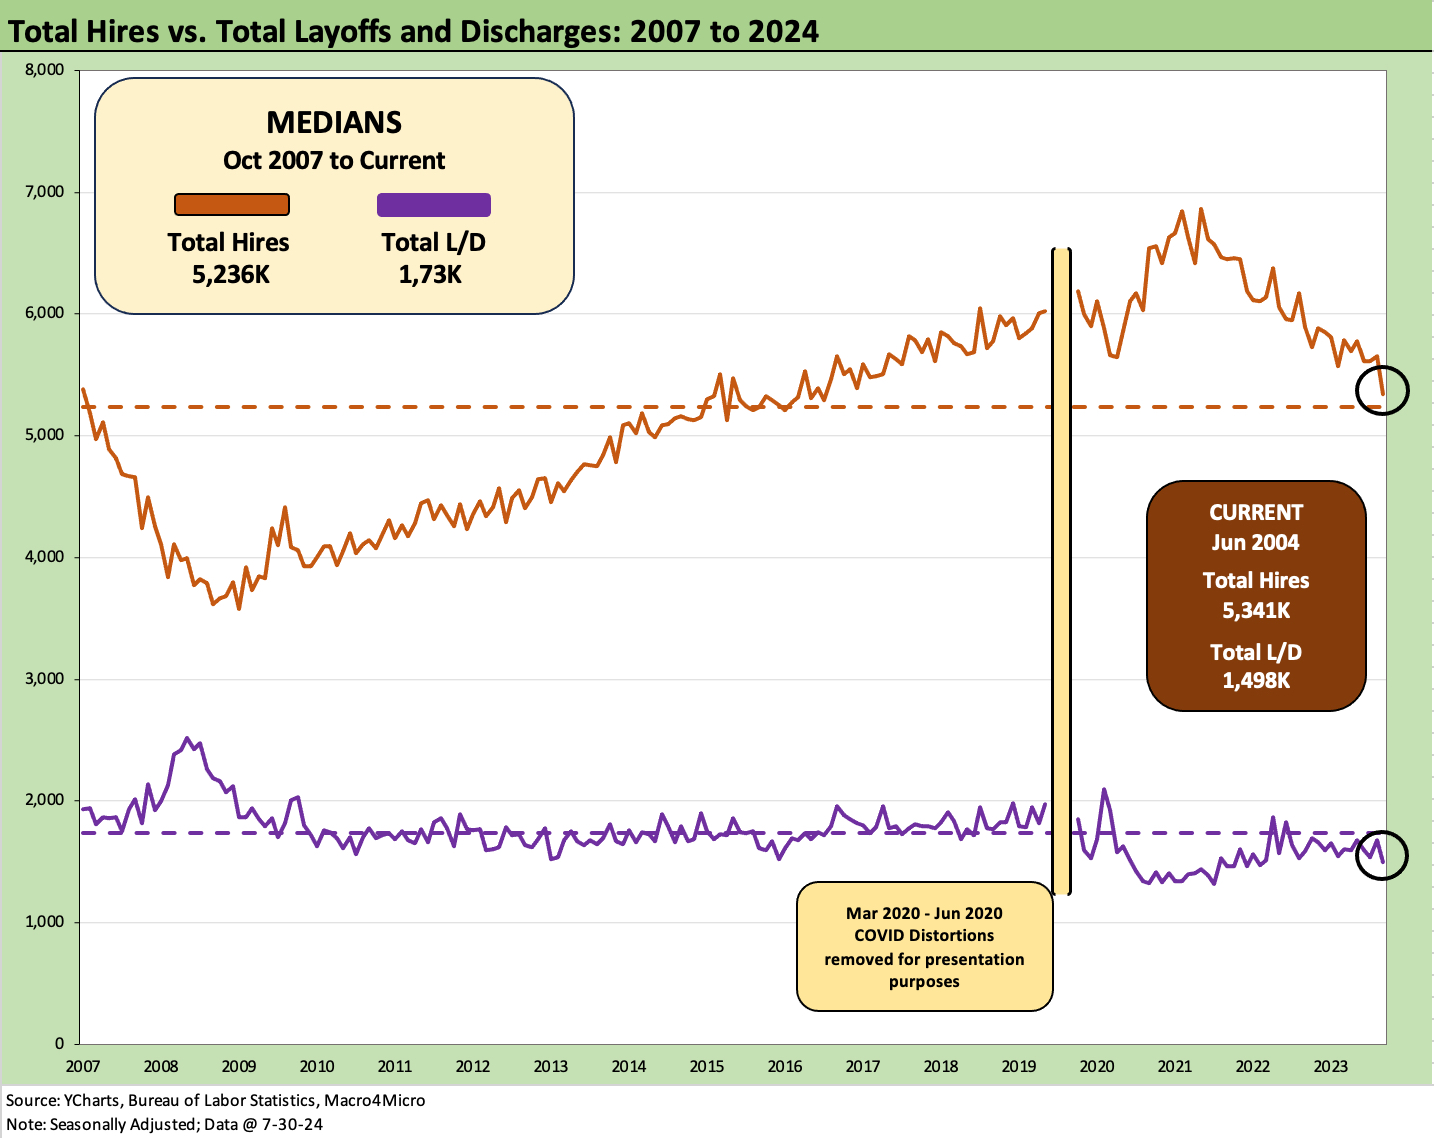
The above chart updates the time series for Hires vs. Layoffs/Discharges. Hires of 5.3 million and Layoffs/Discharges of almost 1.5 million offer a very healthy cushion. We reduce the distortion in this chart above by removing the COVID numbers. Current Hires are well above the long-term median. We frame those COVID dislocations in a boxed commentary further below.

The above chart plots the total numbers of Hires vs Separations (Quits, Layoffs/Discharges, Other). The 5.3 million in hires and 5.1 million in separations were “little changed” (a recurring phrase in the release with “unchanged” and “changed little”). For the chart above, we remove the COVID disruptions and detail those in the text box below. Both Hires and Separations are above the long-term medians cited in the chart.
By the letter of the definitions used by the BLS: “Layoffs and discharges are involuntary separations initiated by the employer. Other separations include separations due to retirement, death, disability, and transfers to other locations of the same firm.” “Other” will need a new bucket under the heading of “mass deportation.” Or maybe those will be “involuntary separations from home and residence and possibly family.” Either way, the 2025 period could be one that breaks the mold and will be one for the history books a century from now.

The above text is a replay each month that frames the economic chaos of the COVID period. With almost 28 million in separations across March and April 2020, it is safe to say some economic models don’t make allowances for such inputs in framing how growth, supply, demand, and pricing trends might play out in the following periods. Some want to pretend that such turmoil is not a material factor in ensuing inflation trends.
As we look ahead into 2025, a troubling and unprecedented scenario will be how a mass deportation (17.5 million is the over/under of the 15 to 20 million talking range) flows through into the numbers. We are not sure who is modeling those effects over in that group advocating the deportation action, but you can be sure their analysis would not hold up to public scrutiny by economists and policy experts.
The mass deportation advocates will underestimate the cost to execute and the economic fallout to follow. They will grossly overestimate the efficiency and pretend the blowback in investment and consumption will not take a material toll. They can do whatever they want after they get the mantle, so they will stall on details (or refuse to provide the data) and continue their lack of analysis in the meantime.
Questions are obvious on the deportation plan…
Will we see a massive number of “separations” under the banner of “other”? How many job openings will that deportation translate into on the other side? Who will fill those jobs? What will become of the employers’ business and the suppliers to those employers?
Common sense does not need an economic model behind it, but we would expect some effort behind a detailed plan and cost estimates. An economic assessment would be in order if you are going to make moves that surpass the peak WWII mobilization.
The job openings will likely fall well short of the catastrophic levels of separations as employers feel the strain of economic disruptions and labor shortages and notably in urban centers that are disproportionately not on Team Trump. That said, the reverberating economic effects will go far beyond those targeted communities.
The concept of multiplier effects is alive and well here. What will happen to the immediate supporting economic infrastructure across the community ecosystem that those businesses serve (and where those freshly incarcerated former employees “formerly lived” before being shipped to the internment centers).
You can bet some “like-minded” (to borrow one of Project 2025’s favorite terms) vendors are secretly positioning for the business ($$$) of incarcerating, housing, moving, feeding, and deporting. There is after all, money in it for someone with ties to “the team.” The Tammany Hall folks were a bunch of pikers compared to this crowd.
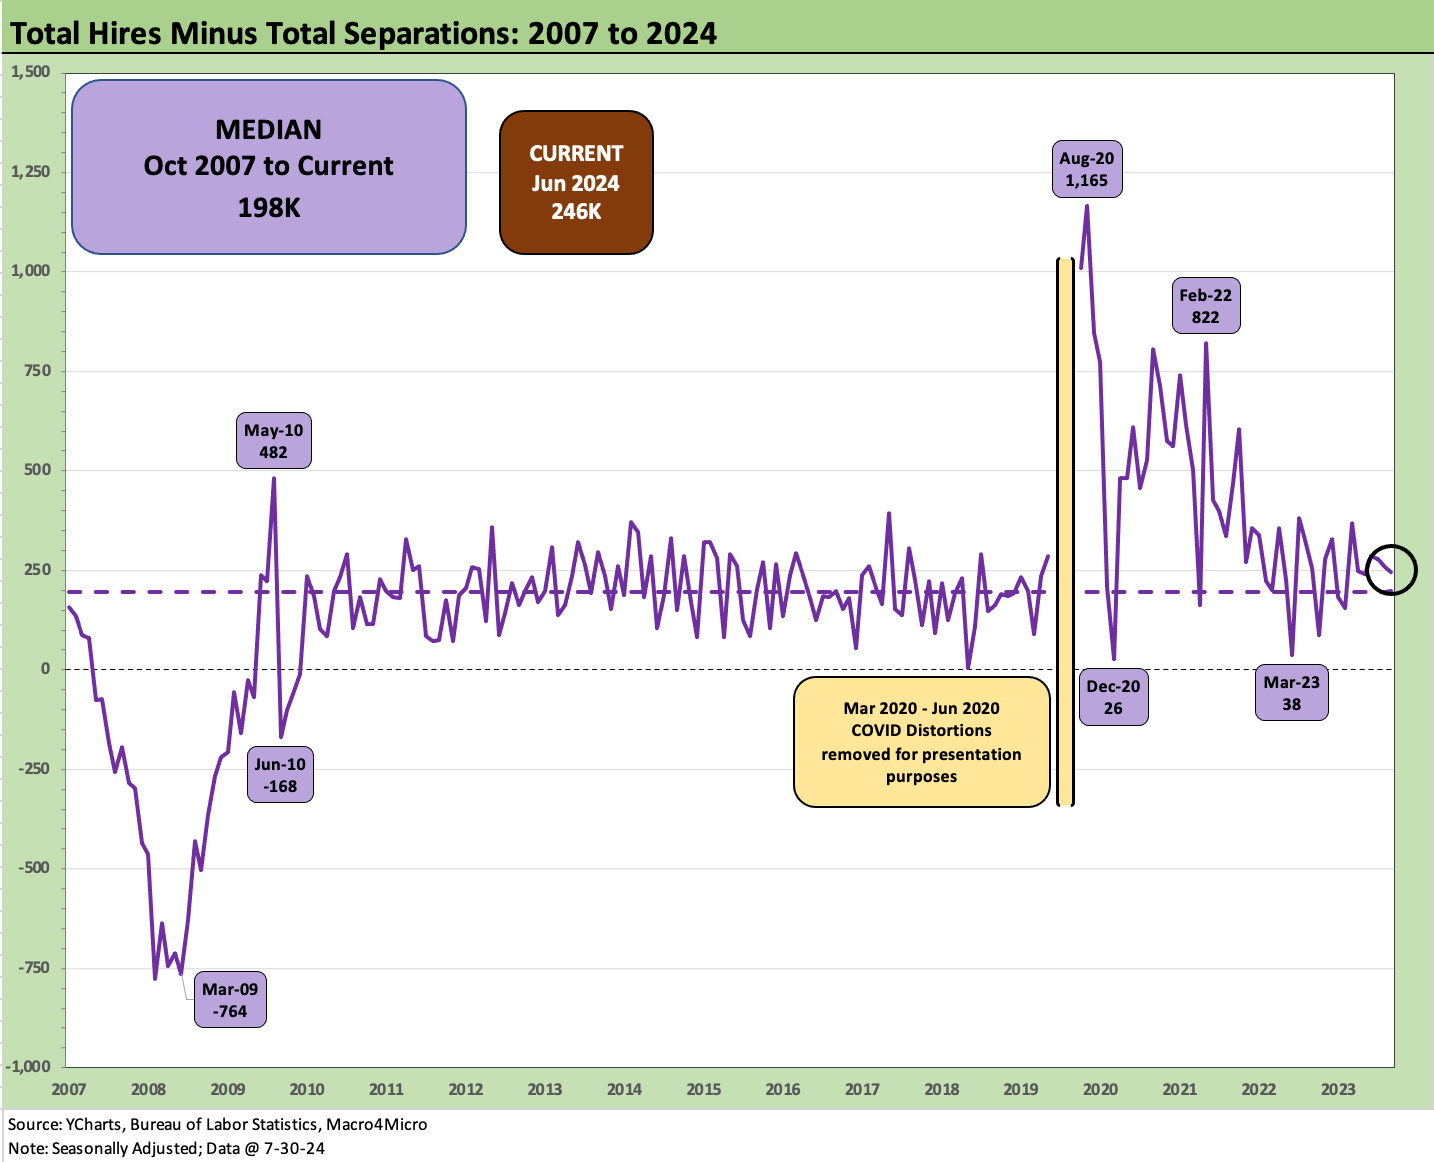
The above chart updates the “Hiring minus Separations” differential time series. The current differential of 246K declined on the month and is down to just over 1.2x the long-term median.
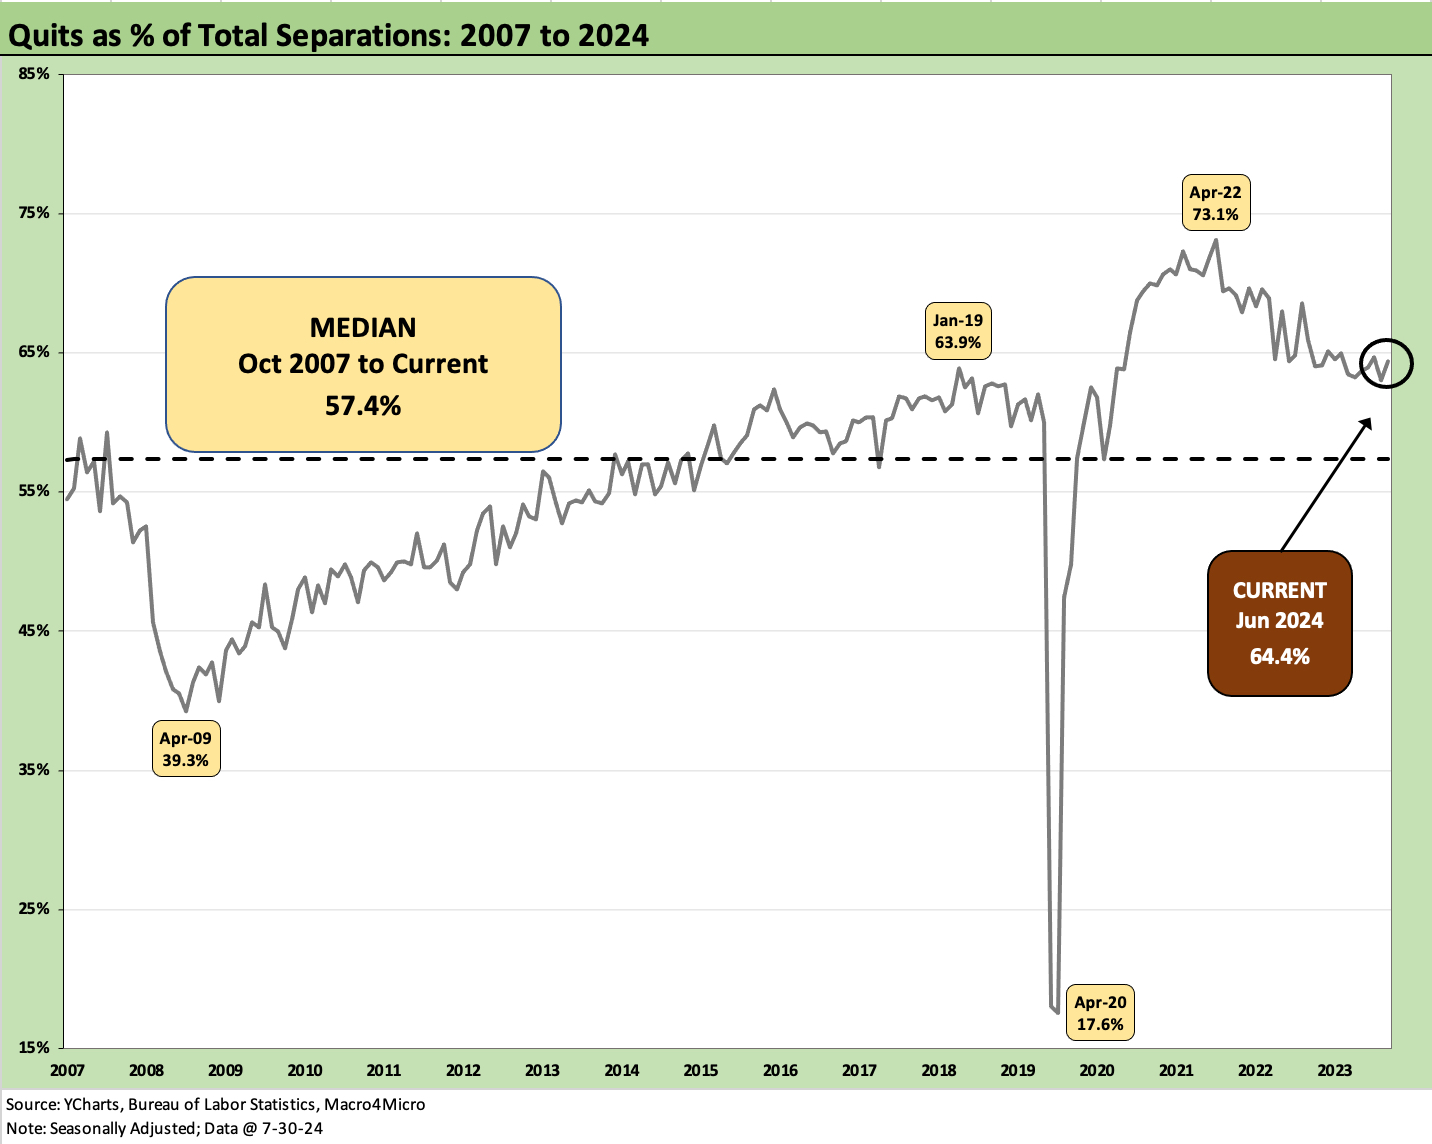
The chart above tracks the Quits share of total Separations which was 64.4% or comfortably above the long-term median of 57.4%.
“Quits” get a lot of attention for what it theoretically reflects about confidence (as opposed to disgust and disdain). The “Quits Rate” (Quits as a % Total Employment) on a SAAR basis continues to move sideways. After the revisions for May get factored in, the sequential Quit Rates (SAAR) were flat at 2.1% with the Quits total slightly lower at 3.3 million. Quits data did not add much story value at all.
See also:
Footnotes & Flashbacks: Credit Markets 7-29-24
Footnotes & Flashbacks: State of Yields 7-28-24
Footnotes & Flashbacks: Asset Returns 7-28-22
Presidential GDP Dance Off: Clinton vs. Trump 7-27-24
Presidential GDP Dance Off: Reagan vs. Trump 7-27-24
PCE June 2024: Inflation, Income, and Outlays 7-26-24
2Q24 GDP: Into the Investment Weeds 7-25-24
GDP 2Q24: Banking a Strong Quarter for Election Season 7-25-24
Footnotes & Flashbacks: Credit Markets 7-22-24
Footnotes & Flashbacks: State of Yields 7-21-24
Footnotes & Flashbacks: Asset Returns 7-20-24
Industrial Production June 2024: Is the Sector Rotation Alive? 7-17-24
Housing Starts June 2024: Still All About the Deliveries 7-17-24
Retail Sales: Second Wind 7-16-24
Footnotes & Flashbacks: Credit Markets 7-15-24
Consumer Sentiment: Still Feeling the Heat 7-12-24
Homebuilder Equities: “Morning After” on Rate Optimism 7-12-24
Homebuilders: Equity Performance and Size Rankings 7-11-24
CPI June 2024: Good News is Good News 7-11-24
Footnotes & Flashbacks: Credit Markets 7-8-24
The B vs. CCC Battle: Tough Neighborhood, Rough Players 7-7-24