
Footnotes & Flashbacks: Asset Returns 8-4-24
A wild week saw bond ETFs lead the top quartile while small caps, midcaps, tech, and regional banks took notable beatings.


Everyone has a plan until…
A very nervous market looking at high valuations and tight spreads took a payroll number and let extrapolation run amok at a time when most have not been factoring in the policy risks, legislative chaos, and geopolitical strife that could unfold in 2025.
The potential for multiple eases before year end and at least 25 bps in Sept (odds even rising in markets for 50 bps) is set against another record payroll count, high job openings, and a good GDP print for 2Q24 as the forward-looking intensity seems to have election day as the end date for time horizon discounting.
That conflicting mix of factors could make for another volatile week when the transmission mechanism to economic contraction requires more bearish outcomes and not a mild erosion of current fundamentals in a reasonable (not great) earnings season.
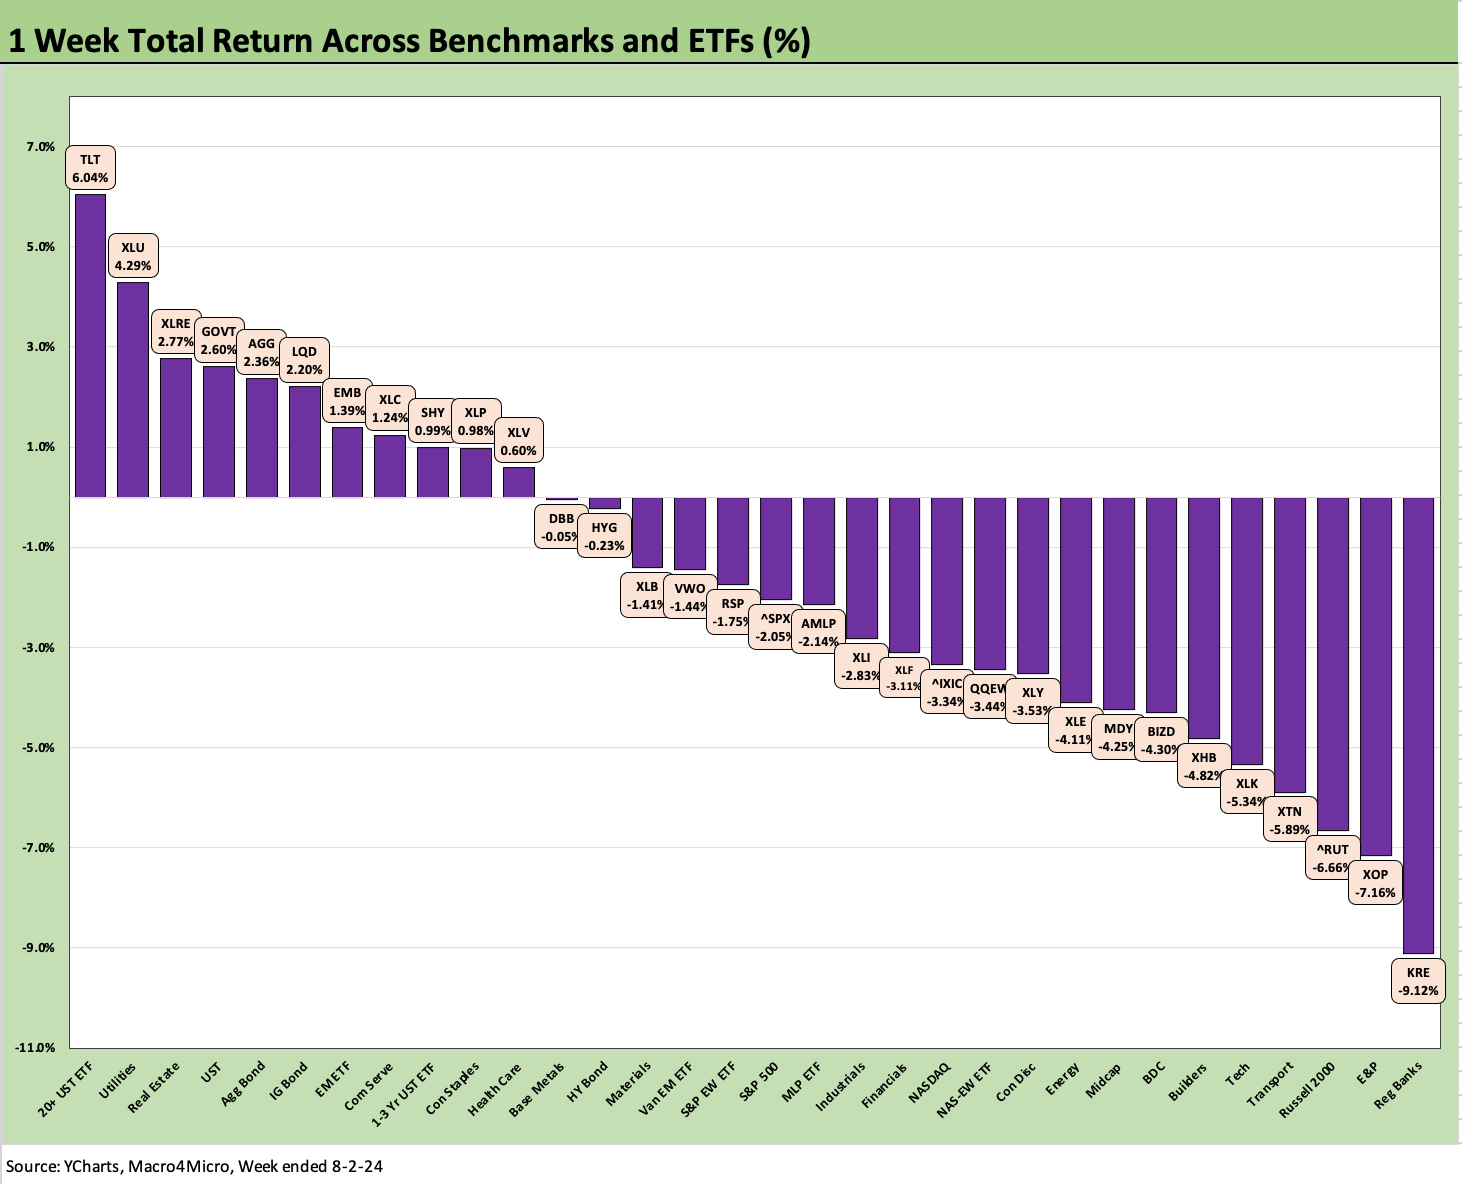
Bond ETFs made up over half the top quartile returns in our group of 32 benchmarks and ETFs this week as Small Caps and Midcaps hit the bottom quartile with Regional Banks and Tech.
The long duration 20+ Year ETF (TLT) held down the #1 spot on the week and moved to #5 for 1-month while remaining in the bottom 3 over the LTM period.
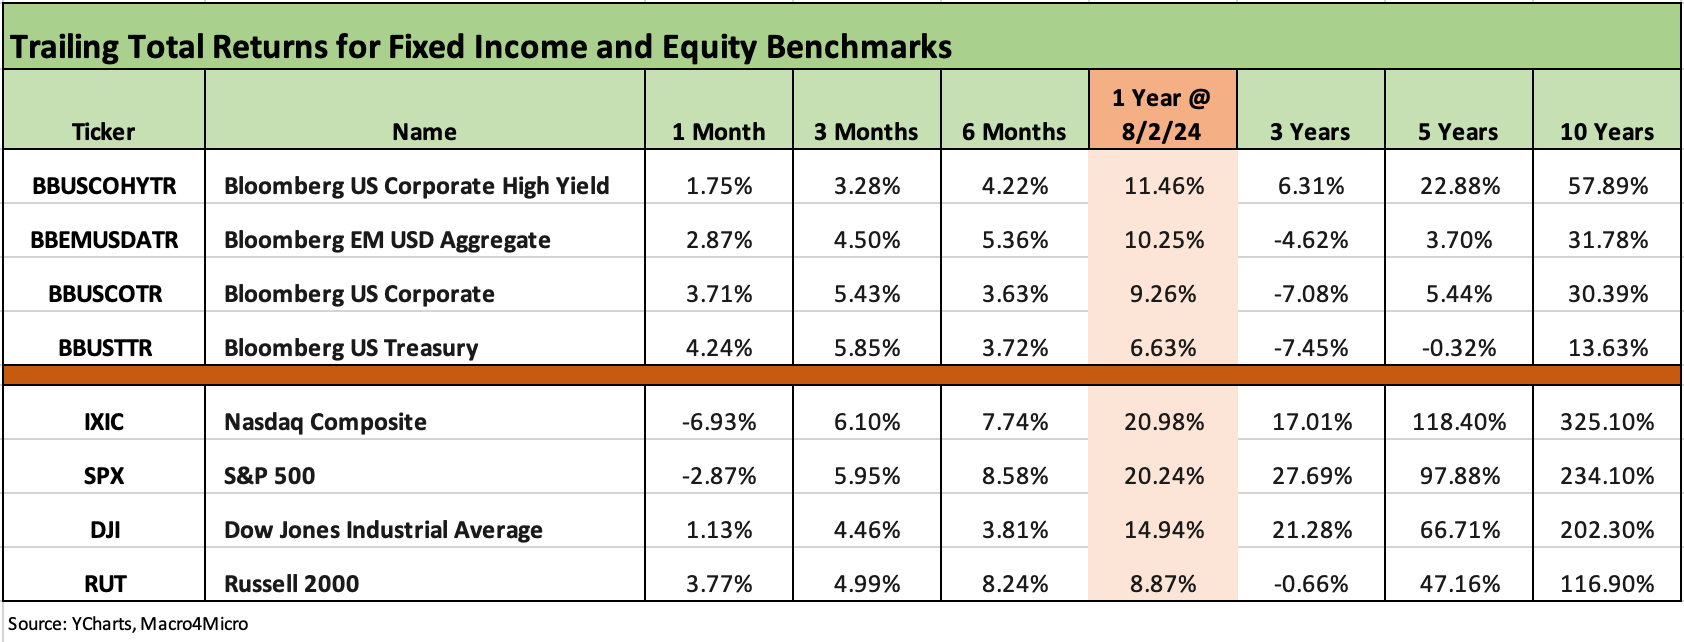
The above updates the running time horizon returns for the debt and equity benchmarks we watch each week. We get into more of the lines in the benchmarks and ETF section further below, but the immediate takeaway is UST at +4.2% which has been the best performer of the lot for the trailing 1-month period across both debt and equity. We see NASDAQ as the worst at -6.9%. The IG Corporate index and the Russell 2000 are a close second for the month with RUT at +3.77% and IG bonds in the mix at +3.71%.
Looking back 3 months, the NASDAQ is still on top just ahead of the S&P 500, but UST and IG Corporates are modestly below. Large cap equities have had a bad month, but the small cap performance is having trouble with the sector rotation follow-through after the brief bout of excitement.
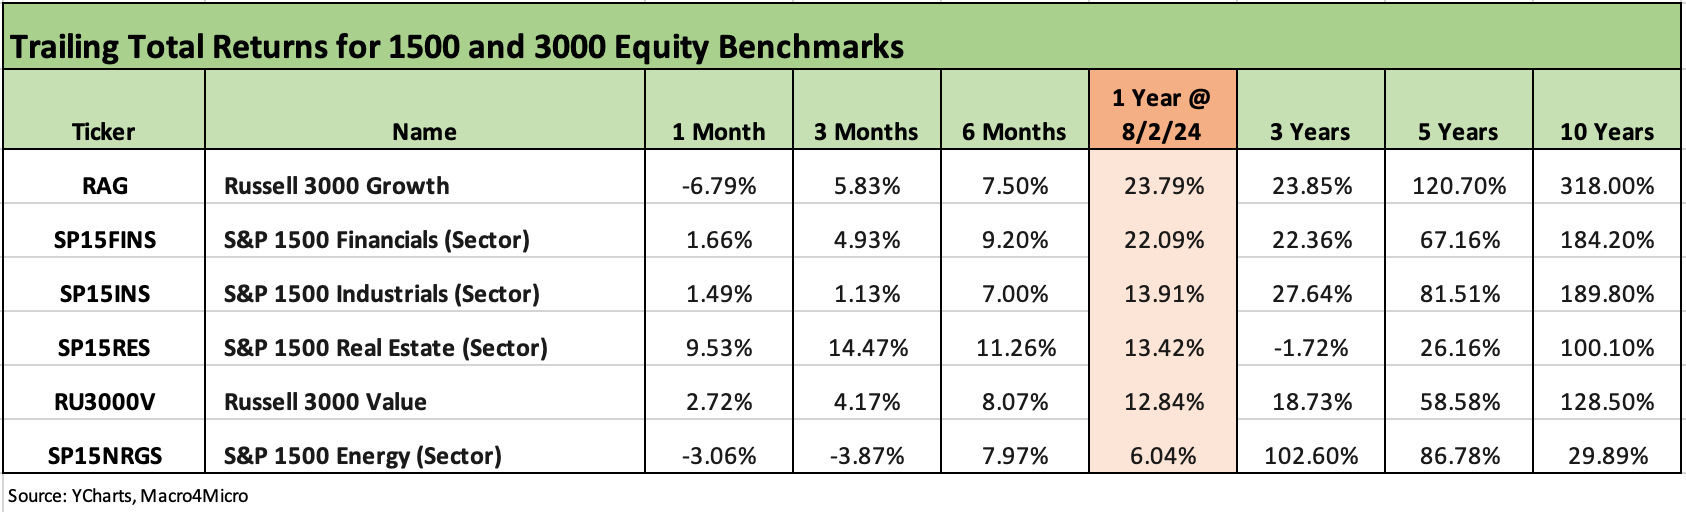
The above chart updates the 1500 and 3000 series, and the pain in the Russell 3000 Growth group is very much in evidence as is the strength of the interest-rate sensitive Real Estate sector. For those who dropped a slice of retirement savings into REITs back in the ZIRP periods, some real estate subsector securities are seeing some relief even if not back into the black over the 3 years from the ZIRP timeline from the Spring of 2020 with FOMC relief and then across 2021 and into early 2022. More UST curve help will be needed to make such income securities compelling if recession probability stays high on the scenario list for some handicappers.
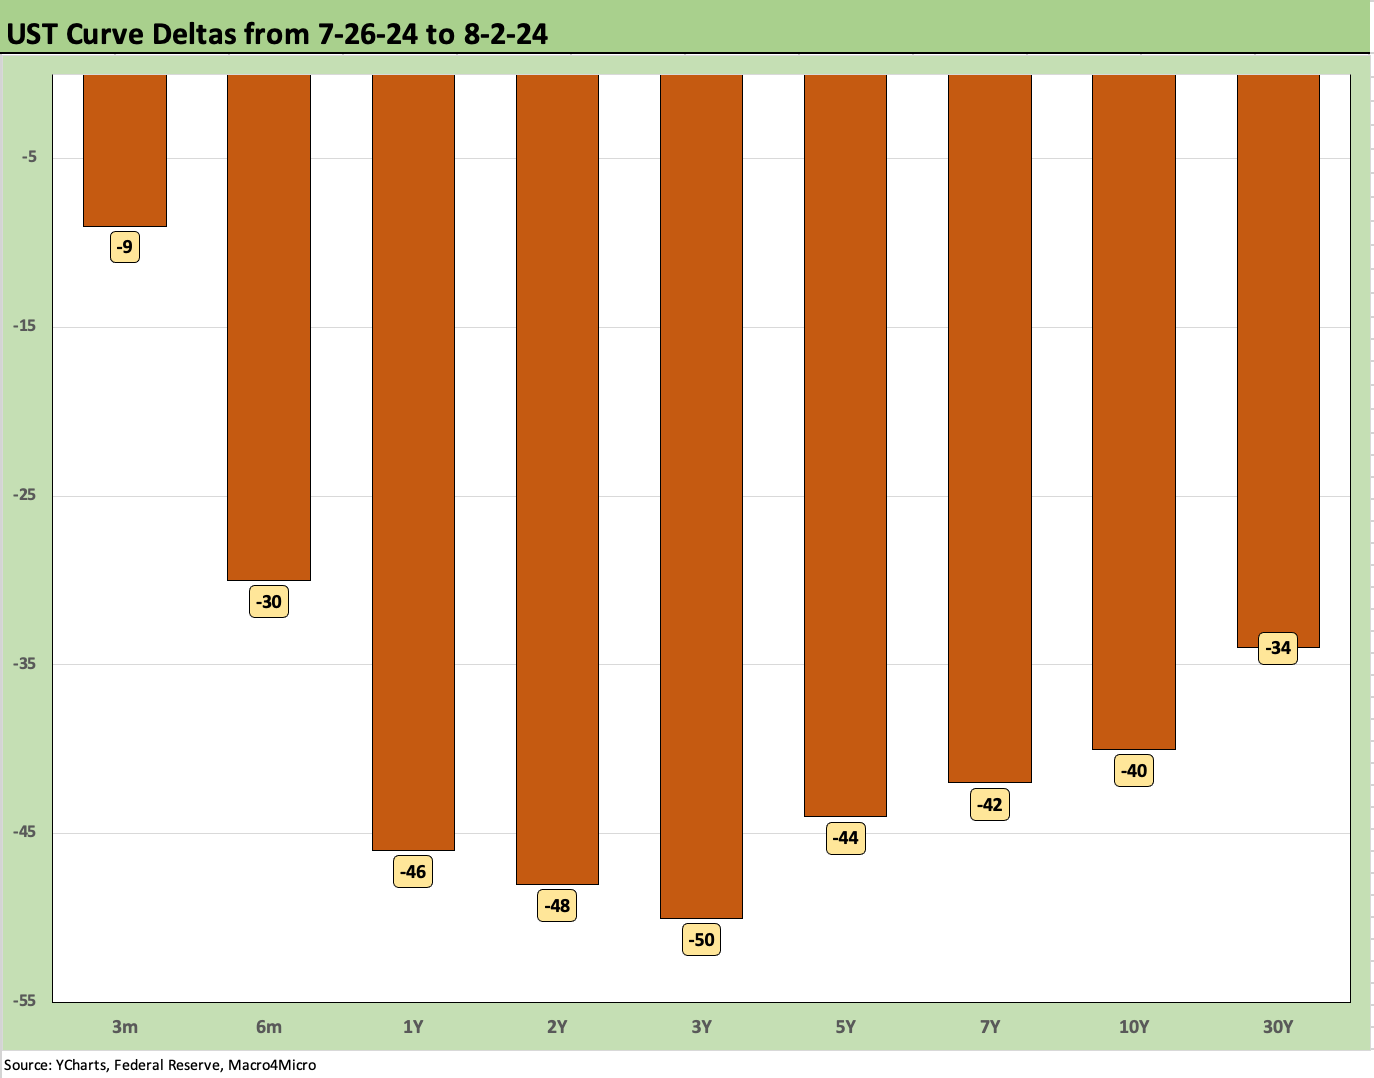
The above chart frames the 1-week UST deltas, and these are the kind of short term moves you don’t see very often across the cycles and especially with so much taking place in 1 day. We usually only include this chart in our Footnotes publication on yields, but it is worth flagging here as well given how well bond ETFs did vs. equities this past week. We will publish the “Footnotes” State of Yields weekly later today.
The rolling return visual…
In the next section we get into the details of the 32 ETFs and benchmarks for the usual trailing periods. Below we offer a condensed 4-chart view for an easy visual before we break out each time period in the commentary further below. This is a useful exercise we do each week looking for signals across industry groups and asset classes.
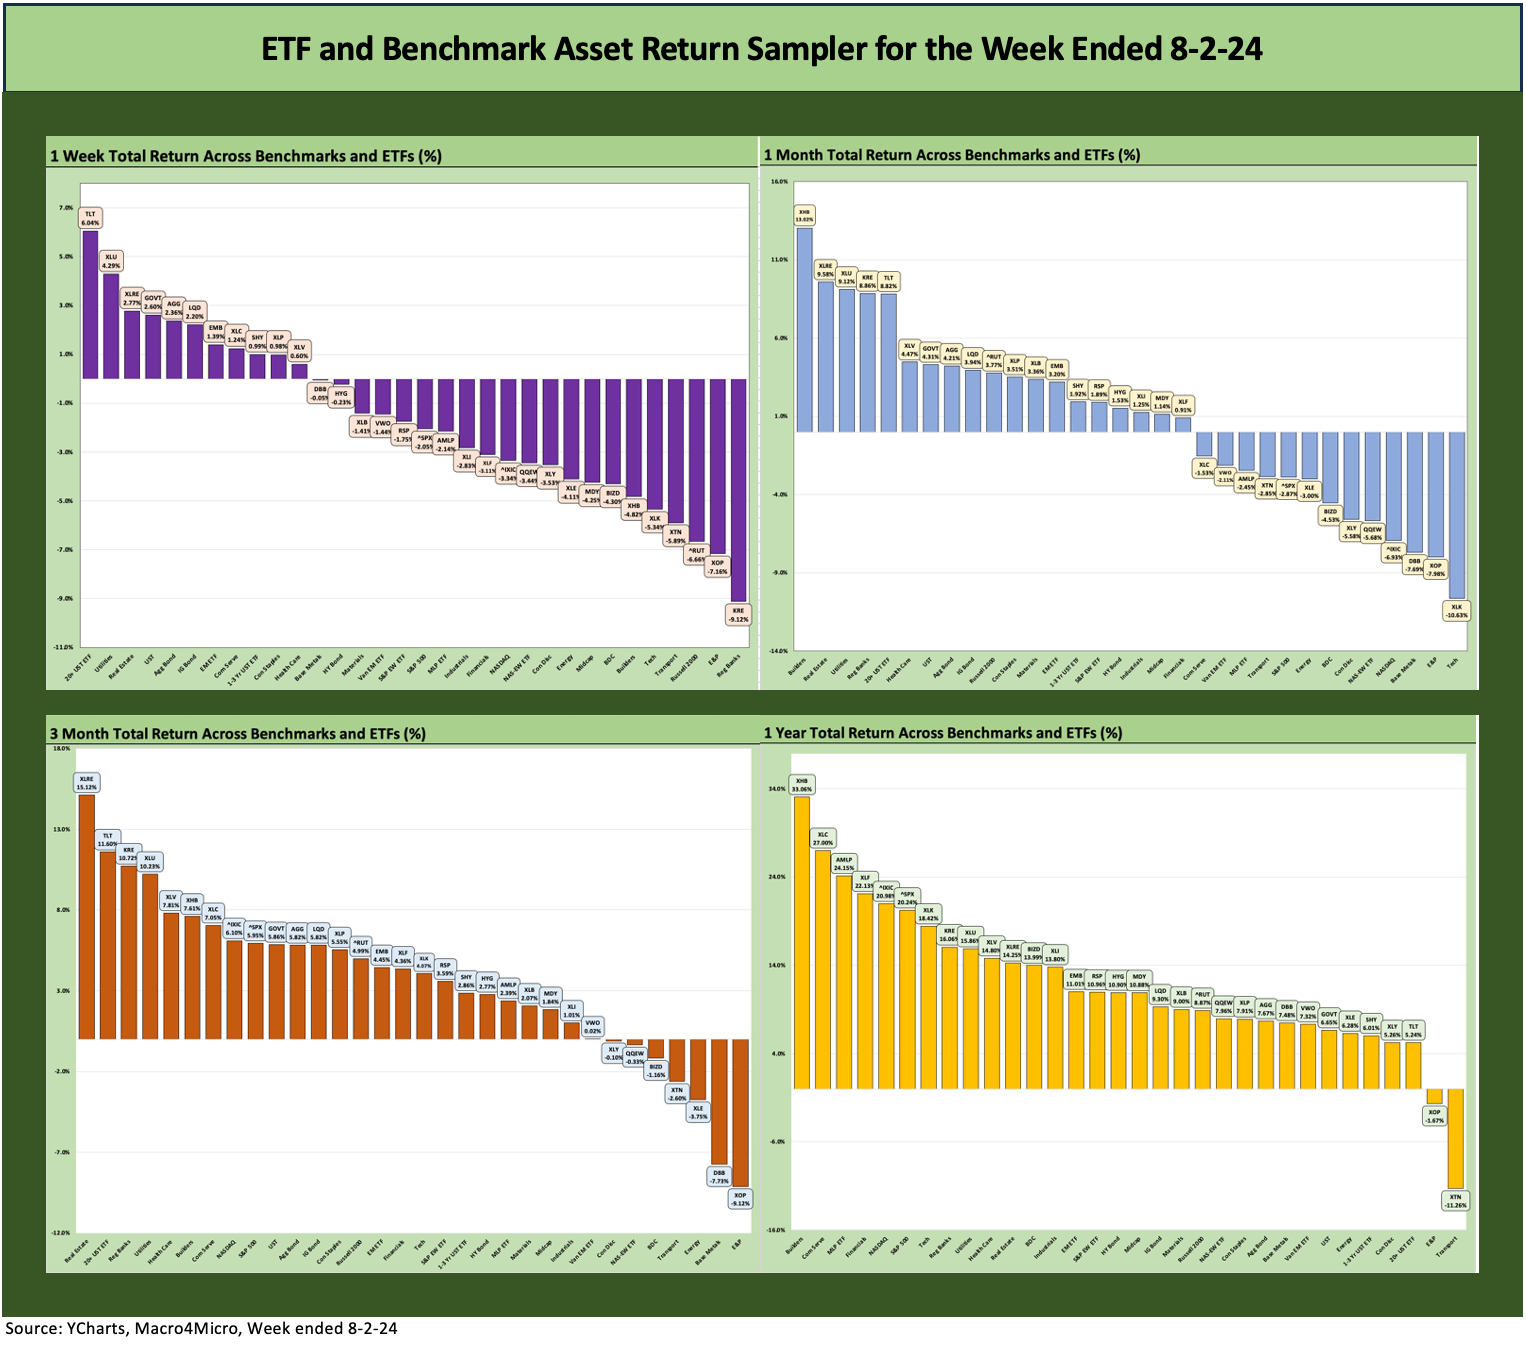
The above chart is less about the shapeshifting this week and more about the mix with bond ETFs having their day/week. It is also more about the magnitude of the negatives and how that rolls up into some questions on asset allocation and notably on relative duration exposure and credit quality mix in bonds.
In bonds, we are still sticking with our orientation toward IG even after the repricing since the biggest cyclical challenges by far remain ahead in 2025 around tariffs, mass deportations, and geopolitics that will create some attractively repriced opportunities down the food chain. That of course turns on the election and mapping the White House winner against the House and Senate outcomes. We also will be seeing more coupon repricing as the HY and medium grade bonds of the ZIRP years come up for refi and extension.
The tech beatdown in equities is a theme this past week and the backpedal on financials as more an instinctual move on macro recession scenarios than something that can be traced to the major banks’ and asset managers’ current numbers.
The earnings season is ongoing and is mixed by industry as one might expect on guidance. The S&P 500 updates have been solid, but a lot of the action is below the large caps whether it be in the sector rotation themes in small and midcaps or in specialized sectors such as BDCs (BIZD).
The Magnificent 7 heavy ETFs…
Some of the benchmarks and industry ETFs we include have issuer concentration elements that leave them wagged by a few names. When looking across some of the bellwether industry and subsector ETFs in the rankings, it is good to keep in mind which narrow ETFs (vs. broad market benchmarks) get wagged more by the “Magnificent 7” including Consumer Discretionary (XLY) with Amazon and Tesla, Tech (XLK) with Microsoft, Apple, and NVIDIA, and Communications Services (XLC) with Alphabet and Meta.
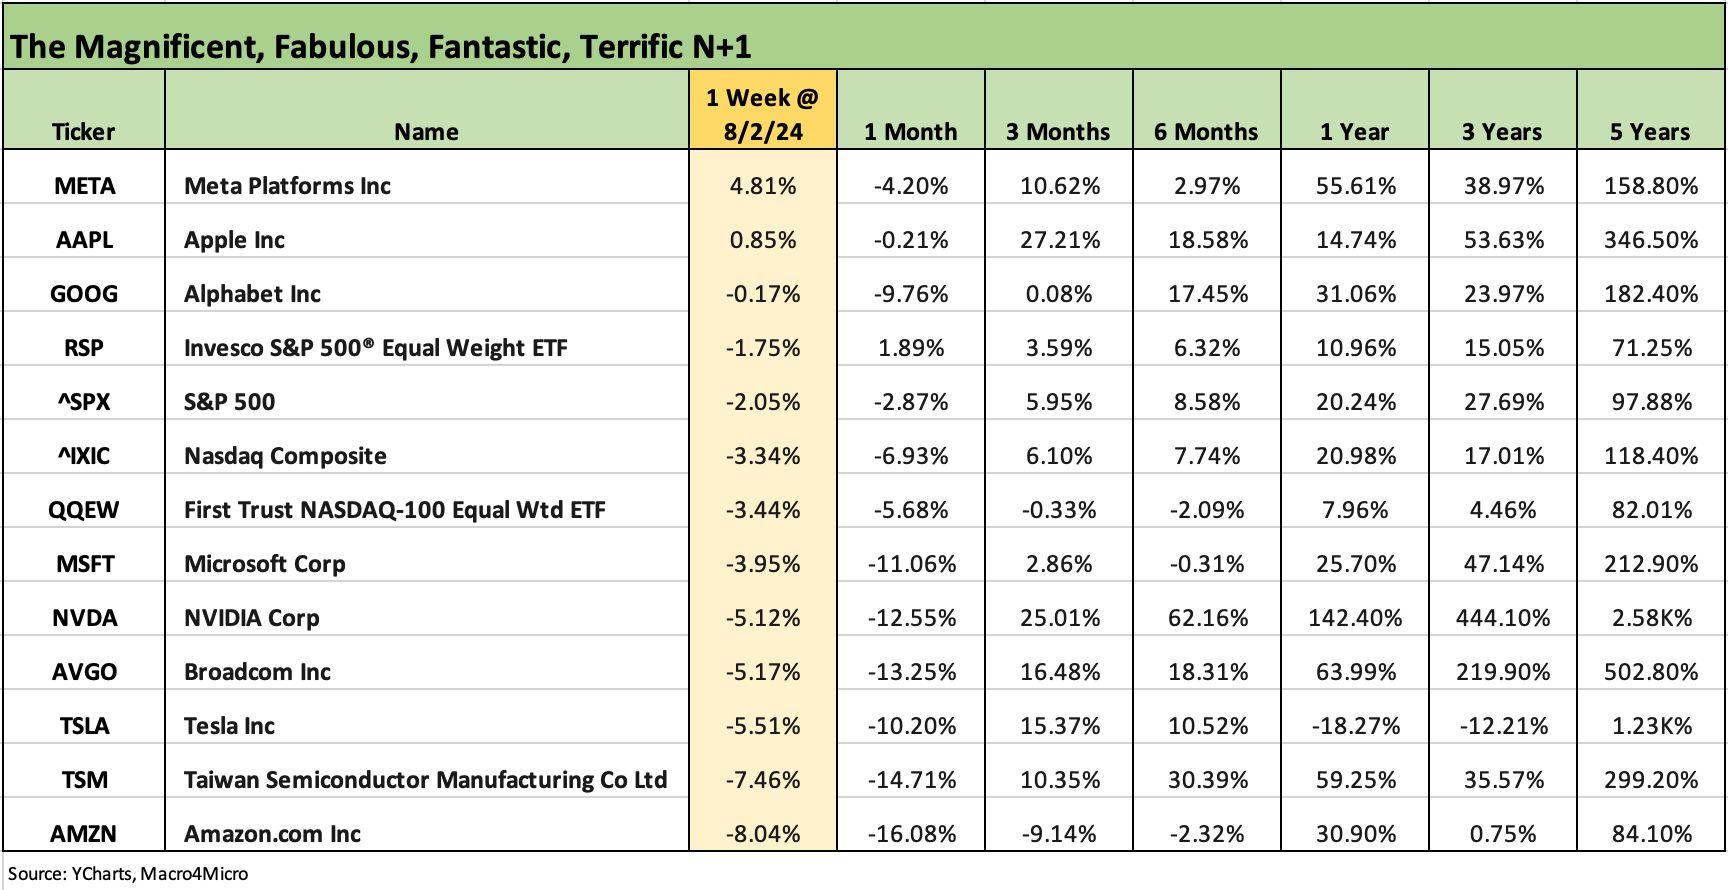
The above chart breaks out another bad week for tech leaders and now a bad month for a range of the Mag 7 and tech bellwethers detailed above. For the week, we see only Meta and Apple in positive range and ahead of the S&P 500 and Equal Weight S&P 500 ETF (RSP), who were both in the negative zone. For the week, Amazon is sitting on the bottom at -8.0% just behind Taiwan Semi and Tesla.
Looking back across the month, all these Tech names are in the red with 4 of the Mag 6 (AMZN, TSLA, NVDA, MSFT) in double-digit negative range and Alphabet just missing (-9.8%). Looking back 3 months, Amazon is the only Mag 7 in negative range (-9.1%) but Alphabet was barely positive (+.08%). Apple is just ahead of NVIDIA over the trailing 3 months for the lead. Unsurprisingly, NVIDIA crushed the peer group over the trailing year.
The sort of week captured in the benchmark and ETF returns above does not come along often in a cycle and especially just on the back of one jobs report that was over 100K in adds and not even the lowest in 2024 (see Payroll July 2024: Ready, Set, Don’t Panic 8-2-24). The ISM numbers were bad, but they have been bad for some time.
The payroll numbers come on the heels of a good 2Q24 GDP report (see GDP 2Q24: Banking a Strong Quarter for Election Season 7-25-24, 2Q24 GDP: Into the Investment Weeds 7-25-24) and a JOLTS report with openings higher than anything seen in Trump’s single term at his Nov 2018 peak number (see JOLTS June 2024: Countdown to FOMC, Ticking Clock to Mass Deportation 7-30-24).
Bonds clearly felt the UST curve shift benefits. We see the long duration 20+ Year UST ETF (TLT) sitting at #1 by a healthy increment with 5 of the 7 bond ETFs we track in the top quartile with the short UST 1Y to 3Y ETF (SHY) just missing the top quartile. On the back of the spread widening, we see the HY ETF (HYG) over in a small negative return position as an accrued coupon and UST move was slightly trumped by spread widening.
The sell-off in equities as well as the credit markets could reflect some of the headline anxiety around excessive valuations in tech and understandable doubt on the sustainability of the much-hyped sector rotation themes. The Russell 2000 had a massive Dec 2023 when it posted up returns over 12% for just the month, but then it faded before the recent rally that just got beaten up this week (see Footnotes & Flashbacks: Asset Returns 1-1-24).
HY credit market compression has been a fact of life for a while as we cover in our weekly Footnotes publication on credit markets (see links below and Footnotes & Flashbacks: Credit Markets 7-29-24). The spread differentials along the IG/HY speculative grade divide were very tight across history, and the market was going to be set up for a decompression wave either way as the high stakes of glaring policy differences on the economy get closer to reality. Of course, getting the election certified outside the courts will be an impossibility if Trump loses. The Democrats also could lose and devolve to the Washington GOP level and start denying election outcomes. High valuations with a rational cyclical clock ticking and event risk ahead (domestic political, geopolitical) all made for headwinds that could turn into dangerous gusts at any moment.
From a fundamental standpoint, the mainstream industry trends are stable to mixed in terms of overall credit risk, but justifying tech valuations is still wrapped in the mysteries of forward valuation methodologies and more investors willing to keep chasing the models and the multiples.
The sector rotation trade gets swept up in financial sector risks and credit contraction trends and what a recession would mean for asset quality. As we detail above in the chart, Regional Banks were sitting in last place by a few points on the week while the broad Financials ETF (XLF) was sitting in negative range and near the middle of the third quartile.
In the end, the scoresheet on positive vs. negative of 11 to 21 was less important than the magnitude of the beatdown.
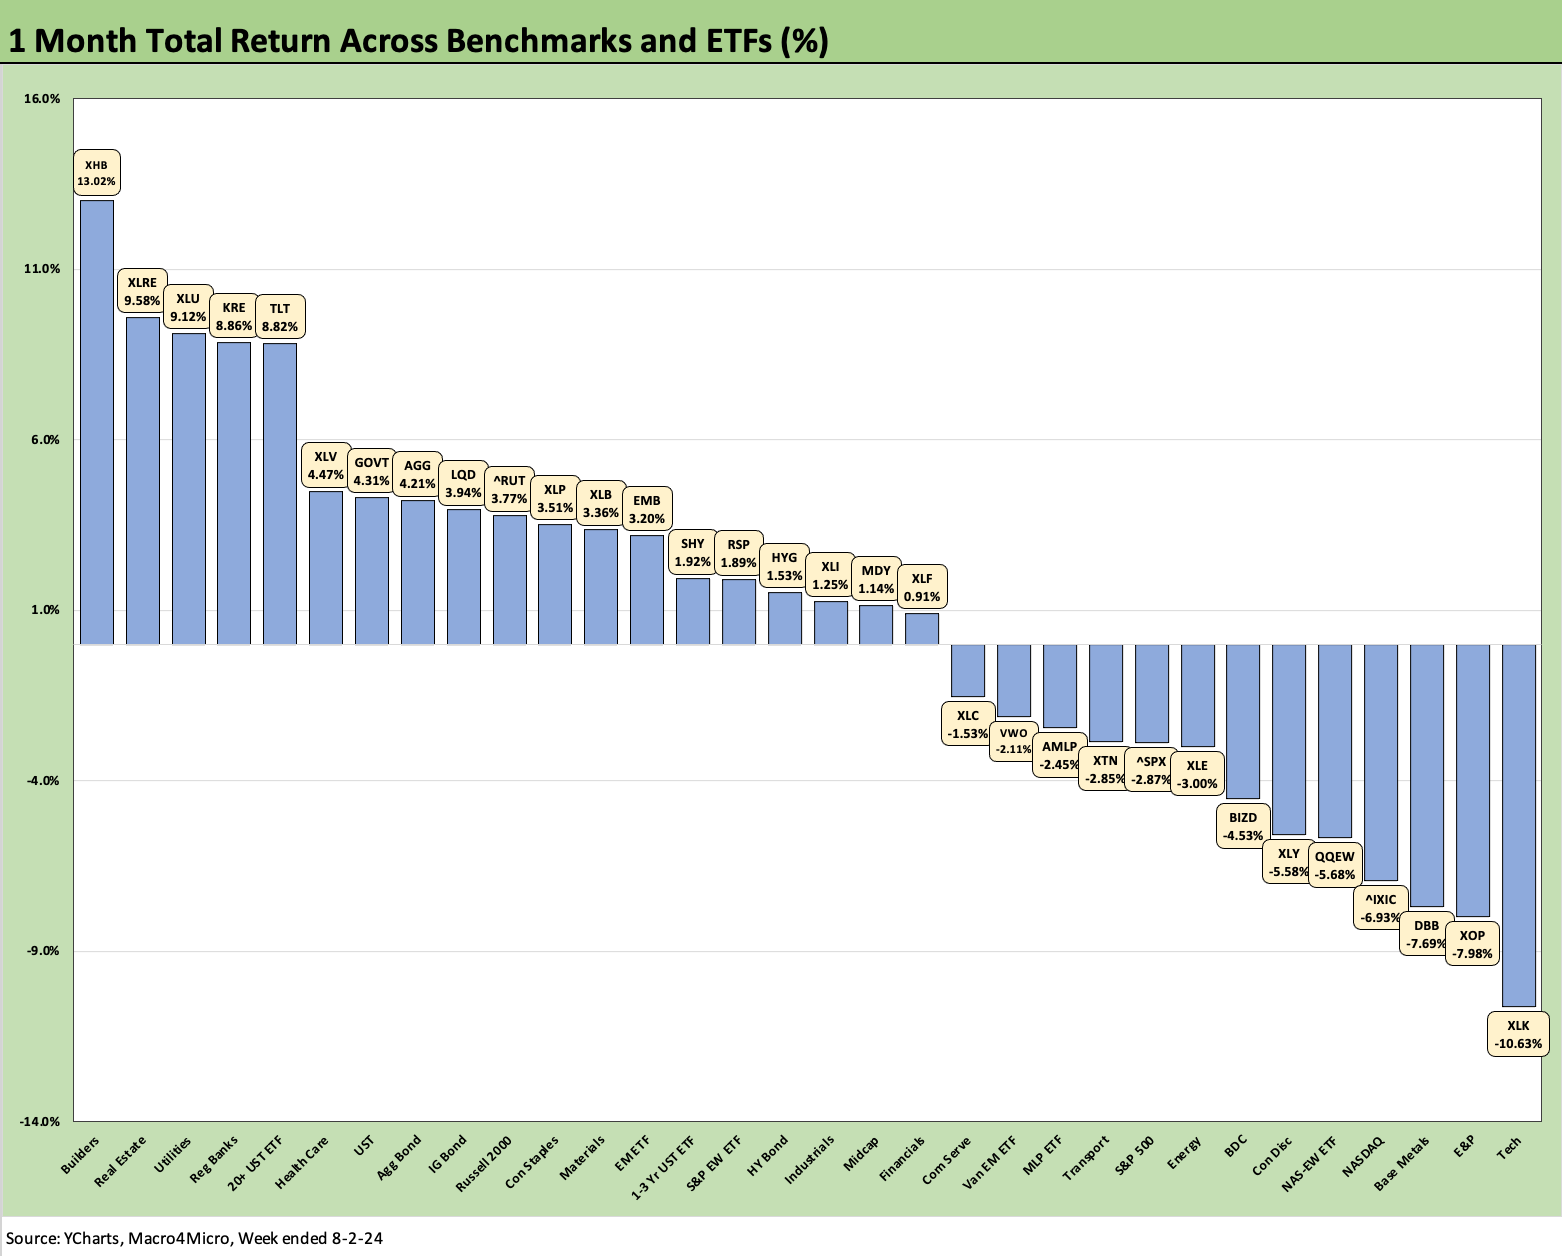
The 1-month time horizon is still in positive range at 19-13 but with the top quartile now featuring 3 bond ETFs with the long duration UST ETF (TLT) at #5. The 7 bond ETFs we track have 3 in the top quartile (TLT, GOVT, AGG) for the trailing month and 4 in the second quartile (LQD, EMB, SHY, HYG). The IG corporate ETF gets to ride the duration rally and less volatile spreads while HYG sees the flip side of lower duration but also the downside of credit risk seeing a material repricing the past week off a very compressed starting point.
The winner for the month is the Homebuilder ETF (XHB) at #1 followed by Real Estate (XLRE) and Utilities (XLU), Regional Banks (KRE), and the long duration UST ETF (TLT). The interest rate sensitive sectors are obviously having some enhanced story value even if just as income stocks in some cases (REITs). Lower rates help the income stock math.
Regional banks were battered during the week as noted above, but that setback the past week was after a monster rally in recent periods that had put KRE routinely near the top of the rankings for 1 month and 3 months (see Footnotes & Flashbacks: Asset Returns 7-28-22).
For the 1-month losers, the Tech ETF (XLK) is sitting on the bottom with the Base Metals ETF (DBB) and Energy (XOP, XLE) in the bottom quartile with the NASDAQ (IXIC) and Equal Weight NASDAQ 100 ETF (QQEW). The Consumer Discretionary ETF (XLY) with Tesla and Amazon reside in the bottom quartile for the month.
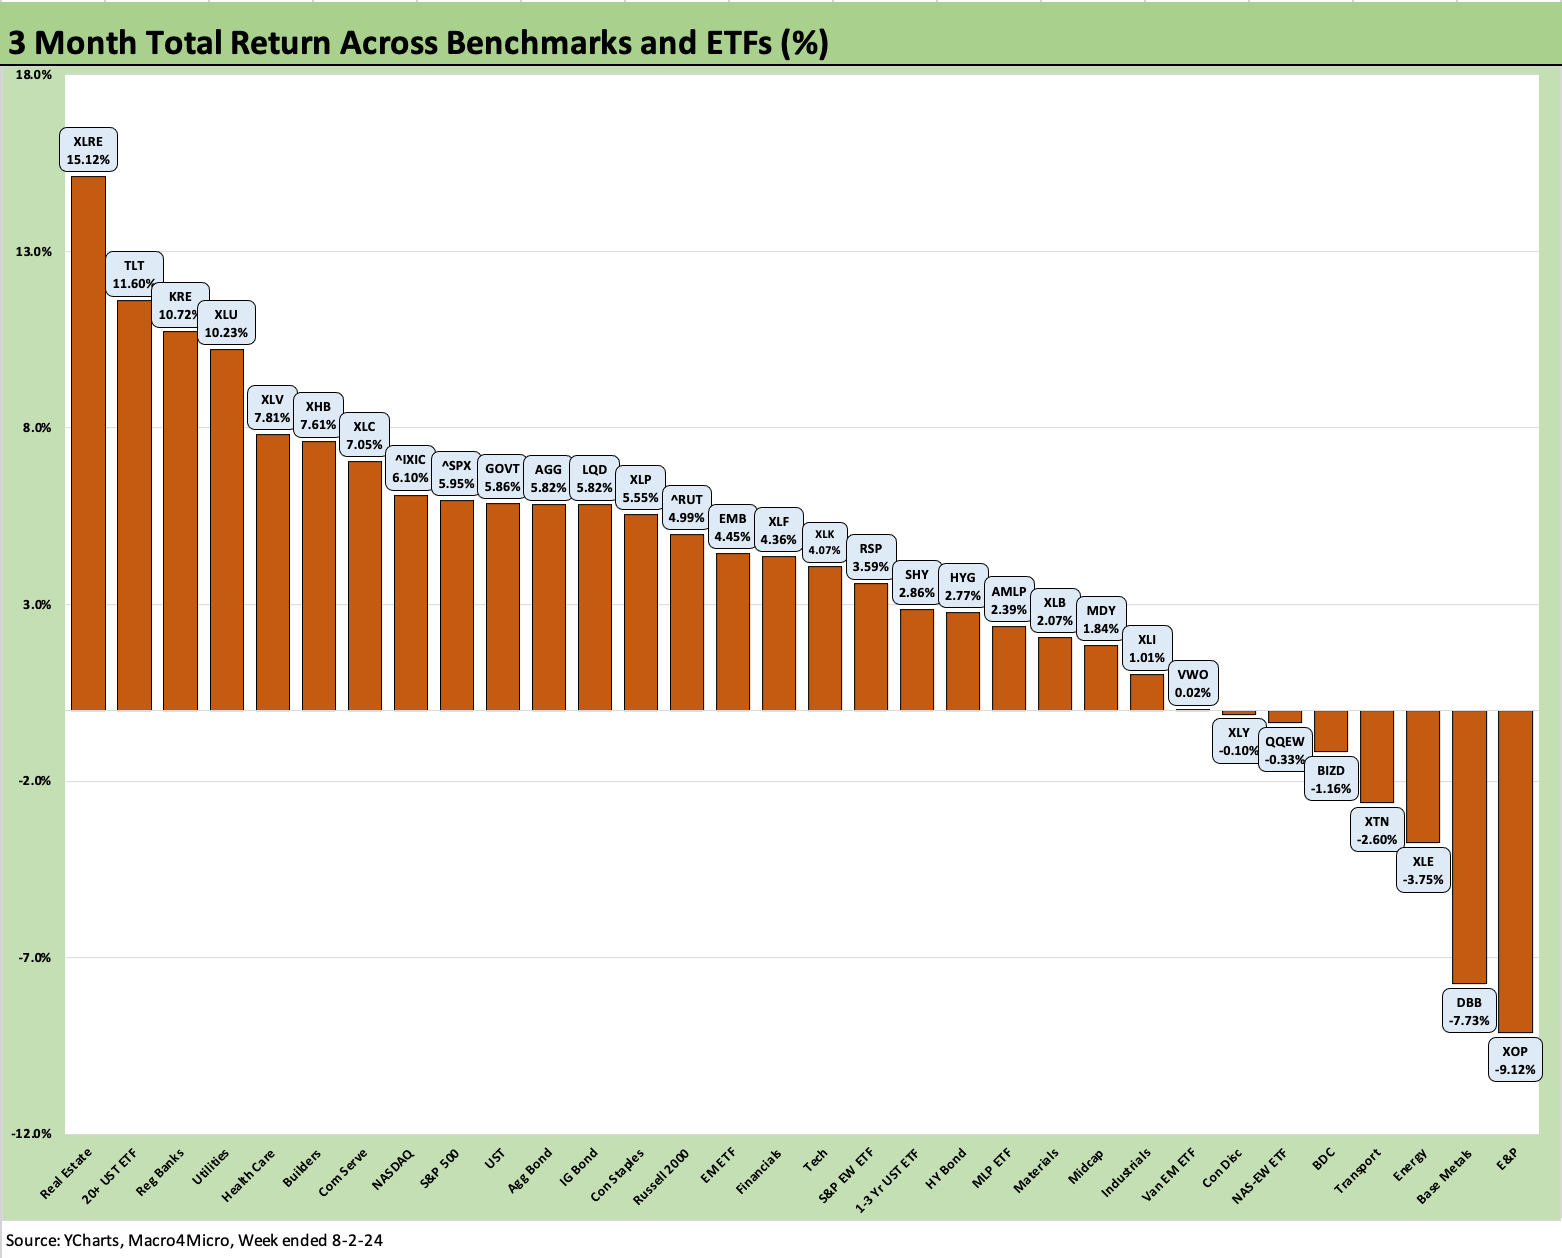
The 3-month time horizon has been at a score of 29-3 the past two weeks, but the little downside of the past week shifted the mix modestly toward negative at 25-7. Last week the only ETFs in the red were two energy ETFs with the broad Energy ETF (XLE) and E&P ETF (XOP) joining Base Metals (DBB). We see those 3 ETFs again sitting on the bottom.
This week’s update for the 3-month timeline adds some of the regular strugglers such as Transports (XTN) but also the BDC ETF (BIZD) as a combination of credit market factors (quality trends for risky credits) and floating rates (easing = lower income) start to get debated. We see the Equal Weight NASDAQ 100 ETF (QQEW) in the bottom quartile for 3 months along with the Consumer Discretionary ETF (XLY) on the back of Tesla and Amazon’s issues.
The BIZD performance had been very strong in 2023 with BIZD in the top quartile for the year. During 1Q24, BIZD dropped down into the upper end of the third quartile for the 3-month period ending in March. For the June 2024 quarter, BIZD was in the top quartile for 3-months at #8. With the private credit markets in a material growth mode and questions on the credit cycle potentially seeing some setbacks ahead, the BDCs will be an important sector to watch for quality issues and lending policies outside the usual Fed data.
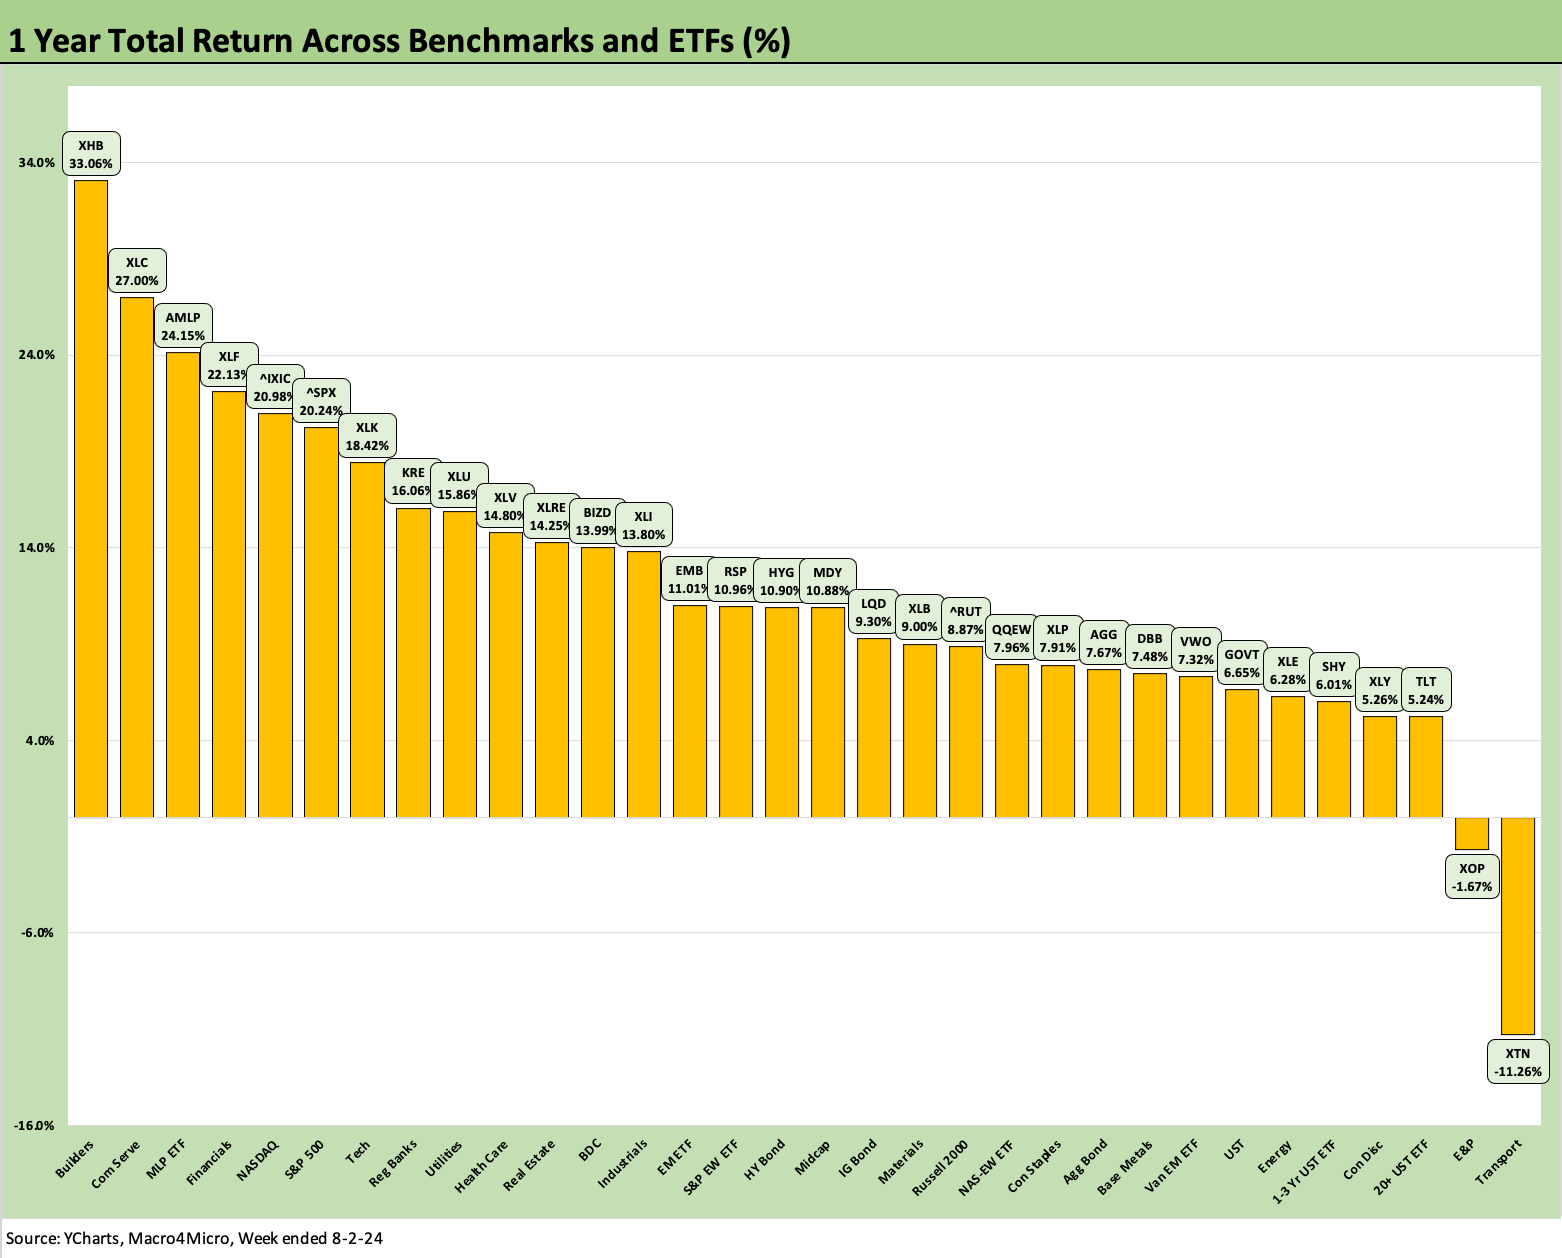
The LTM timeline still sits at 30-2 again this week with Transports (XTN) sitting on the bottom with a bigger negative number at -11.3% vs. -7.6% last week. The other member of the bottom 2 is now the E&P ETF (XOP) as last week’s second to last line item as the long duration UST ETF (TLT) moved up one notch with a great week but still only in third to last.
Bonds had a very good run during Nov-Dec 2023 and are having another one now, but over the LTM period we see 3 of the 7 bond ETFs we track in the bottom quartile (TLT, SHY, GOVT), 2 of the 7 in the third quartile (LQD, AGG), and the remaining two (EMB, HYG) in the lower end of the second quartile.
The top quartile mix still has the Homebuilders (XHB) a solid #1 followed by Communications Services (XLC) at #2 and the lower risk, cash-income intensive MLP ETF (AMLP) at #3. Rounding out the Top 5 is Financials (XLF) at #4 and the NASDAQ (IXIC) at #5 followed by the S&P 500 at #6, and Tech XLK at #7 with those last 3 riding on the back of the tech equity boom. For all of the headlines around commercial real estate, lingering deposit anxiety for a handful of regionals, and cyclical or regional concentration risk, the Regional Banks (KRE) brought up the rear in the top quartile at #8 LTM even after this week’s smackdown. As of last week, KRE was #4 for the LTM timeline.
See also:
HY Pain: A 2018 Lookback to Ponder 8-3-24
Payroll July 2024: Ready, Set, Don’t Panic 8-2-24
Employment Cost Index: June 2024 8-1-24
JOLTS June 2024: Countdown to FOMC, Ticking Clock to Mass Deportation 7-30-24
Footnotes & Flashbacks: Credit Markets 7-29-24
Footnotes & Flashbacks: State of Yields 7-28-24
Footnotes & Flashbacks: Asset Returns 7-28-22
Presidential GDP Dance Off: Clinton vs. Trump 7-27-24
Presidential GDP Dance Off: Reagan vs. Trump 7-27-24
PCE June 2024: Inflation, Income, and Outlays 7-26-24
2Q24 GDP: Into the Investment Weeds 7-25-24
GDP 2Q24: Banking a Strong Quarter for Election Season 7-25-24
Footnotes & Flashbacks: Credit Markets 7-22-24
Footnotes & Flashbacks: Credit Markets 7-15-24
Footnotes & Flashbacks: Credit Markets 7-8-24
The B vs. CCC Battle: Tough Neighborhood, Rough Players 7-7-24